


 |
市場調查報告書
商品編碼
1851589
數位轉型(DX):市場佔有率分析、產業趨勢、統計數據和成長預測(2025-2030 年)Digital Transformation (DX) - Market Share Analysis, Industry Trends & Statistics, Growth Forecasts (2025 - 2030) |
||||||
※ 本網頁內容可能與最新版本有所差異。詳細情況請與我們聯繫。
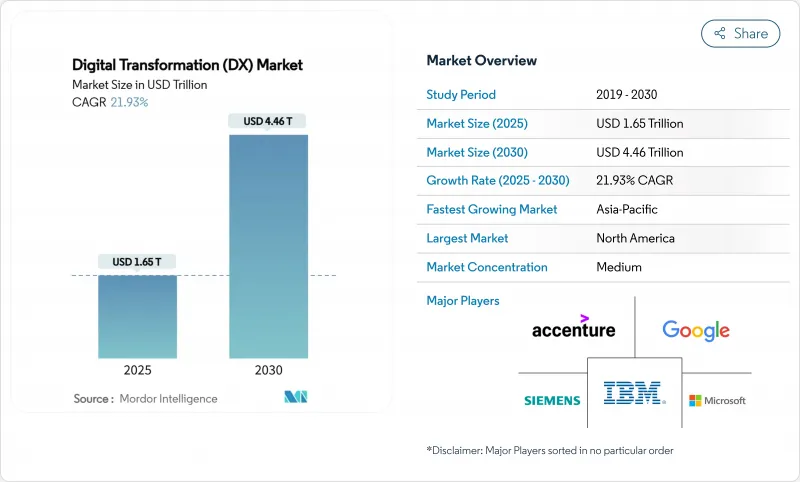
預計到 2025 年,數位轉型市場價值將達到 1.65 兆美元,到 2030 年將達到 4.46 兆美元,年複合成長率為 21.93%。
企業人工智慧的普及、優先考慮雲端服務的支出策略以及監管要求迫使企業實現營運數位化,共同推動了強勁成長。各國自主制定的人工智慧政策鼓勵企業將運算資源在地化,而5G網路則為製造業和醫療保健領域的即時應用開闢了新的應用場景。低程式碼平台將應用開發擴展到IT部門之外,而ESG(環境、社會和治理)報告規則則加速了資料主導合規投資。隨著企業在創新目標和舊有系統成本壓力之間尋求平衡,漸進式現代化策略正日益普及。儘管企業為了避免被單一供應商鎖定而採取多供應商雲端和人工智慧策略,市場競爭強度仍然適中,但超大規模雲端服務供應商的資本支出正在重新定義數位轉型市場的規模經濟。
全球數位轉型(DX)市場趨勢與洞察
雲端優先企業IT支出激增
企業正將預算從本地硬體重新分配到支援人工智慧工作負載和混合工作模式的雲端原生平台。例如,亞馬遜網路服務 (AWS) 的人工智慧助理 Amazon Q 已解答了超過 100 萬個內部開發人員的問題,節省了 45 萬小時的人力工作。雲端運算經濟縮短了採購週期,將支出從資本預算轉移到營運預算,並加快了實驗速度。微軟與可口可樂的夥伴關係等策略性交易表明,生成式人工智慧服務將建構在可擴展的雲端基礎上。隨著企業將雲端基礎設施視為必不可少的組成部分,供應商正在擴展區域資料中心,以符合主權資料規則。
加強人工智慧/機器學習在各業務職能中的整合
人工智慧正從試點階段邁向大規模生產階段。高盛已在多個部門部署了人工智慧助手,聯合健康集團正在管理超過1000個人工智慧應用案例,用於自動化保險理賠和臨床決策。國防、工業和零售業的領導者也正在效仿這一模式,將生成模型融入設計、維護和客戶體驗工作流程。同時,員工技能提升和資料管治架構也不斷完善,使人工智慧成為一項核心競爭力,而非實驗性的附加功能。
修復遺留技術債
企業仍然將高達 80% 的 IT 預算用於維護使用了數十年的系統,這擠佔了創新資金。 ServiceNow 的一項研究表明,老舊應用程式每年每個系統會對員工造成 4 萬美元的損失,每週還會佔用 17 個小時的工作時間。政府機構尤其反映了這個問題,它們每年 1000 億美元的 IT 支出中,大部分都用於維護遺留資產。由此產生的技術債增加了網路安全風險,因為過時的軟體缺乏現代化的管理。
細分市場分析
2024年,人工智慧和機器學習將佔據數位轉型市場佔有率的27.8%,預計該細分市場將以24.5%的複合年成長率成長,進一步鞏固數據主導自動化作為策略差異化優勢的地位。推動這一數位轉型市場規模成長的,是那些正在擴展聊天機器人、建議引擎和預測性維護模型的企業。高盛和洛克希德·馬丁的運作部署標誌著這些系統正從試點階段邁向關鍵任務階段。擴增實境(XR)工具已將工業工人的培訓保留率提高了275%,而沃爾瑪的食品溯源網路等區塊鏈解決方案已將驗證產品來源所需的時間從7天縮短至2.2秒。
並行部署的邊緣運算叢集在感測器附近處理數據,從而避免雲端延遲帶來的損失。工業機器人與數位孿生技術同步,實現了汽車和電子工廠的持續流程最佳化。積層製造生產線利用模具零件的即時列印來減少停機時間。這些技術的結合,進一步深化了重工業數位轉型的市場滲透。
至2024年,雲端解決方案將佔據數位轉型市場63.4%的佔有率,並在2030年之前以22.8%的複合年成長率成長。這一市場佔有率的成長與超大規模資料中心業者資料中心營運商斥資數十億美元建設資料中心密切相關。 AWS的「雷尼爾計畫」(叢集 Rainier)將Trainium 2晶片集群化,打造出全球最強大的AI訓練電腦。微軟800億美元的基礎建設投資也印證了投資週期的不斷攀升。Oracle與Google雲端合作,實現了雙向低延遲連接,且不收取退出費用。
雲端運算的經濟模式對沒有伺服器資本預算的中小型企業也極具吸引力。計量收費模式使成本與使用量掛鉤,而區域可用區則符合資料居住法規的要求。隨著時間的推移,對平台鎖定的擔憂促使許多公司將微服務分佈在多個雲端平台上,從而催生了對跨平台編配工具的需求。
數位轉型市場按技術(人工智慧和機器學習、擴增實境(VR/AR)等)、部署模式(雲端、本地部署、混合部署)、組織規模(大型企業、中小企業)、垂直產業(銀行、金融服務和保險、醫療保健和生命科學、製造和工業等)以及地區進行細分。市場預測以美元計價。
區域分析
北美將在2024年佔據32.3%的數位轉型市場佔有率,這主要得益於雄厚的創業投資和接近性超大規模雲端總部的地理優勢。光是德克薩斯州就正在經歷一項由英偉達超級電腦驅動的5,000億美元資料中心擴建項目,同時德克薩斯投資300億美元的晶片工廠也將新增數千個技術職缺。聯邦和州政府機構正在使用「漢弗萊」等人工智慧助理來自動化行政任務,這進一步推動了市場需求。美墨加協定下的跨國合作將有助於加拿大和墨西哥實現製造業的數位化。
亞太地區將以22.4%的複合年成長率實現最快成長,這主要得益於政府大規模的基礎設施項目和行動優先的消費行為。數位錢包在電子商務結帳中佔近70%,凸顯了該地區數位錢包的指數級成長。印度、日本和韓國都已啟動國家人工智慧戰略,澳洲昆士蘭州也已累計12億澳元(約8億美元)用於發展自主雲端服務。這些發展共同擴大了數位轉型市場的潛在規模。
歐洲透過 eIDAS 2.0 強調數位主權,強制要求在 2027 年實現歐洲數位身分錢包的普遍認可。德國的 EuroStack 計畫預測,到 2035 年,將有 3000 億歐元投資用於計算堆疊本地化。石勒蘇益格-荷爾斯泰因州正逐步淘汰專有軟體,將主權理念轉化為現實。儘管南美洲和中東及非洲地區落後於主要區域,但外國對光纖骨幹、雲端區域和 5G 部署的投資不斷增加,正在創造新的服務機會。
其他福利:
- Excel格式的市場預測(ME)表
- 3個月的分析師支持
目錄
第1章 引言
- 研究假設和市場定義
- 調查範圍
第2章調查方法
第3章執行摘要
第4章 市場情勢
- 市場概覽
- 市場促進因素
- 雲端優先企業IT支出激增
- 加強人工智慧/機器學習在各業務職能中的整合
- 5G賦能的即時資料用例
- ESG報告強制數位化
- 「數位主權」:一波公共資金浪潮
- 一個低程式碼/無程式碼平台,讓數位轉型惠及大眾
- 市場限制
- 遺留技術債鎖定
- 網路人才短缺和薪資上漲
- 數位身分監管碎片化
- 第三類ESG審核的數據品質差距
- 供應鏈分析
- 監管環境
- 技術展望
- 波特五力模型
- 新進入者的威脅
- 供應商的議價能力
- 買方的議價能力
- 替代品的威脅
- 競爭對手之間的競爭
- 生態系分析
- 評估市場的宏觀經濟因素
第5章 市場規模與成長預測
- 透過技術
- 人工智慧和機器學習
- 擴增實境(VR/AR)
- 物聯網 (IoT)
- 工業機器人
- 區塊鏈
- 數位雙胞胎
- 積層製造/工業3D列印
- 邊緣運算
- 其他
- 按部署模式
- 雲
- 本地部署
- 混合
- 按組織規模
- 主要企業
- 中小企業
- 按行業
- BFSI
- 醫療保健和生命科學
- 製造業和工業
- 零售與電子商務
- 能源與公共產業
- 汽車與運輸
- 政府和公共機構
- 其他(媒體、教育等)
- 按地區
- 北美洲
- 美國
- 加拿大
- 墨西哥
- 南美洲
- 巴西
- 阿根廷
- 其他南美洲
- 歐洲
- 德國
- 英國
- 法國
- 義大利
- 西班牙
- 其他歐洲地區
- 亞太地區
- 中國
- 日本
- 印度
- 韓國
- 東南亞
- 亞太其他地區
- 中東和非洲
- 中東
- 沙烏地阿拉伯
- 阿拉伯聯合大公國
- 土耳其
- 其他中東地區
- 非洲
- 南非
- 奈及利亞
- 埃及
- 其他非洲地區
- 北美洲
第6章 競爭情勢
- 市場集中度
- 策略趨勢
- 市佔率分析
- 公司簡介
- Accenture
- Microsoft
- IBM
- Google(Alphabet)
- AWS(Amazon)
- SAP
- Oracle
- Adobe
- Salesforce
- Cisco Systems
- Dell Technologies
- Siemens
- Hewlett Packard Enterprise
- Cognex
- Apple
- ServiceNow
- Infosys
- Capgemini
- Wipro
- Schneider Electric
- Honeywell
- Hitachi
- Fujitsu
- Huawei
第7章 市場機會與未來展望
The digital transformation market is valued at USD 1.65 trillion in 2025 and is projected to climb to USD 4.46 trillion by 2030, advancing at a 21.93% CAGR.
Strong growth stems from enterprise AI adoption, cloud-first spending priorities, and regulatory mandates that compel organizations to digitize operations. Sovereign-AI policies push companies to localize computing, while 5G networks open real-time use cases in manufacturing and healthcare. Low-code platforms extend application development beyond IT departments, and ESG reporting rules accelerate data-driven compliance investments. Incremental modernization strategies gain favor as enterprises balance innovation goals with legacy-system cost pressures. Competitive intensity remains moderate because businesses pursue multi-vendor cloud and AI strategies to avoid lock-in, yet hyperscale-provider capital expenditure is redefining scale economics in the digital transformation market.
Global Digital Transformation (DX) Market Trends and Insights
Cloud-first enterprise IT spending boom
Organizations are reallocating budgets from on-premise hardware toward cloud-native platforms that support AI workloads and hybrid work models. For example, Amazon Web Services resolved more than 1 million internal developer questions with its AI assistant Amazon Q, saving 450,000 hours of manual effort. Cloud economics shorten procurement cycles and shift spending from capital to operating budgets, allowing faster experimentation. Strategic deals, such as Microsoft's partnership with Coca-Cola, show how generative-AI services ride atop scalable cloud foundations. As enterprises view cloud infrastructure as essential, vendors expand regional data centers to comply with sovereign-data rules.
Rising AI/ML integration across business functions
AI moves from pilots to production at scale. Goldman Sachs rolled out AI assistants across multiple departments, and UnitedHealth Group manages more than 1,000 AI use cases that automate claims and clinical decisions. Defense, industrial, and retail leaders replicate the pattern, embedding generative models in design, maintenance, and customer-experience workflows. Workforce upskilling and data-governance frameworks mature in tandem, making AI a core competency rather than an experimental add-on.
Legacy technical-debt lock-ins
Enterprises still devote up to 80% of IT budgets to maintain decades-old systems, reducing funds for innovation. ServiceNow found that aging applications cost USD 40,000 annually per system and drain 17 employee hours weekly.Government agencies illustrate the problem, spending the majority of their USD 100 billion IT outlay on legacy assets. The resulting technical debt inflates cybersecurity risk because outdated software lacks modern controls.
Other drivers and restraints analyzed in the detailed report include:
- 5G-enabled real-time data use-cases
- Mandatory ESG reporting digitisation
- Cyber-talent scarcity and wage inflation
For complete list of drivers and restraints, kindly check the Table Of Contents.
Segment Analysis
AI and ML claimed 27.8% of digital transformation market share in 2024, and the segment is expected to grow at 24.5% CAGR, reinforcing that data-driven automation is a strategic differentiator. This portion of the digital transformation market size is fueled by enterprises scaling chatbots, recommendation engines, and predictive-maintenance models. Production deployments at Goldman Sachs and Lockheed Martin exemplify the shift from pilots to mission-critical systems. Extended-Reality tools deliver 275% training-retention gains for industrial employees, while blockchain solutions such as Walmart's food-traceability network cut provenance checks from 7 days to 2.2 seconds.
A parallel wave of edge-computing clusters processes data near sensors to avoid cloud-latency penalties. Industrial robotics synchronized with digital twins allow continuous process optimization in automotive and electronics plants. Additive-manufacturing lines use real-time prints of tooling components to shrink downtime. Together these technologies deepen the digital transformation market penetration across heavy industries.
Cloud solutions owned 63.4% of digital transformation market share in 2024 and will expand at 22.8% CAGR through 2030. This share of the digital transformation market size correlates with hyperscalers' multi-billion-dollar data-center builds. AWS's Project Rainier clusters Trainium 2 chips into the world's most powerful AI training computer. Microsoft's USD 80 billion infrastructure spend underscores escalating investment cycles. Enterprises retain on-premises nodes for regulated workloads, yet hybrid architectures flourish; Oracle's pact with Google Cloud allows bidirectional low-latency links with no egress fees.
Cloud economics also attract small businesses that lack capital budgets for servers. Pay-as-you-go models align costs with usage, and regional availability zones satisfy data-residency regulations. Over time, platform lock-in concerns lead many firms to distribute microservices across multiple clouds, creating demand for cross-plane orchestration tools.
Digital Transformation Market is Segmented by Technology (AI and ML, Extended Reality (VR/AR), and More), Deployment Model (Cloud, On-Premises, Hybrid), Organization Size (Large Enterprises, Small and Medium Enterprises (SMEs)), Industry Vertical (BFSI, Healthcare and Life-Sciences, Manufacturing and Industrial, and More), and by Geography. The Market Forecasts are Provided in Terms of Value (USD).
Geography Analysis
North America secured 32.3% of digital transformation market share in 2024, anchored by deep venture capital pools and proximity to hyperscale-cloud headquarters. Texas alone hosts a USD 500 billion data-center expansion featuring NVIDIA supercomputers, plus Texas Instruments' USD 30 billion chip plant that adds thousands of tech jobs. Federal and state agencies adopt AI assistants like "Humphrey" to automate administrative tasks, further boosting demand. Cross-border initiatives under USMCA support manufacturing digitisation throughout Canada and Mexico.
Asia-Pacific delivers the fastest growth at 22.4% CAGR due to extensive government infrastructure programs and mobile-first consumer behavior. Digital wallets account for nearly 70% of e-commerce checkouts, highlighting the region's leapfrog adoption curves. India, Japan, and South Korea each articulate national AI strategies, while Australia's Queensland earmarked AUD 1.2 billion (USD 800 million) for sovereign-cloud services. Combined, these moves expand the addressable digital transformation market.
Europe emphasizes digital sovereignty under eIDAS 2.0, mandating universal acceptance of European Digital Identity Wallets by 2027. Germany's EuroStack program predicts EUR 300 billion investment to localize compute stacks by 2035. Schleswig-Holstein's migration away from proprietary software shows practical implementation of sovereignty ideals. South America and the Middle East and Africa trail the leading regions but experience rising foreign investment in fiber backbones, cloud regions, and 5G rollouts, unlocking new service opportunities.
- Accenture
- Microsoft
- IBM
- Google (Alphabet)
- AWS (Amazon)
- SAP
- Oracle
- Adobe
- Salesforce
- Cisco Systems
- Dell Technologies
- Siemens
- Hewlett Packard Enterprise
- Cognex
- Apple
- ServiceNow
- Infosys
- Capgemini
- Wipro
- Schneider Electric
- Honeywell
- Hitachi
- Fujitsu
- Huawei
Additional Benefits:
- The market estimate (ME) sheet in Excel format
- 3 months of analyst support
TABLE OF CONTENTS
1 INTRODUCTION
- 1.1 Study Assumptions and Market Definition
- 1.2 Scope of the Study
2 RESEARCH METHODOLOGY
3 EXECUTIVE SUMMARY
4 MARKET LANDSCAPE
- 4.1 Market Overview
- 4.2 Market Drivers
- 4.2.1 Cloud-first enterprise IT spending boom
- 4.2.2 Rising AI/ML integration across business functions
- 4.2.3 5G-enabled real-time data use-cases
- 4.2.4 Mandatory ESG reporting digitisation
- 4.2.5 "Digital-sovereignty" public-sector funding waves
- 4.2.6 Low-code / no-code platforms democratising DX
- 4.3 Market Restraints
- 4.3.1 Legacy technical-debt lock-ins
- 4.3.2 Cyber-talent scarcity and wage inflation
- 4.3.3 Digital-identity regulatory fragmentation
- 4.3.4 Scope-3 data-quality gaps for ESG audits
- 4.4 Supply-Chain Analysis
- 4.5 Regulatory Landscape
- 4.6 Technological Outlook
- 4.7 Porter's Five Forces
- 4.7.1 Threat of New Entrants
- 4.7.2 Bargaining Power of Suppliers
- 4.7.3 Bargaining Power of Buyers
- 4.7.4 Threat of Substitutes
- 4.7.5 Competitive Rivalry
- 4.8 Industry Ecosystem Analysis
- 4.9 Assesment of Macroeconomic Factors on the market
5 MARKET SIZE AND GROWTH FORECASTS (VALUE)
- 5.1 By Technology
- 5.1.1 AI and ML
- 5.1.2 Extended Reality (VR/AR)
- 5.1.3 Internet of Things (IoT)
- 5.1.4 Industrial Robotics
- 5.1.5 Blockchain
- 5.1.6 Digital Twin
- 5.1.7 Additive Manufacturing / Industrial 3-D Printing
- 5.1.8 Edge Computing
- 5.1.9 Others
- 5.2 By Deployment Model
- 5.2.1 Cloud
- 5.2.2 On-Premise
- 5.2.3 Hybrid
- 5.3 By Organization Size
- 5.3.1 Large Enterprises
- 5.3.2 Small and Medium Enterprises (SMEs)
- 5.4 By Industry Vertical
- 5.4.1 BFSI
- 5.4.2 Healthcare and Life-Sciences
- 5.4.3 Manufacturing and Industrial
- 5.4.4 Retail and E-commerce
- 5.4.5 Energy and Utilities
- 5.4.6 Automotive and Transportation
- 5.4.7 Government and Public Sector
- 5.4.8 Others (Media, Education, etc.)
- 5.5 By Geography
- 5.5.1 North America
- 5.5.1.1 United States
- 5.5.1.2 Canada
- 5.5.1.3 Mexico
- 5.5.2 South America
- 5.5.2.1 Brazil
- 5.5.2.2 Argentina
- 5.5.2.3 Rest of South America
- 5.5.3 Europe
- 5.5.3.1 Germany
- 5.5.3.2 United Kingdom
- 5.5.3.3 France
- 5.5.3.4 Italy
- 5.5.3.5 Spain
- 5.5.3.6 Rest of Europe
- 5.5.4 Asia-Pacific
- 5.5.4.1 China
- 5.5.4.2 Japan
- 5.5.4.3 India
- 5.5.4.4 South Korea
- 5.5.4.5 Southeast Asia
- 5.5.4.6 Rest of Asia-Pacific
- 5.5.5 Middle East and Africa
- 5.5.5.1 Middle East
- 5.5.5.1.1 Saudi Arabia
- 5.5.5.1.2 United Arab Emirates
- 5.5.5.1.3 Turkey
- 5.5.5.1.4 Rest of Middle East
- 5.5.5.2 Africa
- 5.5.5.2.1 South Africa
- 5.5.5.2.2 Nigeria
- 5.5.5.2.3 Egypt
- 5.5.5.2.4 Rest of Africa
- 5.5.1 North America
6 COMPETITIVE LANDSCAPE
- 6.1 Market Concentration
- 6.2 Strategic Moves
- 6.3 Market Share Analysis
- 6.4 Company Profiles {(includes Global level Overview, Market level overview, Core Segments, Financials as available, Strategic Information, Market Rank/Share for key companies, Products and Services, and Recent Developments)}
- 6.4.1 Accenture
- 6.4.2 Microsoft
- 6.4.3 IBM
- 6.4.4 Google (Alphabet)
- 6.4.5 AWS (Amazon)
- 6.4.6 SAP
- 6.4.7 Oracle
- 6.4.8 Adobe
- 6.4.9 Salesforce
- 6.4.10 Cisco Systems
- 6.4.11 Dell Technologies
- 6.4.12 Siemens
- 6.4.13 Hewlett Packard Enterprise
- 6.4.14 Cognex
- 6.4.15 Apple
- 6.4.16 ServiceNow
- 6.4.17 Infosys
- 6.4.18 Capgemini
- 6.4.19 Wipro
- 6.4.20 Schneider Electric
- 6.4.21 Honeywell
- 6.4.22 Hitachi
- 6.4.23 Fujitsu
- 6.4.24 Huawei
7 MARKET OPPORTUNITIES AND FUTURE OUTLOOK
- 7.1 White-space and Unmet-need Assessment
 2025年全球數位港口排隊平台市場報告
 數位轉型市場預測至2032年:按組件、部署模式、公司規模、技術、業務功能、最終用戶和地區分類的全球分析
 數位轉型市場:依產品類型、部署方式、組織規模、業務職能和產業分類-2025-2032年全球預測物流市場數位轉型:依物流類型、技術、實施類型、組織規模及最終用戶分類-2025-2032年全球預測2025年全球數位轉型市場報告
 全球數位轉型市場(至 2031 年)按解決方案(客戶經驗和流程自動化平台)、服務(應用程式和基礎設施現代化)和轉型重點領域(財務、營運、勞動力)分類
 2025 年至 2033 年數位轉型市場規模、佔有率、趨勢及預測(按類型、部署模式、企業規模、最終用途產業及地區)數位轉型保險解決方案市場(按組件、部署、技術、保險類型、組織規模和最終用戶分類)—2025 年至 2030 年全球預測
 製造業數位轉型的全球市場
 CISO洞察:軟體供應鏈安全領域的挑戰與機會