


 |
市場調查報告書
商品編碼
1851588
鋰離子電池:市場佔有率分析、行業趨勢、統計數據和成長預測(2025-2030 年)Lithium-ion Battery - Market Share Analysis, Industry Trends & Statistics, Growth Forecasts (2025 - 2030) |
||||||
※ 本網頁內容可能與最新版本有所差異。詳細情況請與我們聯繫。
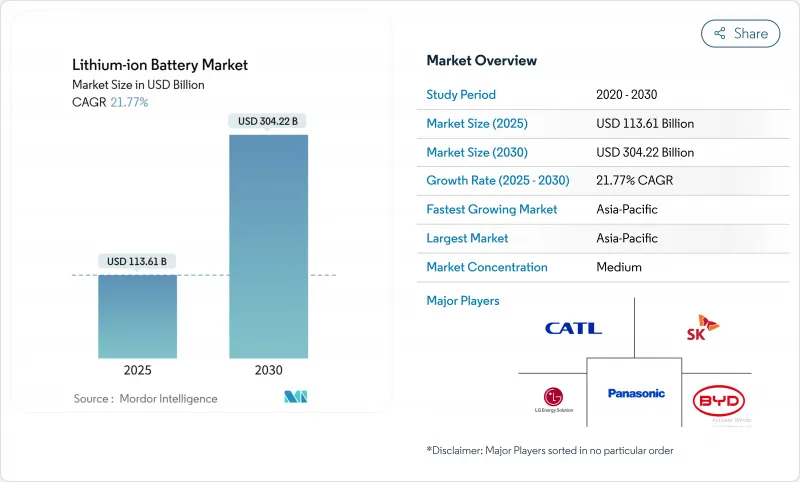
預計到 2025 年,鋰離子電池市場規模將達到 1,136.1 億美元,到 2030 年將達到 3,042.2 億美元,在預測期(2025-2030 年)內複合年成長率為 21.77%。
到2024年,平均電池組價格將降至115美元/千瓦時,這將是自2017年以來最大的年度降幅。亞太地區55%的市佔率反映了中國在電池生產和負極材料領域的領先地位,而北美和歐洲正在加速本地化以規避供應風險。產品創新主要集中在提高能量密度上,富矽負極正逐步走向商業性實用化。電力公司正在採用多小時儲能系統來穩定可再生能源發電,而汽車製造商正在將入門級電動車轉向成本最佳化的磷酸鐵鋰電池。這些因素共同作用,強化了銷售成長和成本下降的良性循環,將支撐長期需求。
全球鋰離子電池市場趨勢及洞察
遠距電動車平台對高能量密度電池的需求快速成長
製造商的目標是研發能量密度超過300Wh kg⁻¹的電芯,並承諾在不增加電池組尺寸的情況下實現400英里的續航里程。矽基負極的比能量比石墨負極高40%。這一趨勢與電芯到電池組的一體化架構的採用相吻合,該架構可降低結構重量和製造成本。預計到2029年,這種新型電池的價格將與現有電池持平,比先前預期提前了三年。汽車製造商認為,這些進步對於電動車在北美和歐洲市場的普及至關重要,因為里程焦慮是這兩個市場的主要障礙。因此,採購合約越來越明確規定能量密度目標,從而在鋰離子電池市場開闢了一個新的高階細分市場。
中國的產業政策(「中國製造2025」)將加速國內鋰離子超級工廠的興建。
到2024年,中國將佔據全球電池儲能產能的93.5%,反映了其在電芯製造和上游材料方面無可比擬的規模優勢。從原料提煉到組件組裝的垂直整合,使得中國電池的生產成本比歐洲同行低約20%,即便原料投入相近。業界領導企業寧德時代(CATL)正利用這一成本優勢,在印尼和匈牙利擴張,以確保鎳的供應,並在匈牙利建設數吉瓦時的工廠,為歐洲原始設備製造商(OEM)供貨。政策主導的快速成長正在鞏固中國在電池供應領域的主導地位,迫使其他地區為本地計劃提供補貼以維持戰略自主。這種結構性優勢奠定了中國企業在鋰離子電池市場的關鍵地位。
中國的環境法規收緊了石墨負極的供應
中國供應全球約90%的負極材料。黑龍江和內蒙古的環境檢查導致2024年產量暫時減少15%。美國和歐洲的下游電池工廠報告交貨前置作業時間延長,現貨價格上漲,暴露出地域集中度風險。韓國和美國的合成石墨計劃旨在實現供應多元化,但預計商業化生產將落後需求數年。短缺風險促使一些汽車製造商提前評估富矽負極材料,並重塑整個鋰離子電池市場的材料藍圖。
細分市場分析
到2024年,NMC將佔據鋰離子電池市場45%的佔有率,這主要得益於其高能量密度,尤其適用於高階電動車。預計到2030年,磷酸鐵鋰(LFP)鋰離子電池市場規模將以23.4%的複合年成長率成長,隨著對成本敏感的車款越來越受歡迎,NMC的領先優勢將受到削弱。改進的陰極塗層和更嚴格的電池公差正在將LFP的能量密度提升到以往只有富鎳電池才能達到的水平,從而降低電池組總成本並緩解鈷價格波動的影響。
不同應用領域的需求軌跡各不相同。 NMC在高性能電動車和航太計劃中佔據了一席之地,這些專案需要最大續航里程;而LCO在主流消費性電子產品領域仍然具有重要地位。 LTO和LMFP則服務於對循環壽命和耐溫性要求極高的特定應用場景。跨化學體系的雜合反應,例如在LFP中添加錳,凸顯了供應商如何客製化電化學系統以滿足鋰離子電池產業特定的性能需求。
到2024年,圓柱形電芯將佔據鋰離子電池市場50%的佔有率,這主要得益於現有汽車製造商採用高度自動化的組裝。然而,軟包電芯憑藉其輕薄的外形和即使在有限空間內也能保持的高封裝效率,預計到2030年將以22.5%的複合年成長率成長。對比測試表明,當應用於滑板底盤時,軟包電芯在電池組層面的單位重量能量密度比圓柱形電芯高出6-8%。
棱柱形電池約佔總出貨量的40%,兼具良好的機械強度和體積效率,因此在中國的公車和卡車平台上廣受歡迎。由此可見,外形規格的差異體現在各廠商的設計理念:特斯拉的4680圓柱形電池藍圖優先考慮規模和能量密度,而比亞迪的刀片式棱柱形電池則強調安全性和成本。這種並存的局面表明,在日益多元化的鋰離子電池市場中,差異化策略能夠蓬勃發展。
鋰離子電池市場報告按產品類型(鈷酸鋰、磷酸鋰鐵、鎳錳鈷鋰、其他)、外形規格(圓柱形、棱柱形、軟包)、功率容量(0-3,000 mAh、3,001-10,000 mAh、其他)、歐洲亞克、南美電器、其他汽車、其他汽車、北美市場)。
區域分析
預計到2024年,亞太地區將佔鋰離子電池市場55%的佔有率,到2030年將以31%的複合年成長率成長。僅中國就佔全球電池產量的約70%和負極材料的約90%,這得益於其規模經濟和一體化的供應鏈。日本和韓國繼續專注於高性能化學品,而印度則在生產連結獎勵計畫計劃下加快建設國內超級工廠,目標是到2030年實現年產能104吉瓦時。
北美將受惠於抑制通膨的立法,預計到2030年,電池標示容量達到每年1,300吉瓦時,足以滿足1,000萬輛電動車的需求。新建廠集中在中西部-東南部走廊沿線,集中了電池級鎳、氫氧化鋰和回收設施。擴大正極前驅體材料的生產規模仍面臨挑戰,目前正在與亞洲合作夥伴開展合資項目,以轉移製程技術。
在波蘭115GWh的LG能源解決方案綜合體和匈牙利新計畫的引領下,歐洲的目標是到2030年佔全球電池產量的30%。嚴格的碳排放法規正推動製造商轉向再生能源和完善的回收系統。同時,在南美洲,阿根廷的Sal de Vida公司計劃每年生產1.5萬噸電池級碳酸鹽。在中東和非洲,LG正利用關鍵的礦產合作關係來滿足該地區對太陽能+儲能的夥伴關係,例如其在烏干達的鋰離子電池組工廠。
其他福利:
- Excel格式的市場預測(ME)表
- 3個月的分析師支持
目錄
第1章 引言
- 研究假設和市場定義
- 調查範圍
第2章調查方法
第3章執行摘要
第4章 市場情勢
- 市場概覽
- 市場促進因素
- 遠距電動車平台對高能量密度電池的需求快速成長
- 中國的產業政策(「中國製造2025」)正加速興建國內鋰離子超級工廠。
- 美國公用事業規模電池採購快速擴張
- 北歐國家從VRLA到鋰離子固定式資料中心備份的過渡
- 國際海事組織溫室氣體減量目標推動歐洲船用鋰離子電池的普及
- 印度對成本敏感的入門級電動車整車製造商轉向磷酸鐵鋰電池
- 市場限制
- 中國的環境法規正在收緊石墨負極的供應。
- 烏克蘭衝突後高壓電解液添加劑成本上漲
- 美國和歐盟在關鍵礦產上的貿易壁壘破壞了跨大西洋供應鏈。
- 大洋洲缺乏回收基礎設施,減緩了物質循環流動。
- 供應鏈分析
- 最新進展
- 監理展望
- 技術展望
- 價格趨勢分析
- 波特五力模型
- 供應商的議價能力
- 買方的議價能力
- 新進入者的威脅
- 替代品的威脅
- 競爭對手之間的競爭
第5章 市場規模與成長預測
- 依產品類型
- 鈷酸鋰(LCO)
- 磷酸鋰鐵(LFP)
- 鋰鎳錳鈷(NMC)
- 鋰鎳鈷鋁(NCA)
- 錳酸鋰(LMO)
- 鈦酸鋰(LTO)
- 按外形規格
- 圓柱形
- 棱鏡
- 小袋
- 按功率容量
- 0~3,000 mAh
- 3,001~10,000 mAh
- 10,001~60,000 mAh
- 60,000mAh 或以上
- 按最終用途行業分類
- 汽車(電動車、油電混合車、插電式油電混合車)
- 消費性電子產品
- 工業和電動工具
- 固定式儲能
- 航太/國防
- 船
- 按地區
- 北美洲
- 美國
- 加拿大
- 墨西哥
- 歐洲
- 英國
- 德國
- 法國
- 西班牙
- 北歐國家
- 俄羅斯
- 其他歐洲地區
- 亞太地區
- 中國
- 印度
- 日本
- 韓國
- 馬來西亞
- 泰國
- 印尼
- 越南
- 澳洲
- 亞太其他地區
- 南美洲
- 巴西
- 阿根廷
- 哥倫比亞
- 其他南美洲國家
- 中東和非洲
- 阿拉伯聯合大公國
- 沙烏地阿拉伯
- 南非
- 埃及
- 其他中東和非洲地區
- 北美洲
第6章 競爭情勢
- 市場集中度
- 策略性舉措(併購、合作、購電協議)
- 市場佔有率分析(主要企業的市場排名/佔有率)
- 公司簡介
- Contemporary Amperex Technology Co., Ltd.(CATL)
- BYD Company Limited
- LG Energy Solution Ltd.
- Panasonic Holdings Corp.
- Samsung SDI Co., Ltd.
- SK On Co., Ltd.
- AESC(Envision AESC Group)
- CALB Co., Ltd.
- Gotion High-Tech Co., Ltd.
- EVE Energy Co., Ltd.
- Farasis Energy Inc.
- Sunwoda Electronic Co., Ltd.
- Murata Manufacturing Co., Ltd.
- VARTA AG
- Toshiba Corporation
- Saft Groupe SAS
- Northvolt AB
- Microvast Holdings, Inc.
- A123 Systems LLC
- Hitachi Energy Ltd.
- Lithium Werks BV
- Tesla Inc.(Battery Division)
第7章 市場機會與未來展望
The Lithium-ion Battery Market size is estimated at USD 113.61 billion in 2025, and is expected to reach USD 304.22 billion by 2030, at a CAGR of 21.77% during the forecast period (2025-2030).
Momentum comes from steep cost deflation-average pack prices fell to USD 115 per kWh in 2024, their sharpest annual drop since 2017-and from policy mandates that require large-scale electrification across transport and power systems. A 55% market share in Asia-Pacific reflects China's command of cell production and anode materials, while North America and Europe accelerate localisation to hedge supply risk. Product innovation pivots around energy density gains, with silicon-rich anodes moving toward commercial viability. Utilities are adopting multi-hour storage to stabilise renewable generation, and automakers shift entry-level EVs toward cost-oriented LFP chemistry. Together these factors reinforce a virtuous cycle of rising volumes and falling cost that underpins long-term demand.
Global Lithium-ion Battery Market Trends and Insights
Surging Demand for High-Energy-Density Batteries in Long-Range EV Platforms
Manufacturers are pushing beyond 300 Wh kg-1 toward cells that promise 400-mile driving range without enlarging packs. Silicon-dominant anodes raise specific energy by up to 40% relative to graphite. The move coincides with adoption of cell-to-pack architectures that reduce structural weight and lower production cost. Price parity with incumbent chemistries is now expected before 2029, three years sooner than earlier estimates. Automakers view these advances as critical to mainstream EV acceptance in North America and Europe, markets where range anxiety remains a primary hurdle. As a result, procurement contracts increasingly stipulate energy density targets, creating new premium niches in the lithium-ion battery market.
China's Industrial Policy ("Made in China 2025") Accelerating Domestic Li-ion Gigafactory Build-out
China shipped 93.5% of global energy-storage batteries in 2024, reflecting unrivalled scale in cell manufacturing and upstream materials. Vertical integration spans raw-material refining through module assembly, enabling production costs roughly 20% below European peers despite similar commodity inputs. Champion supplier CATL leverages this cost edge to expand in Indonesia, securing nickel supply, and in Hungary, where a multi-GWh plant will serve European OEMs. The policy-driven surge cements China's supplier dominance and forces rival regions to subsidise local projects to preserve strategic autonomy. This structural advantage sustains a pivotal role for Chinese firms in the lithium-ion battery market.
Graphite Anode Supply Tightness Owing to Chinese Environmental Curtailments
China supplies about 90% of global anode material. Temporary shutdowns in Heilongjiang and Inner Mongolia cut output 15% during 2024 environmental inspections. Downstream cell plants in the United States and Europe reported lead-time extensions and spot-price increases, exposing geographic concentration risk. Synthetic graphite projects in South Korea and the United States aim to diversify supply; however, commercial volumes will lag demand for several years. Shortage risk prompts some automakers to evaluate silicon-rich anodes faster than planned, reshaping material roadmaps across the lithium-ion battery market.
Other drivers and restraints analyzed in the detailed report include:
- Rapid Roll-out of Utility-Scale Battery Energy Storage Procurements in the United States
- Stationary Data-Centre Back-up Migration from VRLA to Lithium-ion in Nordic Countries
- High-Voltage Electrolyte Additive Cost Inflation Post-Ukraine Conflict
For complete list of drivers and restraints, kindly check the Table Of Contents.
Segment Analysis
NMC accounted for 45% of lithium-ion battery market share in 2024, supported by its high energy density that suits premium EVs. The lithium-ion battery market size for LFP is forecast to rise at 23.4% CAGR through 2030, eroding NMC's lead as cost-sensitive models proliferate. Improved cathode coatings and tighter cell tolerances lift LFP energy density into ranges once reserved for nickel-rich chemistries, lowering total pack cost and mitigating cobalt-price volatility.
Demand trajectories are diverging by application. NMC retains a foothold in performance EVs and aerospace projects requiring maximal range, whereas LCO maintains relevance in flagship consumer electronics. LTO and LMFP serve niche use cases where extreme cycle life or temperature tolerance is paramount. Cross-chemistry hybridisation-such as adding manganese to LFP-highlights how suppliers customise electro-chemistry to address specific performance envelopes inside the lithium-ion battery industry.
Cylindrical cells held 50% of the lithium-ion battery market in 2024, anchored by automotive incumbents exploiting highly automated assembly lines. Pouch cells, however, expand 22.5% CAGR by 2030 as their thin profile enables higher packing efficiency in constrained spaces. Comparative testing shows pouch formats deliver 6-8% higher gravimetric energy at pack level when integrated into skateboard chassis.
Prismatic cells, representing around 40% of shipments, strike a balance between mechanical robustness and volumetric efficiency, making them popular among Chinese bus and truck platforms. The form-factor landscape thus segments by OEM design philosophy: Tesla's 4680 cylindrical cell roadmap prioritises scale and energy density, while BYD's blade-style prismatics champion safety and cost. This coexistence demonstrates how differentiated strategies thrive within the diversified lithium-ion battery market.
The Lithium-Ion Battery Market Report is Segmented by Product Type (Lithium Cobalt Oxide, Lithium Iron Phosphate, Lithium Nickel Manganese Cobalt, and Others), Form Factor (Cylindrical, Prismatic, and Pouch), Power Capacity (0 To 3, 000 MAh, 3, 001 To 10, 000 MAh, and Others), End-Use Industry (Automotive, Consumer Electronics, and Others), and Geography (North America. Europe, Asia-Pacific, South America, and Middle East and Africa).
Geography Analysis
Asia-Pacific commanded 55% of the lithium-ion battery market in 2024 and is forecast to post a 31% CAGR to 2030. China alone accounts for roughly 70% of global cell output and 90% of anode materials, leveraging economies of scale and integrated supply chains. Japan and South Korea continue to focus on high-performance chemistries, while India accelerates domestic gigafactory builds under its Production-Linked Incentive programme targeting 104 GWh annual capacity by 2030.
North America benefits from the Inflation Reduction Act, with cell nameplate capacity projected to reach 1,300 GWh yr-1 by 2030, sufficient for 10 million EVs. New plants cluster along the Midwest-to-Southeast corridor where battery-grade nickel, lithium-hydroxide and recycling facilities co-locate. Challenges remain in scaling precursor cathode materials, prompting joint ventures with Asian partners to transfer process know-how.
Europe seeks 30% of global cell production by 2030, led by Poland's 115 GWh LG Energy Solution complex and new projects in Hungary. Strict carbon-footprint regulations push manufacturers toward renewable electricity and robust recycling schemes. Meanwhile, South America monetises lithium brine resources, with Argentina's Sal de Vida targeting 15 kt yr-1 of battery-grade carbonate. The Middle East & Africa leverages critical mineral partnerships, exemplified by a Ugandan lithium-ion pack plant serving regional solar-plus-storage demand.
- Contemporary Amperex Technology Co., Ltd. (CATL)
- BYD Company Limited
- LG Energy Solution Ltd.
- Panasonic Holdings Corp.
- Samsung SDI Co., Ltd.
- SK On Co., Ltd.
- AESC (Envision AESC Group)
- CALB Co., Ltd.
- Gotion High-Tech Co., Ltd.
- EVE Energy Co., Ltd.
- Farasis Energy Inc.
- Sunwoda Electronic Co., Ltd.
- Murata Manufacturing Co., Ltd.
- VARTA AG
- Toshiba Corporation
- Saft Groupe SAS
- Northvolt AB
- Microvast Holdings, Inc.
- A123 Systems LLC
- Hitachi Energy Ltd.
- Lithium Werks BV
- Tesla Inc. (Battery Division)
Additional Benefits:
- The market estimate (ME) sheet in Excel format
- 3 months of analyst support
TABLE OF CONTENTS
1 Introduction
- 1.1 Study Assumptions & Market Definition
- 1.2 Scope of the Study
2 Research Methodology
3 Executive Summary
4 Market Landscape
- 4.1 Market Overview
- 4.2 Market Drivers
- 4.2.1 Surging Demand for High-Energy-Density Batteries in Long-Range EV Platforms
- 4.2.2 China's Industrial Policy ("Made in China 2025") Accelerating Domestic Li-ion Gigafactory Build-out
- 4.2.3 Rapid Roll-out of Utility-Scale Battery Energy Storage Procurements in the United States
- 4.2.4 Stationary Data-centre Back-up Migration from VRLA to Lithium-ion in Nordic Countries
- 4.2.5 Maritime IMO GHG targets Driving Marine-Grade Li-ion Adoption in Europe
- 4.2.6 OEM Shift to LFP Chemistry for Cost-Sensitive Entry-Level EVs in India
- 4.3 Market Restraints
- 4.3.1 Graphite Anode Supply Tightness Owing to Chinese Environmental Curtailments
- 4.3.2 High-Voltage Electrolyte Additive Cost Inflation Post-Ukraine Conflict
- 4.3.3 US-EU Trade Barriers on Critical Minerals Undermining Trans-Atlantic Supply Chains
- 4.3.4 Recycling Infrastructure Lag Delaying Circular Material Flows in Oceania
- 4.4 Supply-Chain Analysis
- 4.5 Recent Trends & Developments
- 4.6 Regulatory Outlook
- 4.7 Technology Outlook
- 4.8 Price Trend Analysis
- 4.9 Porter's Five Forces
- 4.9.1 Bargaining Power of Suppliers
- 4.9.2 Bargaining Power of Buyers
- 4.9.3 Threat of New Entrants
- 4.9.4 Threat of Substitutes
- 4.9.5 Intensity of Competitive Rivalry
5 Market Size & Growth Forecasts
- 5.1 By Product Type
- 5.1.1 Lithium Cobalt Oxide (LCO)
- 5.1.2 Lithium Iron Phosphate (LFP)
- 5.1.3 Lithium Nickel Manganese Cobalt (NMC)
- 5.1.4 Lithium Nickel Cobalt Aluminium (NCA)
- 5.1.5 Lithium Manganese Oxide (LMO)
- 5.1.6 Lithium Titanate (LTO)
- 5.2 By Form Factor
- 5.2.1 Cylindrical
- 5.2.2 Prismatic
- 5.2.3 Pouch
- 5.3 By Power Capacity
- 5.3.1 0 to 3,000 mAh
- 5.3.2 3,001 to 10,000 mAh
- 5.3.3 10,001 to 60,000 mAh
- 5.3.4 Above 60,000 mAh
- 5.4 By End-use Industry
- 5.4.1 Automotive (EV, HEV, PHEV)
- 5.4.2 Consumer Electronics
- 5.4.3 Industrial and Power Tools
- 5.4.4 Stationary Energy Storage
- 5.4.5 Aerospace and Defense
- 5.4.6 Marine
- 5.5 By Geography
- 5.5.1 North America
- 5.5.1.1 United States
- 5.5.1.2 Canada
- 5.5.1.3 Mexico
- 5.5.2 Europe
- 5.5.2.1 United Kingdom
- 5.5.2.2 Germany
- 5.5.2.3 France
- 5.5.2.4 Spain
- 5.5.2.5 Nordic Countries
- 5.5.2.6 Russia
- 5.5.2.7 Rest of Europe
- 5.5.3 Asia-Pacific
- 5.5.3.1 China
- 5.5.3.2 India
- 5.5.3.3 Japan
- 5.5.3.4 South Korea
- 5.5.3.5 Malaysia
- 5.5.3.6 Thailand
- 5.5.3.7 Indonesia
- 5.5.3.8 Vietnam
- 5.5.3.9 Australia
- 5.5.3.10 Rest of Asia-Pacific
- 5.5.4 South America
- 5.5.4.1 Brazil
- 5.5.4.2 Argentina
- 5.5.4.3 Colombia
- 5.5.4.4 Rest of South America
- 5.5.5 Middle East and Africa
- 5.5.5.1 United Arab Emirates
- 5.5.5.2 Saudi Arabia
- 5.5.5.3 South Africa
- 5.5.5.4 Egypt
- 5.5.5.5 Rest of Middle East and Africa
- 5.5.1 North America
6 Competitive Landscape
- 6.1 Market Concentration
- 6.2 Strategic Moves (M&A, Partnerships, PPAs)
- 6.3 Market Share Analysis (Market Rank/Share for key companies)
- 6.4 Company Profiles (includes Global level Overview, Market level overview, Core Segments, Financials as available, Strategic Information, Products & Services, and Recent Developments)
- 6.4.1 Contemporary Amperex Technology Co., Ltd. (CATL)
- 6.4.2 BYD Company Limited
- 6.4.3 LG Energy Solution Ltd.
- 6.4.4 Panasonic Holdings Corp.
- 6.4.5 Samsung SDI Co., Ltd.
- 6.4.6 SK On Co., Ltd.
- 6.4.7 AESC (Envision AESC Group)
- 6.4.8 CALB Co., Ltd.
- 6.4.9 Gotion High-Tech Co., Ltd.
- 6.4.10 EVE Energy Co., Ltd.
- 6.4.11 Farasis Energy Inc.
- 6.4.12 Sunwoda Electronic Co., Ltd.
- 6.4.13 Murata Manufacturing Co., Ltd.
- 6.4.14 VARTA AG
- 6.4.15 Toshiba Corporation
- 6.4.16 Saft Groupe SAS
- 6.4.17 Northvolt AB
- 6.4.18 Microvast Holdings, Inc.
- 6.4.19 A123 Systems LLC
- 6.4.20 Hitachi Energy Ltd.
- 6.4.21 Lithium Werks BV
- 6.4.22 Tesla Inc. (Battery Division)
7 Market Opportunities & Future Outlook
- 7.1 White-space & Unmet-Need Assessment
 鋰離子電池市場:依化學成分、電壓範圍、外形規格及應用分類-2026-2032年全球市場預測
 2026-2030年全球鋰離子電池市場圓柱形全極耳電池製造設備市場:按設備類型、電池類型、製造階段、產能、技術類型、最終用途分類,全球預測(2026-2032年)
 鋰離子電池市場規模、佔有率、趨勢和預測:按產品類型、功率容量、應用和地區分類,2026-2034年
 鋰離子電池市場分析及預測(至2035年):類型、產品類型、應用、技術、組件、材料類型、最終用戶、功能、安裝類型、解決方案
 2026-2034年全球鋰離子電池市場規模、佔有率、趨勢和成長分析報告全球工業鋰離子電池市場規模、佔有率、趨勢和成長分析報告(2026-2034)日本鋰離子電池市場報告:按產品類型、功率容量、應用和地區分類(2026-2034年)鋰離子電池用LMFP專利趨勢分析(2026年)
 2026年全球可充電聚鋰離子電池市場報告