


 |
市場調查報告書
商品編碼
1851585
威脅情報保全服務:市場佔有率分析、產業趨勢、統計數據和成長預測(2025-2030 年)Threat Intelligence Security Services - Market Share Analysis, Industry Trends & Statistics, Growth Forecasts (2025 - 2030) |
||||||
※ 本網頁內容可能與最新版本有所差異。詳細情況請與我們聯繫。
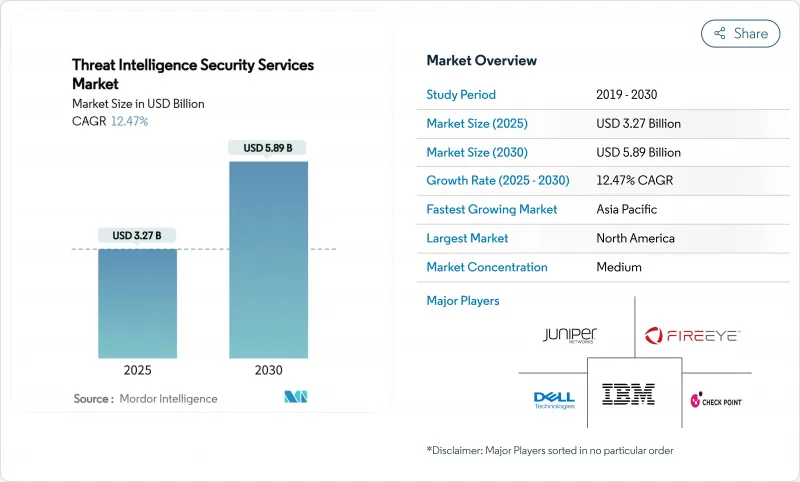
預計到 2025 年,威脅情報保全服務市場規模將達到 32.7 億美元,到 2030 年將達到 58.9 億美元,在此期間的複合年成長率為 12.47%。
市場擴張反映了安全策略從被動的邊界防禦轉向持續威脅搜尋、風險暴露管理和預測分析的重大轉變。主導宣傳活動的加劇、雲端安全事件激增65%以及主要司法管轄區強制執行的資料外洩通知,都在推動對即時、情境化威脅資料的需求。平台融合(以零信任和擴展檢測與回應 (XDR) 的部署為代表)進一步加速了相關投資,因為安全團隊正在尋求整合的可見性和自動化回應。同時,應用程式介面 (API) 攻擊面的指數級成長以及由生成式人工智慧 (AI) 代碼助理帶來的內部風險,迫使企業重新評估其風險態勢,從而推動了蓬勃發展的威脅情報保全服務市場。
全球威脅情報保全服務市場趨勢與洞察
國家支持的高級威脅防護(APT)宣傳活動的迅速擴張
像Volt Typhoon和Salt Typhoon這樣的國家級組織正加強對關鍵基礎設施的攻擊力度,這促使各機構優先考慮戰術性情報和事件前歸因能力。網路安全與基礎設施安全局(CISA)在2024年發布了3,368份勒索軟體預警通知,證實了複雜入侵嘗試的數量之多。如今的攻擊不再局限於間諜活動,還包括破壞性的預先部署,因此需要持續監控和專門的威脅搜尋。伊朗攻擊者同時將目標對準醫療保健和金融服務業,這使得威脅情報成為各行業的戰略要務。這些趨勢正在加速對託管偵測、增強型惡意軟體分析和情境歸因服務的投資。
雲端工作負載激增,API攻擊也隨之浮現。
向雲端遷移擴大了攻擊面,企業在多重雲端環境中運行數千個 API。 API 中斷是 2024 年報告的大多數雲端安全漏洞的罪魁禍首,暴露出東西向流量的可見性不足。傳統的網路監控缺乏對短暫工作負載的上下文訊息,這加速了雲端原生威脅情報的普及,後者能夠即時映射依賴關係。微服務架構進一步增加了資產清單的複雜性,使得企業更加依賴自動化發現和持續風險評分。因此,針對無伺服器和容器環境客製化的雲端交付分析引擎和風險管理模組的需求持續成長。
一級威脅獵人和分析師短缺
對深度取證和惡意軟體逆向工程的需求遠遠超過了供給。掌握國家級對手的策略需要多年的訓練,然而安全團隊卻面臨人員削減和薪資上漲的雙重困境。這種缺口正在推動行業整合,因為小型供應商難以招攬專家,而客戶則尋求託管式檢測和回應的承包服務。如今,服務提供者需要實現日常故障排查的自動化,並將稀缺的專業知識解放出來,用於更高價值的任務,這導致人們對人工智慧輔助分析模組的興趣日益濃厚。
細分市場分析
雲端部署目前已佔據威脅情報保全服務市場58%的佔有率。預計到2030年,該細分市場將以18.20%的複合年成長率成長,從而提升雲端原生分析引擎的重要性。彈性運算分散式儲存使服務供應商無需客戶側硬體即可處理PB級遙測Petabyte,這對於到2030年威脅情報安全服務市場規模達到58.9億美元至關重要。雖然在需要本地資料處理的主權雲端和國防環境中,本地部署仍然存在,但目前的開發藍圖優先考慮混合連接器而非獨立設備。
混合部署模式在受監管企業中日益普及,這些企業利用雲端技術擴展規模,但出於合規性考慮,仍將某些資料集保留在國內。由於傳統感測器缺乏容器流量的上下文訊息,以 API 為中心的攻擊向量在雲端環境中尤其容易受到攻擊。 Palo Alto Networks 報告稱,其與人工智慧相關的年度經常性收入超過 2 億美元,年增 4 倍,這表明市場對雲端交付的機器學習模組有著強勁的需求。因此,儘管雲端優勢已成定局,但供應商必須解決延遲、加密和本地化等問題,才能加速雲端技術的進一步普及。
預計到2024年,託管式偵測與回應(MDR)將佔據威脅情報保全服務市場56%的佔有率,年成長率預計為18.55%。企業青睞MDR,因為它融合了技術、遠端檢測和專家經驗,能夠在不增加員工負擔的情況下縮短平均偵測時間。 MDR業務的快速成長表明,威脅情報保全服務市場正致力於以結果為導向的交付。專業服務對於成熟度評估、框架設計和持續威脅暴露管理部署仍然至關重要。
訂閱資訊流雖然已形成商品化基礎,但正逐漸演變為包含攻擊者畫像和風險評分等豐富上下文資訊的軟體包。 Fortinet累計,其 2025 年第一季安全營運年度經常性收入 (ARR) 為 4.345 億美元,年成長 30.3%,這表明整合式託管偵測與編配(MDR) 和編排功能正在蓬勃發展。在工具整合日益加劇的背景下,那些將精心策劃的遙測數據與自動化隔離工作流程相結合的供應商正在建立具有競爭力的差異化優勢。
威脅情報保全服務市場按部署類型(雲端、本地部署)、服務類型(託管偵測與回應、專業/諮詢服務、其他)、組織規模(大型企業、中小企業)、最終用戶產業(銀行和金融服務、醫療保健、其他)以及地區進行細分。市場預測以美元計價。
區域分析
北美地區佔全球收入的38%,這得益於美國2025年275億美元的網路安全預算。該預算包括向美國網路安全和基礎設施安全局(CISA)提供的30億美元津貼,用於擴展資訊共用網路。零信任的高普及率、活躍的資金籌措以及雲端原生供應商生態系統,都鞏固了該地區的領先地位。聯邦行政命令14028號強制政府機構將威脅情報整合到安全運作中,相關產業也正在效法供應鏈保障模式。加拿大正在與美國的資訊揭露標準接軌,墨西哥金融監管機構正在將事件報告範圍擴大到金融科技領域,增加了新的需求來源。
亞太地區預計將以18.90%的複合年成長率快速成長,成為全球成長最快的地區。隨著政府專案加強國內安全管理,中國網路安全市場預計在2029年達到236.6億美元。日本的戰略文件呼籲將國內網路安全收入提高三倍,並將國家預算增加50%,這將推動對產業級威脅情報的需求。印度正在快速數位化,CERT-IN(印度電腦緊急應變小組)強制要求即時報告特定事件,並鼓勵採用相關服務。澳洲斥資5.86億澳元的網路彈性計畫正在推動對託管情報的需求,區域電訊也正在投資遠端檢測交換。
在NIS2指令和區域資料保護法規的推動下,歐洲保持穩定成長。德國預計到2025年將在網路安全方面投入超過100億歐元,以保護工業自動化系統免受破壞。英國累計6億英鎊,並計劃在2035年將GDP的5%用於國家安全,這將為供應商提供更清晰的長期發展前景。資料主權要求將促進區域安全營運中心的發展,這些中心能夠在國家邊界內處理遙測數據,這將使擁有居住感知雲端架構和多語言分析師支援的供應商受益。
其他福利:
- Excel格式的市場預測(ME)表
- 3個月的分析師支持
目錄
第1章 引言
- 研究假設和市場定義
- 調查範圍
第2章調查方法
第3章執行摘要
第4章 市場情勢
- 市場概覽
- 市場促進因素
- 國家主導的APT宣傳活動激增
- 雲端工作負載的激增與 API 攻擊面
- CISO平台零信任與XDR
- 強制違規通知法(美國、歐盟、亞太地區)
- 利用 GEN-AI 代碼助手降低內部風險
- 採用 CTEM* 進行連續控制驗證
- 市場限制
- 一級威脅獵人和分析師短缺
- 中小企業預算壓縮
- 跨境遠端檢測共用面臨的資料主權障礙
- 虛假TI訊息流導致的警報疲勞
- 價值/供應鏈分析
- 監管環境
- 技術展望
- 波特五力分析
- 新進入者的威脅
- 買方的議價能力
- 供應商的議價能力
- 替代品的威脅
- 競爭的激烈程度
第5章 市場規模與成長預測
- 透過部署模式
- 雲
- 本地部署
- 按服務類型
- 託管偵測與回應
- 專業/諮詢
- 訂閱資料饋送
- 按組織規模
- 主要企業
- 小型企業
- 按最終用戶行業分類
- 銀行和金融服務
- 衛生保健
- 資訊科技和電訊
- 零售與電子商務
- 生命科學/製藥
- 政府和國防部
- 按地區
- 北美洲
- 美國
- 加拿大
- 墨西哥
- 歐洲
- 英國
- 德國
- 法國
- 義大利
- 其他歐洲地區
- 亞太地區
- 中國
- 日本
- 印度
- 韓國
- 亞太其他地區
- 中東
- 以色列
- 沙烏地阿拉伯
- 阿拉伯聯合大公國
- 土耳其
- 其他中東地區
- 非洲
- 南非
- 埃及
- 其他非洲地區
- 南美洲
- 巴西
- 阿根廷
- 其他南美洲
- 北美洲
第6章 競爭情勢
- 市場集中度
- 策略趨勢
- 市佔率分析
- 公司簡介
- Google LLC(Mandiant)
- Recorded Future Inc.
- CrowdStrike Holdings Inc.
- Fortinet Inc.
- Cisco Systems Inc.
- International Business Machines Corporation
- Palo Alto Networks Inc.
- Dell Technologies Inc.
- Check Point Software Technologies Ltd.
- Trellix LLC(McAfee Enterprise)
- Broadcom Inc.(Symantec)
- LogRhythm Inc.
- Juniper Networks Inc.
- F-Secure Corporation
- LookingGlass Cyber Solutions Inc.
- Rapid7 Inc.
- Arctic Wolf Networks Inc.
- Trend Micro Incorporated
- Elastic NV(Security)
- Kaspersky Lab JSC
第7章 市場機會與未來展望
The threat intelligence security services market size stands at USD 3.27 billion in 2025 and is forecast to reach USD 5.89 billion by 2030, advancing at a 12.47% CAGR over the period.
The expansion reflects a decisive shift from reactive perimeter defense toward continuous threat hunting, exposure management, and predictive analytics. Escalating state-sponsored campaigns, a 65% rise in cloud security incidents, and mandatory breach-notification laws across major jurisdictions are amplifying demand for real-time, contextual threat data. Platform convergence, led by zero-trust and Extended Detection and Response (XDR) rollouts, is further accelerating investment as security teams seek unified visibility and automated response. At the same time, the proliferation of application programming interface attack surfaces and insider risks arising from generative AI code assistants have prompted organizations to reassess risk postures, energizing the threat intelligence security services market.
Global Threat Intelligence Security Services Market Trends and Insights
Rapid Escalation in State-Sponsored APT Campaigns
Nation-state groups such as Volt Typhoon and Salt Typhoon have intensified operations against critical infrastructure, prompting organizations to prioritize tactical intelligence and pre-incident attribution capabilities. The Cybersecurity and Infrastructure Security Agency issued 3,368 pre-ransomware notifications in 2024, underscoring the volume of advanced intrusion attempts. Attacks now go beyond espionage to include destructive pre-positioning, which demands continuous monitoring and specialized hunting. Iranian actors are simultaneously targeting healthcare and financial services, turning threat intelligence into a strategic imperative across sectors. These developments have accelerated spending on managed detection, enriched malware analysis, and contextual attribution services.
Proliferation of Cloud Workloads & API Attack-Surface
Cloud migration has multiplied attack entry points, with organizations operating thousands of APIs across multi-cloud settings. API failures contributed to a majority of cloud breaches reported in 2024, revealing visibility gaps in east-west traffic. Traditional network monitoring lacks context for ephemeral workloads, fuelling adoption of cloud-native threat intelligence that can map dependencies in real time. Microservices architectures further complicate asset inventories, increasing reliance on automated discovery and continuous risk scoring. The outcome is sustained momentum for cloud-delivered analytics engines and exposure management modules tailored to serverless and container environments.
Shortage of Tier-1 Threat-Hunters & Analysts
Demand for deep forensics and malware reverse-engineering outpaces supply. Years of training are needed to master nation-state adversary tactics, yet security teams face attrition and wage inflation. The gap is driving consolidation as smaller vendors struggle to retain experts, and clients turn to Managed Detection and Response for turnkey coverage. Providers must now automate routine triage to free scarce specialists for higher-value pursuits, heightening interest in AI-assisted analysis modules.
Other drivers and restraints analyzed in the detailed report include:
- Zero-Trust & XDR Platformisation by CISOs
- Mandatory Breach-Notification Laws
- Budget Compression in SME Segment
For complete list of drivers and restraints, kindly check the Table Of Contents.
Segment Analysis
Cloud deployment already commands 58% of the threat intelligence security services market share. The segment is projected to expand at an 18.20% CAGR through 2030, reinforcing the centrality of cloud-native analytics engines. Elastic compute and distributed storage enable providers to process petabytes of telemetry without customer-side hardware, which is critical as threat intelligence security services market size grows to USD 5.89 billion in 2030. On-premises deployments persist in sovereign cloud and defense contexts that require local data processing, although development roadmaps now prioritize hybrid connectors rather than standalone appliances.
Hybrid adoption is rising among regulated firms that embrace the cloud for scale yet retain select data sets in country for compliance. API-centric attack vectors accentuate cloud resonance since traditional sensors lack context for container traffic. Palo Alto Networks reported AI-centric Annual Recurring Revenue above USD 200 million with 4x year-over-year growth, validating appetite for cloud-delivered machine learning modules. Cloud superiority is therefore entrenched, but vendors must address latency, encryption, and locality factors to accelerate further penetration.
Managed Detection and Response own 56% of the threat intelligence security services market share as of 2024 and are forecast to grow 18.55% annually. Enterprises favour MDR because it fuses technology, telemetry, and human expertise, reducing mean time to detect without staffing burdens. The surge in MDR contracts underlines how the threat intelligence security services market pivots toward outcome-based delivery. Professional services remain vital for maturity assessments, framework design, and Continuous Threat Exposure Management rollouts.
Subscription feeds form a commodity base but are evolving toward context-rich packages with actor profiling and risk scoring. Fortinet posted Security Operations ARR of USD 434.5 million in Q1 2025, up 30.3% year on year, signalling that integrated MDR plus orchestration gains momentum. Vendors blending curated telemetry with automated containment workflows are building defensible differentiation as tool consolidation continues.
Threat Intelligence Security Services Market Segmented by Deployment Mode (Cloud, On-Premises), Service Type (Managed Detection & Response, Professional/Consulting and More), Organization Size (Large Enterprises, Small & Medium Enterprises), End-User Industry (Banking & Financial Services, Healthcare and More), and Geography. The Market Forecasts are Provided in Terms of Value (USD).
Geography Analysis
North America controls 38% of global revenue, supported by the United States' USD 27.5 billion cybersecurity allocation for 2025, which includes USD 3 billion for CISA grants that expand intelligence sharing networks. High adoption of zero-trust, robust venture funding, and an ecosystem of cloud-native vendors sustain regional leadership. Federal Executive Order 14028 compels government agencies to integrate threat intelligence into security operations, and adjacent industries replicate the model for supply-chain assurance. Canada is harmonizing with U.S. disclosure norms, while Mexico's financial regulator extends incident reporting to fintech, adding new demand vectors.
Asia-Pacific is projected to grow at an 18.90% CAGR, the fastest worldwide. China's cybersecurity market is on track to reach USD 23.66 billion by 2029 as government programs enforce in-country security controls. Japan's strategic documents call for tripling domestic cybersecurity sales and boosting national budgets by 50%, which elevates appetite for industry-grade threat intelligence. India continues rapid digitization; its CERT-IN directives oblige real-time reporting for specified incidents, driving service uptake. Australia's AUD 586 million cyber resilience package underpins managed intelligence demand, and regional telecom providers are investing in cross-border telemetry exchanges.
Europe maintains steady growth propelled by the NIS2 directive and local data protection mandates. Germany expects cybersecurity spending beyond €10 billion in 2025 to shield industrial automation from sabotage. The United Kingdom earmarked an extra £600 million for intelligence agencies and plans to devote 5% of GDP to national security by 2035 reinforce long-term visibility for vendors. Data-sovereignty requirements stimulate growth of regional security operations centers capable of processing telemetry within national borders. Providers offering residency-aware cloud fabrics and multilingual analyst support are therefore preferred.
- Google LLC (Mandiant)
- Recorded Future Inc.
- CrowdStrike Holdings Inc.
- Fortinet Inc.
- Cisco Systems Inc.
- International Business Machines Corporation
- Palo Alto Networks Inc.
- Dell Technologies Inc.
- Check Point Software Technologies Ltd.
- Trellix LLC (McAfee Enterprise)
- Broadcom Inc. (Symantec)
- LogRhythm Inc.
- Juniper Networks Inc.
- F-Secure Corporation
- LookingGlass Cyber Solutions Inc.
- Rapid7 Inc.
- Arctic Wolf Networks Inc.
- Trend Micro Incorporated
- Elastic N.V. (Security)
- Kaspersky Lab JSC
Additional Benefits:
- The market estimate (ME) sheet in Excel format
- 3 months of analyst support
TABLE OF CONTENTS
1 INTRODUCTION
- 1.1 Study Assumptions and Market Definition
- 1.2 Scope of the Study
2 RESEARCH METHODOLOGY
3 EXECUTIVE SUMMARY
4 MARKET LANDSCAPE
- 4.1 Market Overview
- 4.2 Market Drivers
- 4.2.1 Rapid escalation in state-sponsored APT campaigns
- 4.2.2 Proliferation of cloud workloads and API attack-surface
- 4.2.3 Zero-trust and XDR platformisation by CISOs
- 4.2.4 Mandatory breach-notification laws (US, EU, APAC)
- 4.2.5 Insider-risk from Gen-AI code-assistants (under-radar)
- 4.2.6 Adoption of CTEM* for continuous controls validation (under-radar)
- 4.3 Market Restraints
- 4.3.1 Shortage of Tier-1 threat-hunters and analysts
- 4.3.2 Budget compression in SME segment
- 4.3.3 Data-sovereignty barriers to cross-border telemetry sharing (under-radar)
- 4.3.4 Adversary abuse of spoofed TI feeds causing alert fatigue (under-radar)
- 4.4 Value / Supply-Chain Analysis
- 4.5 Regulatory Landscape
- 4.6 Technological Outlook
- 4.7 Porter's Five Forces Analysis
- 4.7.1 Threat of New Entrants
- 4.7.2 Bargaining Power of Buyers
- 4.7.3 Bargaining Power of Suppliers
- 4.7.4 Threat of Substitutes
- 4.7.5 Intensity of Rivalry
5 MARKET SIZE AND GROWTH FORECASTS (VALUE)
- 5.1 By Deployment Mode
- 5.1.1 Cloud
- 5.1.2 On-premise
- 5.2 By Service Type
- 5.2.1 Managed Detection and Response
- 5.2.2 Professional / Consulting
- 5.2.3 Subscription Data-feeds
- 5.3 By Organization Size
- 5.3.1 Large Enterprises
- 5.3.2 Small and Medium Enterprises
- 5.4 By End-user Industry
- 5.4.1 Banking and Financial Services
- 5.4.2 Healthcare
- 5.4.3 IT and Telecom
- 5.4.4 Retail and e-Commerce
- 5.4.5 Life Sciences / Pharma
- 5.4.6 Government and Defense
- 5.5 By Geography
- 5.5.1 North America
- 5.5.1.1 United States
- 5.5.1.2 Canada
- 5.5.1.3 Mexico
- 5.5.2 Europe
- 5.5.2.1 United Kingdom
- 5.5.2.2 Germany
- 5.5.2.3 France
- 5.5.2.4 Italy
- 5.5.2.5 Rest of Europe
- 5.5.3 Asia-Pacific
- 5.5.3.1 China
- 5.5.3.2 Japan
- 5.5.3.3 India
- 5.5.3.4 South Korea
- 5.5.3.5 Rest of Asia-Pacific
- 5.5.4 Middle East
- 5.5.4.1 Israel
- 5.5.4.2 Saudi Arabia
- 5.5.4.3 United Arab Emirates
- 5.5.4.4 Turkey
- 5.5.4.5 Rest of Middle East
- 5.5.5 Africa
- 5.5.5.1 South Africa
- 5.5.5.2 Egypt
- 5.5.5.3 Rest of Africa
- 5.5.6 South America
- 5.5.6.1 Brazil
- 5.5.6.2 Argentina
- 5.5.6.3 Rest of South America
- 5.5.1 North America
6 COMPETITIVE LANDSCAPE
- 6.1 Market Concentration
- 6.2 Strategic Moves
- 6.3 Market Share Analysis
- 6.4 Company Profiles (includes Global level Overview, Market level overview, Core Segments, Financials as available, Strategic Information, Market Rank/Share for key companies, Products and Services, and Recent Developments)
- 6.4.1 Google LLC (Mandiant)
- 6.4.2 Recorded Future Inc.
- 6.4.3 CrowdStrike Holdings Inc.
- 6.4.4 Fortinet Inc.
- 6.4.5 Cisco Systems Inc.
- 6.4.6 International Business Machines Corporation
- 6.4.7 Palo Alto Networks Inc.
- 6.4.8 Dell Technologies Inc.
- 6.4.9 Check Point Software Technologies Ltd.
- 6.4.10 Trellix LLC (McAfee Enterprise)
- 6.4.11 Broadcom Inc. (Symantec)
- 6.4.12 LogRhythm Inc.
- 6.4.13 Juniper Networks Inc.
- 6.4.14 F-Secure Corporation
- 6.4.15 LookingGlass Cyber Solutions Inc.
- 6.4.16 Rapid7 Inc.
- 6.4.17 Arctic Wolf Networks Inc.
- 6.4.18 Trend Micro Incorporated
- 6.4.19 Elastic N.V. (Security)
- 6.4.20 Kaspersky Lab JSC
7 MARKET OPPORTUNITIES AND FUTURE OUTLOOK
- 7.1 White-space and Unmet-need Assessment
 2026年全球網路威脅情報市場報告
 網路威脅情報訂閱市場分析及預測(至 2035 年):按類型、產品類型、服務、技術、組件、應用、部署模式、最終用戶和解決方案分類
 內部威脅防護市場 - 全球產業規模、佔有率、趨勢、機會及預測(按解決方案、部署方式、公司規模、產業垂直領域、地區和競爭格局分類,2021-2031 年)威脅狩獵市場 - 全球產業規模、佔有率、趨勢、機會及預測(按組件、部署模式、組織規模、產業垂直領域、威脅類型、地區和競爭格局分類,2021-2031 年)
 按服務類型、部署模式、組織規模和行業分類的託管威脅狩獵服務市場 - 全球預測,2026-2032 年
 網路威脅情報市場預測至2032年:按情報類型、組件、部署模式、應用、最終用戶和地區分類的全球分析
 全球威脅搜尋市場
 2025-2029年全球網路威脅情報市場
 網路威脅情報市場(按類型和地區)全球內部威脅預防市場