


 |
市場調查報告書
商品編碼
1851538
活性碳:市場佔有率分析、行業趨勢、統計數據和成長預測(2025-2030 年)Activated Carbon - Market Share Analysis, Industry Trends & Statistics, Growth Forecasts (2025 - 2030) |
||||||
※ 本網頁內容可能與最新版本有所差異。詳細情況請與我們聯繫。
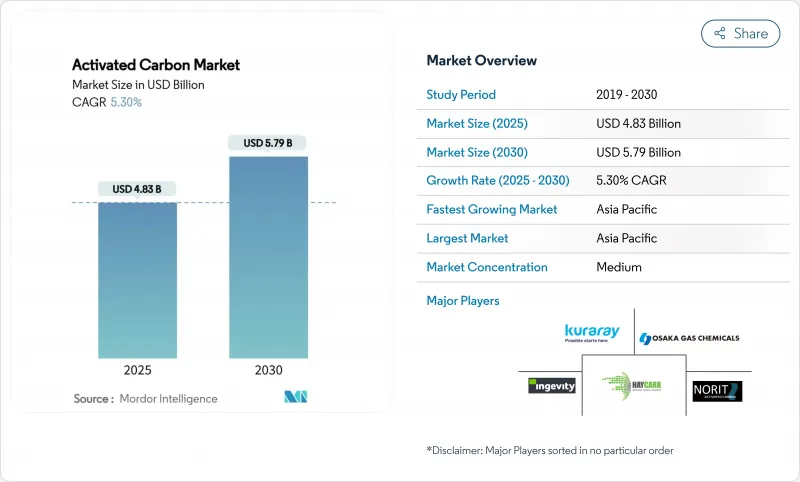
活性碳市場規模預計到 2025 年將達到 48.3 億美元,預計到 2030 年將達到 57.9 億美元,在預測期(2025-2030 年)內複合年成長率為 5.30%。
嚴格的水質法規、亞太地區的快速工業化以及製藥、採礦和先進空氣過濾製程對特種活性碳日益成長的需求,正在推動市場成長。棕櫚殼仍然是高性能活性碳的優質原料,但供應緊張和煤炭價格波動促使企業進行垂直整合,並尋求替代原料。特別是,美國環保署 (EPA) 2024 年發布的 PFAS 飲用水標準將顆粒活性碳 (GAC) 指定為最佳可用技術。同時,粉末狀活性碳 (PAC) 對於減少燃煤電廠的汞排放至關重要,而木質活性碳則因永續生產方面的突破而吸引投資。能夠確保原料供應穩定、投資於重新運作能力並提供數位監測服務的製造商,將更有利於贏得未來的合約。
全球活性碳市場趨勢與洞察
飲用水中 PFAS法令遵循
美國環保署 (EPA) 於 2024 年 4 月發布的《國家飲用水主要法規》對六種 PFAS 化合物設定了限值,正式將顆粒活性碳 (GAC) 列為最佳可用技術,並強制要求美國所有公共供水系統從 2027 年開始監測,並在 2029 年前全面達標。該法規要求 PFOA 和 PFOS 的去除效率超過 99%,預計這將為活性碳系統創造 15.5 億美元的年市場價值。歐洲的公用事業公司為了應對 PFAS 和微量污染物閾值的收緊,已開始效仿這些規範,這為美國和日本的供應商創造了出口機會。系統維修通常會採用 GAC 濾料、不銹鋼接觸器以及包含多年固定更換量的現場重新運作服務合約。擁有快速重新運作窯和數位化床層壽命分析技術的供應商在競標評估中可以獲得競爭優勢。
防止燃煤電廠造成空氣污染
目前,北美超過135座電廠(總裝置容量超過55吉瓦)採用粉末活性碳噴射系統,汞捕集率可達90%或更高。美國環保署(EPA)將於2024年5月進行技術審查,屆時將進一步收緊汞和顆粒物排放限值,使粉末活性碳噴射系統成為不願投資濕式洗滌器升級改造的業主成本最低的維修。中國監管機構也正在調整排放法規,加速小型鍋爐吸附式解決方案的推廣。適用於高噴射溫度和嚴格失火閾值的粉末配方供不應求,使得美國產椰殼粉末活性碳(抗孔隙堵塞)價格居高不下。
椰殼原料供應中斷
熱帶國家供應全球80%以上的椰殼炭,但菲律賓受颶風影響導致的收成損失將使原料供應在2024年之前持續減少。像Carbon Activated Corporation這樣的生產商正在加速垂直整合,在斯里蘭卡開設第二家炭廠,同時與中國一家椰殼炭出口商簽署了溢流供應協議。雖然硬木片和棕櫚仁殼也被考慮作為緊急方案,但這些替代品通常孔隙分佈較寬,會降低其去除PFAS和貴金屬離子的效率。
細分市場分析
預計到2024年,棕櫚殼產品將佔活性碳市場36.5%的佔有率,這反映了其優異的孔隙分佈,有利於PFAS的吸附和金的負載。其超過99%的硬度可最大限度地減少反沖洗過程中的碎片化,從而延長市政過濾器的床層壽命。然而,亞太地區工廠的擴張導致椰殼炭的競爭異常激烈,而2024年不利的天氣狀況也凸顯了單一來源供應的脆弱性。
受永續森林認證體系和高碘值熱解製程的推動,煤基材料市場正以5.8%的複合年成長率成長。在孔隙率要求不高的煙氣和溶劑回收應用中,煤基材料仍具有成本效益。儘管前景可觀,但目前關於污泥和鋸末衍生炭的學術研究仍處於中試階段,而主流生產商仍依賴傳統原料。
預計到2024年,顆粒狀活性碳產品將佔據50%的市場佔有率,並在2030年之前以6.33%的最高複合年成長率成長,這主要得益於其重新運作能力和在填充床中穩定的壓降性能。擠壓/造粒活性碳適用於對低壓降和高抗壓強度要求極高的應用,例如溶劑蒸氣吸附、壓縮空氣乾燥和汽車碳罐。創新的氣相顆粒活性碳裝置整合了變溫吸附技術,該技術利用電暖器對床層進行原位再生。
粉狀活性碳雖然可重複使用性較差,但在需要快速釋放、高比表面積產品的市場中,例如可在數小時內處理渾濁水源的救災水包,其市場佔有率正在不斷成長。顆粒狀活性碳目前正轉向沼氣淨化領域,歐洲的垃圾掩埋沼氣處理商正在採購添加了硫浸漬添加劑的顆粒,用於去除硫化氫。從長遠來看,環境處置法規和碳足跡核算可能會進一步推動可再生顆粒活性碳系統的經濟效益,從而顯著促進活性碳市場的成長。
區域分析
亞太地區處於活性碳市場擴張的前沿,2024年佔據全球63%的收入佔有率,預計到2030年將以6.11%的複合年成長率成長。中國透過垂直整合的工廠支援區域生產,這些工廠將棕櫚殼、煤炭和鋸末轉化為各種活性炭,供應國內自來水公司和出口市場。印度的「飲用水生命線計畫」(Jal Jeevan Mission)旨在實現農村地區的全民用水,該計畫已發布競標文件,指定使用顆粒活性碳(GAC)過濾器去除水中的砷和氟化物。
北美市場受益於監管的確定性和較高的人均消費量。光是2024年美國環保署(EPA)的PFAS法規一項,就可能在本十年末將活性碳(GAC)的需求增加一倍。歐洲市場規模較小,但技術較為先進。劍橋大學的研究開發出一種帶電活性碳海綿,能夠以低能耗直接吸收空氣中的二氧化碳,預示著未來該技術可望拓展至氣候減緩領域。
南美洲和中東正迅速採用碳材料進行採礦和天然氣加工,智利金礦商指定椰殼碳用於其 CIL 迴路,卡達液化天然氣生產商採用顆粒狀碳來滿足低溫分離前嚴格的汞污染限制。
其他福利:
- Excel格式的市場預測(ME)表
- 3個月的分析師支持
目錄
第1章 引言
- 研究假設和市場定義
- 調查範圍
第2章調查方法
第3章執行摘要
第4章 市場情勢
- 市場概覽
- 市場促進因素
- 符合美國水處理應用的嚴格環境法規
- 更重視空氣污染防治(特別是汞去除)
- 對水質淨化的需求不斷成長
- 黃金開採和金屬回收
- 農業和農藥需求量大
- 市場限制
- 棕櫚殼供應鏈中斷
- 煅燒煤價格上漲擠壓了煤基PAC生產商的淨利率
- 運作工廠的高資本密集度限制了循環經營模式。
- 價值鏈分析
- 波特五力模型
- 供應商的議價能力
- 買方的議價能力
- 新進入者的威脅
- 替代品的威脅
- 競爭程度
第5章 市場規模與成長預測
- 按原料
- 煤基
- 椰殼
- 低音提琴
- 其他原料(泥炭、褐煤等)
- 按形式
- 粉末活性碳(PAC)
- 顆粒活性碳(GAC)
- 擠壓/造粒活性碳(EAC)
- 透過使用
- 漂白處理
- 糖的生產
- 濃縮治療
- 溶劑回收
- PFAS吸附處理
- 飲用水處理
- 其他用途
- 按最終用戶行業分類
- 水處理
- 工業加工
- 衛生保健
- 飲食
- 車
- 其他終端用戶產業
- 按地區
- 亞太地區
- 中國
- 印度
- 日本
- 韓國
- 亞太其他地區
- 北美洲
- 美國
- 加拿大
- 墨西哥
- 歐洲
- 德國
- 英國
- 法國
- 義大利
- 西班牙
- 其他歐洲地區
- 南美洲
- 巴西
- 阿根廷
- 南美洲其他地區
- 中東和非洲
- 沙烏地阿拉伯
- 南非
- 其他中東和非洲地區
- 亞太地區
第6章 競爭情勢
- 市場集中度
- 策略趨勢
- 市佔率分析
- 公司簡介
- Albemarle Corporation
- Arq, Inc.
- Carbon Activated Corporation
- CarboTech
- CPL
- Donau Carbon GmbH
- HAYCARB PLC
- Ingevity
- KALPAKA CHEMICALS
- KURARAY CO., LTD.
- MICBAC INDIA
- Nanping Yuanli Active Carbon Company
- Norit
- Osaka Gas Chemicals Co., Ltd
- Rotocarb
- Silcarbon Aktivkohle GmbH
- Suneeta Carbons
第7章 市場機會與未來展望
The Activated Carbon Market size is estimated at USD 4.83 billion in 2025, and is expected to reach USD 5.79 billion by 2030, at a CAGR of 5.30% during the forecast period (2025-2030).
Stringent water-quality rules, rapid industrialization in Asia-Pacific, and rising demand for specialty grades in pharmaceutical, mining, and advanced air-filtration processes propel growth. Coconut-shell feedstock remains the premium raw material for high-performance grades, yet tightening supply and volatile coal prices are spurring vertical integration and exploration of alternative precursors. Regulatory momentum anchors long-term demand for granular products, most notably the U.S. EPA's 2024 PFAS drinking-water standard naming granular activated carbon (GAC) as Best Available Technology. Simultaneously, powdered activated carbon (PAC) is pivotal in mercury-emission control for coal-fired utilities, while wood-based carbons attract investment through sustainable production breakthroughs. Manufacturers able to secure raw-material certainty, invest in reactivation capacity, and bundle digital monitoring services are best positioned to capture upcoming contracts.
Global Activated Carbon Market Trends and Insights
PFAS-Compliance Regulations for Drinking Water
The U.S. EPA's April 2024 National Primary Drinking Water Regulation capped six PFAS compounds and formally lists GAC as Best Available Technology, compelling all U.S. public water systems to start monitoring in 2027 and fully comply by 2029. The mandate next brings a projected USD 1.55 billion annual market for activated carbon systems, supported by validated removal efficiencies surpassing 99% for PFOA and PFOS. European utilities preparing for tighter PFAS and micro-pollutant thresholds have begun replicating these specifications, creating an export window for U.S. and Japanese suppliers. System retrofits frequently integrate GAC media, stainless-steel contactors, and on-site reactivation service contracts, locking in multi-year replacement volumes. Suppliers with rapid-turnaround reactivation kilns and digital bed-life analytics gain competitive headroom during bid evaluations.
Air-Pollution Control for Coal-Fired Utilities
More than 135 North American plants, representing over 55 GW of capacity, currently deploy powdered-carbon injection systems that achieve more than 90% mercury capture. The EPA's May 2024 technology review further narrows allowable mercury and particulate limits, making PAC the lowest-cost retrofit for owners unwilling to invest in wet-scrubber upgrades. Chinese regulators are also reshaping flue-gas norms, accelerating adsorption-based solutions for smaller boilers. Powder formulations tailored for elevated injection temperatures and strict loss-on-ignition thresholds are in short supply, enabling premium pricing for U.S. coconut-shell PAC grades that resist pore blocking.
Feedstock Supply Disruption for Coconut Shells
Tropical nations supply more than 80% of global coconut-shell char, and harvest setbacks caused by cyclones in the Philippines cut feedstock availability during 2024. Producers such as Carbon Activated Corporation accelerated vertical integration, opening a second char plant in Sri Lanka while lining up overflow supply agreements with Chinese shell-char exporters. Contingency plans involve qualifying hardwood chips and palm-kernel shells, yet such alternatives often produce broader pore distributions that reduce removal efficiency for PFAS and precious-metal ions.
Other drivers and restraints analyzed in the detailed report include:
- Expanding Water-Purification Demand in Emerging Economies
- Gold Mining and Metal-Recovery Requirements
- Volatile Kiln-grade Coal Pricing
For complete list of drivers and restraints, kindly check the Table Of Contents.
Segment Analysis
Coconut-shell products captured 36.5% of the activated carbon market in 2024, reflecting superior micropore distributions that excel at PFAS adsorption and gold-loading tasks. Hardness values exceeding 99% minimize fragmentation during backwashing, extending bed life in municipal filters. Asia-Pacific mill expansions, however, compete fiercely for shell char, and 2024 weather disruptions spotlighted the vulnerability of single-source procurement.
Wood-based carbons are the fastest-advancing alternative, rising at a 5.8% CAGR on the back of certified sustainable forestry programs and pyrolysis improvements that yield high iodine numbers. Coal-based variants remain cost-effective for flue-gas and solvent-recovery duties where tight micropore volume is less critical. Although promising, academic work on sludge- and sawdust-derived carbons is still at pilot scale, leaving mainstream producers dependent on legacy precursors.
Granular products held a commanding 50% share in 2024 and are forecast to record the highest 6.33% CAGR through 2030, thanks to their reactivation capability and consistent head-loss performance in packed beds. Extruded/pelletized carbons address applications such as solvent vapor adsorption, compressed-air drying, and automotive canisters where low pressure drop and high crush strength are paramount. GAC design considerations focus on uniform particle size to reduce channeling, while innovative vapor-phase GAC units integrate temperature swing adsorption that regenerates beds in situ with electric heaters.
Powdered grades, although less reusable, capture share in markets requiring high surface-area products delivered rapidly, illustrated by disaster-relief water packs capable of treating turbid sources within hours. Pelletized offerings are now pivoting toward biogas purification, with European landfill-gas operators procuring pellets infused with sulfur-impregnated additives for hydrogen-sulfide removal. Long-term, environmental disposal rules and carbon-footprint accounting may tilt economics further toward regenerable GAC systems, strengthening their outsized contribution to activated carbon market growth.
The Activated Carbon Market Report Segments the Industry by Raw Material (Coal-Based, Coconut-Shell-Based, and More), Form (Powdered Activated Carbon (PAC), Granular Activated Carbon (GAC), and Extruded/Pelletised Activated Carbon (EAC)), Application (Decolorization Treatment, Sugar Production, and More), End-User Industry (Water Treatment, Industrial Processing, and More), and Geography (Asia-Pacific, North America, and More).
Geography Analysis
Asia-Pacific held a dominant 63% revenue share in 2024 and is forecast to grow at a leading 6.11% CAGR to 2030, reinforcing its centrality to activated carbon market expansion. China anchors regional production with vertically integrated plants that convert coconut shells, coal, and sawdust into a broad portfolio of carbons tailored for domestic water utilities and export markets. India's Jal Jeevan mission, targeting universal rural-water access, is issuing tender documents that stipulate GAC filters for arsenic and fluoride removal, thereby opening procurement to both local mills and Japanese-owned subsidiaries.
North America is buoyed by regulatory certainty and high per-capita consumption. The 2024 EPA PFAS rule alone could double GAC demand by the end of the decade. Europe commands a smaller yet technologically sophisticated market. Research at the University of Cambridge yielded an electrified charcoal sponge that adsorbs CO2 directly from air with reduced energy input, hinting at future diversification into climate-mitigation applications.
South America and the Middle East, though accounting for modest volume, record rapid adoption of carbons for mining and gas-processing duties. Chilean gold miners specify coconut-shell carbons for CIL circuits, while Qatari LNG producers deploy pelletized carbons to meet stringent mercury spec contamination limits prior to cryogenic separation.
- Albemarle Corporation
- Arq, Inc.
- Carbon Activated Corporation
- CarboTech
- CPL
- Donau Carbon GmbH
- HAYCARB PLC
- Ingevity
- KALPAKA CHEMICALS
- KURARAY CO., LTD.
- MICBAC INDIA
- Nanping Yuanli Active Carbon Company
- Norit
- Osaka Gas Chemicals Co., Ltd
- Rotocarb
- Silcarbon Aktivkohle GmbH
- Suneeta Carbons
Additional Benefits:
- The market estimate (ME) sheet in Excel format
- 3 months of analyst support
TABLE OF CONTENTS
1 Introduction
- 1.1 Study Assumptions and Market Definition
- 1.2 Scope of the Study
2 Research Methodology
3 Executive Summary
4 Market Landscape
- 4.1 Market Overview
- 4.2 Market Drivers
- 4.2.1 Conformance to Stringent Environmental Regulations in Water Treatment Applications in the United States
- 4.2.2 Augmenting Prominence for Air Pollution Control (Especially Mercury Removal)
- 4.2.3 Growing Water Purification Demand
- 4.2.4 Gold Mining and Metal Recovery
- 4.2.5 High demand from Agriculture and Agrochemicals
- 4.3 Market Restraints
- 4.3.1 Supply-chain disruption of coconut shell feedstock
- 4.3.2 Escalating kiln-grade coal prices narrowing margins for coal-based PAC makers
- 4.3.3 High capital intensity of reactivation plants limiting circular business models
- 4.4 Value Chain Analysis
- 4.5 Porter's Five Forces
- 4.5.1 Bargaining Power of Suppliers
- 4.5.2 Bargaining Power of Buyers
- 4.5.3 Threat of New Entrants
- 4.5.4 Threat of Substitutes
- 4.5.5 Degree of Competition
5 Market Size and Growth Forecasts (Value and Volume)
- 5.1 By Raw Material
- 5.1.1 Coal-Based
- 5.1.2 Coconut-Shell-Based
- 5.1.3 Wood-Based
- 5.1.4 Other Raw Materials (Peat, Lignite, etc.)
- 5.2 By Form
- 5.2.1 Powdered Activated Carbon (PAC)
- 5.2.2 Granular Activated Carbon (GAC)
- 5.2.3 Extruded / Pelletised Activated Carbon (EAC)
- 5.3 By Application
- 5.3.1 Decolorization Treatment
- 5.3.2 Sugar Production
- 5.3.3 Concentration Treatment
- 5.3.4 Solvent Recovery
- 5.3.5 PFAS Adsorption Treatment
- 5.3.6 Drinking Water Treatment
- 5.3.7 Other Applications
- 5.4 By End-user Industry
- 5.4.1 Water Treatment
- 5.4.2 Industrial Processing
- 5.4.3 Healthcare
- 5.4.4 Food and Beverage
- 5.4.5 Automotive
- 5.4.6 Other End-user Industry
- 5.5 By Geography
- 5.5.1 Asia-Pacific
- 5.5.1.1 China
- 5.5.1.2 India
- 5.5.1.3 Japan
- 5.5.1.4 South Korea
- 5.5.1.5 Rest of Asia-Pacific
- 5.5.2 North America
- 5.5.2.1 United States
- 5.5.2.2 Canada
- 5.5.2.3 Mexico
- 5.5.3 Europe
- 5.5.3.1 Germany
- 5.5.3.2 United Kingdom
- 5.5.3.3 France
- 5.5.3.4 Italy
- 5.5.3.5 Spain
- 5.5.3.6 Rest of Europe
- 5.5.4 South America
- 5.5.4.1 Brazil
- 5.5.4.2 Argentina
- 5.5.4.3 Rest of South America
- 5.5.5 Middle-East and Africa
- 5.5.5.1 Saudi Arabia
- 5.5.5.2 South Africa
- 5.5.5.3 Rest of Middle-East and Africa
- 5.5.1 Asia-Pacific
6 Competitive Landscape
- 6.1 Market Concentration
- 6.2 Strategic Moves
- 6.3 Market Share Analysis
- 6.4 Company Profiles (includes Global-level Overview, Market-level Overview, Core Segments, Financials as available, Strategic Information, Market Rank/Share, Products and Services, and Recent Developments)
- 6.4.1 Albemarle Corporation
- 6.4.2 Arq, Inc.
- 6.4.3 Carbon Activated Corporation
- 6.4.4 CarboTech
- 6.4.5 CPL
- 6.4.6 Donau Carbon GmbH
- 6.4.7 HAYCARB PLC
- 6.4.8 Ingevity
- 6.4.9 KALPAKA CHEMICALS
- 6.4.10 KURARAY CO., LTD.
- 6.4.11 MICBAC INDIA
- 6.4.12 Nanping Yuanli Active Carbon Company
- 6.4.13 Norit
- 6.4.14 Osaka Gas Chemicals Co., Ltd
- 6.4.15 Rotocarb
- 6.4.16 Silcarbon Aktivkohle GmbH
- 6.4.17 Suneeta Carbons
7 Market Opportunities and Future Outlook
- 7.1 White-space and Unmet-need Assessment
- 7.2 Rising Research Activities Research to Develop Bio-based Plastics
 超級電容用活性碳:全球市佔率及排名、總收入及需求預測(2025-2031年)活性碳移動過濾器:全球市佔率排名、總銷售額和需求預測(2025-2031年)
 木質活性碳市場按應用、最終用途、形態、來源和製造程序分類-2025-2032年全球預測活性碳過濾器市場按類型、形態、原料來源、製造方法、應用、最終用戶和分銷管道分類-2025-2032年全球預測
 活性碳過濾器市場-全球產業規模、佔有率、趨勢、機會和預測,按活性碳類型、形式、應用、地區和競爭情況細分,2020-2030 年活性碳市場按產品類型、原料、孔徑分佈、活化製程、最終用戶、分銷管道和應用分類 - 2025-2030 年全球預測顆粒竹活性碳市場(按原始材料、製造方法、粒度、應用和分銷管道)—2025-2030 年全球預測活性碳市場-全球產業規模、佔有率、趨勢、機會及預測,按類型、原料、最終用戶、地區及競爭情況細分,2020-2030 年
 全球氣體純化系統市場
 活性碳市場規模、佔有率和趨勢分析報告:按類型、應用、最終用途、地區和細分市場預測,2025 年至 2033 年