


 |
市場調查報告書
商品編碼
1851524
小型液化天然氣:市場佔有率分析、行業趨勢、統計數據和成長預測(2025-2030 年)Small-scale LNG - Market Share Analysis, Industry Trends & Statistics, Growth Forecasts (2025 - 2030) |
||||||
※ 本網頁內容可能與最新版本有所差異。詳細情況請與我們聯繫。
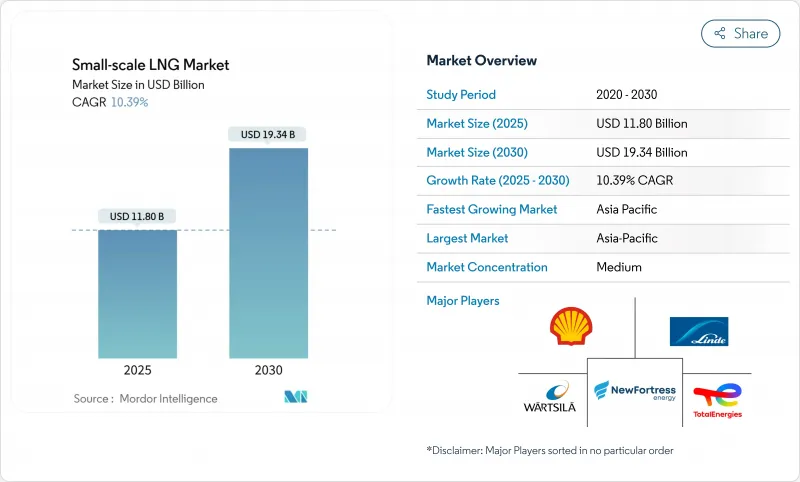
預計到 2025 年,小型液化天然氣市場規模將達到 118 億美元,到 2030 年將達到 193.4 億美元,在預測期(2025-2030 年)內,複合年成長率將達到 10.39%。
需求主要由各行業和偏遠社區從石油和柴油轉向天然氣驅動,開發商正部署預製工廠以利用閒置天然氣並縮短建造週期。針對年產能低於100萬噸的液化技術、液化天然氣在散裝運輸領域日益成長的應用,以及主要經濟體的監管激勵措施,都在推動強勁的資本形成。隨著全球能源巨頭和靈活敏捷的專業公司競相獲取優質資產、建立策略聯盟並在整個價值鏈上建立獨特的技術平台,競爭日益激烈。儘管由於地緣政治不確定性加劇以及合約期限向短期轉移,現貨價格波動性有所上升,但電力、航運和卡車運輸業對液化天然氣的持續採用仍帶來了持續的成長機會。
全球小型液化天然氣市場趨勢與洞察
國際海事組織和歐盟燃料協會收緊海上硫排放上限,加速海上液化天然氣燃料庫的普及。
國際海事組織(IMO)和歐盟「排放交易體系(ETS)對停靠歐盟港口的大型船舶的二氧化碳排放進行定價,而「燃料歐盟海事一攬子計畫」則要求到2025年將碳排放強度降低2%。然而,以LNG為燃料的船舶,其全生命週期排放為76.3-92.3克二氧化碳當量/兆焦耳(gCO2e/MJ),則有時間到2034年才能達到這一目標。預計2023年,全球LNG燃料需求將達到1,290萬噸,2024年底,將有56艘LNG加註船投入使用。船東們正積極回應,創紀錄地訂購雙燃料新船和整修,推動歐洲各港口對岸上裝卸臂、低溫軟管和安全通訊協定的投資。
快速建造用於偏遠礦區和離網發電的模組化液化廠
在管線網路稀少的地區,安裝在撬裝式或駁船上的工廠預製液化裝置降低了進入門檻。貝克休斯公司收到的航空衍生渦輪機組和電機驅動裝置的訂單有所增加,這些裝置佔地面積小,並能實現現場作業和模組化製造的重疊。印尼的一項試點計畫表明,向偏遠地區的柴油發電廠供應液化天然氣可將平準化發電成本降低55%至60%。對於希望將廢氣天然氣變現的非洲礦業公司而言,模組化方案同樣具有吸引力,與柴油進口相比,其投資回收期更短。
撒哈拉以南非洲稀疏的ISO罐式回程傳輸物流
奈及利亞已探明的150兆立方英尺天然氣蘊藏量仍未充分利用,其ISO罐式貨櫃車隊面臨道路網路落後和雙向貿易流量不足的問題。由於缺乏回程貨物,業者不得不重新調配空罐,導致單次運輸成本上升,並降低了內陸州的市場競爭力。區域能源組織強調,如果液化天然氣要取代居民和小型商業領域的生質能能源,就必須建立多式聯運走廊並統一海關程序。
細分市場分析
液化終端將佔2024年收入的62.5%,這反映了它們在沒有管道的地區實現天然氣貨幣化的關鍵作用。小型液化天然氣市場規模的這一部分得益於簡化的小型模組化反應器(SMR)工藝,這些工藝在資本成本和能源效率之間取得了平衡。光是美國就計劃將微型液化天然氣產能提高到每天230萬加侖。隨著再氣化設施的快速發展,液化設施在小型液化天然氣市場佔有率預計將略有下降,但考慮到礦場和農村公共產業新增的非電力需求,絕對吞吐量可能會增加。
浮體式儲存再氣化裝置(FSRU)的試運行成本約為3億美元,試運行期為一至三年,遠低於陸上替代方案,預計到2030年將以14%的複合年成長率成長。淺吃水船舶和鉸接式拖船等創新技術使得FSRU能夠進入以往難以到達的河流和近岸錨地。開發商正將這些FSRU與發電駁船和模組化複合迴圈發電廠結合,以增加在非洲、南亞和加勒比地區的天然氣銷售。
2024年,公路運輸收入佔總收入的52.5%,這得益於其能夠向管道網路覆蓋範圍之外的地區進行配送。光是Stabilis Solutions一家公司就利用43,000輛卡車運輸超過4.2億加侖的貨物,充分展現了這種「虛擬管道」模式的強大韌性。其成本競爭力主要歸功於模組化低溫幫浦、標準ISO儲槽介面以及能夠最佳化週轉時間的GPS定位車隊調度工具。
燃料庫成長最為迅猛,複合年成長率高達14.5%,這主要得益於低硫海運法規的推動,該法規有利於液化天然氣雙燃料船舶的發展。目前,液化天然氣供應已覆蓋198個港口,船舶燃料供應船隊由56艘專用船舶組成。為了適應港口佈局和船舶航程安排,供應鏈正日益融合陸路運輸、船對船運輸和管道運輸等多種運輸方式。
小型液化天然氣市場報告按類型(液化終端、再氣化終端)、供應方式(卡車、轉運/燃料庫、管道/鐵路、ISO集裝箱)、應用(運輸、發電、其他)、最終用戶(公共產業/獨立發電商、上游油氣營運商、其他)和地區(北美、歐洲、亞太、南美、中東和非洲)進行細分。
區域分析
預計到2024年,亞太地區將貢獻全球47.5%的收入,並在2030年之前維持16%的最高複合年成長率。該地區的進口能力預計將從2022年的1527萬噸/年增加到2025年的2300萬噸/年。中國計劃在2024年進口7,864萬噸液化天然氣,並積極部署其「藍色走廊」加氣站。印尼透過證明小型液化天然氣發電系統比高速柴油發電系統性能低60%,為數百個島嶼電網的建設鋪平了道路,從而支持了這一模式。
歐洲約佔全球天然氣市場佔有率的25%,這主要得益於嚴格的碳排放法規以及擺脫對俄羅斯天然氣的依賴。歐洲大陸擁有28個大型進口終端和8個小型設施,總合氣供給能力達2,270億立方米,相當於2024年需求的40%。北歐叢集在海運領域引入了先進的環保競標,鹿特丹、澤布呂赫和克萊佩達等港口為該地區的燃料庫網路提供了支持。自2021年以來,液化天然氣在歐盟天然氣總供應量中的佔比增加了一倍以上,為靈活的行動終端提供了穩定的基本負載。
北美約佔全球液化天然氣銷售額的20%,其中美國是技術領導者和最大的出口國。自2018年以來,美國的液化天然氣出口能力增加了兩倍,到2030年,隨著已獲批准計劃的推進,出口能力將增加近一倍。該地區的小規模液化天然氣市場受益於豐富的頁岩氣資源、扣除額以及液化天然氣作為卡車和鐵路燃料的快速普及——預計其出口量將從2018年的4.99億加侖增至2030年的19億加侖。加拿大和墨西哥的開發商也在探索模組化工廠,以連接偏遠礦區和工業。
剩餘需求主要分佈在拉丁美洲和中東及非洲。拉丁美洲的成長中心是巴西、智利和多明尼加共和國,這些國家採用浮體式進口解決方案,可快速推出液化天然氣發電計劃。中東地區天然氣原料豐富,小型液化天然氣計畫主要用於為偏遠油田作業和島嶼旅遊設施供電。非洲是液化天然氣覆蓋範圍最窄的地區,受到物流瓶頸的限制,但一旦運輸瓶頸得到緩解,奈及利亞和莫三比克將擁有巨大的發展潛力。
其他福利:
- Excel格式的市場預測(ME)表
- 3個月的分析師支持
目錄
第1章 引言
- 研究假設和市場定義
- 調查範圍
第2章調查方法
第3章執行摘要
第4章 市場情勢
- 市場概覽
- 市場促進因素
- 國際海事組織和歐盟燃料協會收緊海上硫排放上限將加速歐洲船用液化天然氣燃料庫技術的普及。
- 快速建造用於偏遠礦區和離網發電的模組化液化廠(亞太地區)
- 中國的「藍色走廊」計劃促使重型卡車轉向使用液化天然氣
- 將加勒比海和中美洲的微電網改造為液化天然氣發電
- 根據美國《通貨膨脹控制法》,小型液化天然氣設施可享有稅收優惠。
- 北歐液化天然氣公車和渡輪補貼計畫推動了燃料庫需求。
- 市場限制
- 撒哈拉以南非洲稀疏的ISO罐式回程傳輸物流
- 年產量低於 0.05 百萬噸的工廠,其蒸發和再液化成本較高。
- 巴西移動式液化裝置的許可框架碎片化
- 俄烏衝突加劇現貨液化天然氣的地緣政治風險溢價
- 供應鏈分析
- 監理展望
- 技術展望
- 波特五力模型
- 供應商的議價能力
- 買方的議價能力
- 新進入者的威脅
- 替代品的威脅
- 競爭對手之間的競爭
第5章 市場規模與成長預測
- 按類型
- 液化終端(微型、迷你型、小型)
- 再氣化終端(陸上和海上浮式儲存再氣化裝置)
- 透過供應表格
- 追蹤
- 管道和鐵路
- 轉運和燃料庫(船對船,船對岸)
- ISO貨櫃
- 透過使用
- 運輸(公路和海上燃料庫)
- 工業原料
- 發電
- 其他用途
- 最終用戶
- 公共產業和獨立發電商 (IPP)
- 上游油氣業者
- 製造業
- 商業和市政
- 按地區
- 北美洲
- 美國
- 加拿大
- 墨西哥
- 歐洲
- 英國
- 德國
- 法國
- 西班牙
- 北歐國家
- 俄羅斯
- 其他歐洲地區
- 亞太地區
- 中國
- 印度
- 日本
- 韓國
- 馬來西亞
- 泰國
- 印尼
- 越南
- 澳洲
- 亞太其他地區
- 南美洲
- 巴西
- 阿根廷
- 哥倫比亞
- 南美洲其他地區
- 中東和非洲
- 阿拉伯聯合大公國
- 沙烏地阿拉伯
- 卡達
- 埃及
- 南非
- 其他中東和非洲地區
- 北美洲
第6章 競爭情勢
- 市場集中度
- 策略性舉措(併購、夥伴關係、購電協議)
- 市場佔有率分析(主要企業的市場排名/佔有率)
- 公司簡介
- Linde plc
- Wartsila Oyj Abp
- Baker Hughes Co.
- Honeywell UOP
- Chart Industries Inc.
- Black & Veatch
- New Fortress Energy LLC
- Shell plc
- TotalEnergies SE
- Eni SpA
- PJSC Gazprom
- Novatek PJSC
- Gasum Oy
- Engie SA
- Anthony Veder Group NV
- Stolt-Nielsen Gas Ltd
- Eagle LNG Partners
- Guanghui Energy Co.
- Equinor ASA
- Pavilion Energy Pte Ltd
第7章 市場機會與未來展望
The Small-scale LNG Market size is estimated at USD 11.80 billion in 2025, and is expected to reach USD 19.34 billion by 2030, at a CAGR of 10.39% during the forecast period (2025-2030).
Demand is propelled by industrial and remote communities that are switching from oil and diesel to natural gas, while developers monetize stranded gas and deploy prefabricated plants that shorten construction schedules. Liquefaction technologies optimized for capacities below 1 MTPA, the widening use of LNG in heavy-duty transport, and regulatory incentives in major economies underpin robust capital formation. Competition is intensifying as global energy majors and agile specialists race to secure prime assets, form strategic alliances, and embed proprietary technology platforms across the value chain. Heightened geopolitical uncertainty and the pivot to short-term contracting have raised spot-price volatility, yet continued LNG adoption across power, marine, and trucking segments points to sustained growth opportunities.
Global Small-scale LNG Market Trends and Insights
Tightening IMO & FuelEU Maritime Sulphur Caps Accelerating Marine LNG Bunkering Adoption
New sulphur and greenhouse-gas limits set by the IMO and the FuelEU Maritime package are encouraging vessel operators to adopt LNG to avoid rising carbon compliance costs. The EU Emissions Trading System now prices CO2 from large ships calling at EU ports, and the FuelEU rule requires a 2% cut in carbon intensity by 2025, a target that LNG-fueled ships can meet through 2034 thanks to life-cycle emissions between 76.3-92.3 gCO2e/MJ. Global bunkering demand reached 12.9 million t in 2023, supported by a fleet of 56 LNG bunker vessels by end-2024. Shipowners are responding with record dual-fuel new-build orders and retrofits, driving investments in shore-side loading arms, cryogenic hoses, and safety protocols across European ports.
Rapid Build-Out of Modular Liquefaction Plants for Remote Mining & Off-Grid Power
Factory-fabricated liquefiers mounted on skids or barges are lowering entry barriers in regions where pipeline grids are sparse. Baker Hughes notes rising orders for aeroderivative turbine trains and electric-motor drives that shrink footprints and allow site work to overlap with module fabrication. Indonesia's pilot program showed that supplying remote diesel-fired power plants with LNG can cut levelized generation costs by 55-60% and still yield delivered prices of 10.35-11.28 USD/MMBtu. The modular approach is equally attractive to African miners seeking to monetize flare gas, yielding shorter payback horizons relative to diesel imports.
Sparse ISO-Tank Back-Haul Logistics in Sub-Saharan Africa
Nigeria's 150 tcf of proven gas reserves remain underutilized as ISO-tank fleets face poor road links and minimal two-way trade flows. A lack of return cargo forces operators to reposition empty containers, inflating per-trip costs and eroding the competitiveness of the small-scale LNG market in landlocked states. Regional energy agencies highlight the need for multimodal corridors and harmonized customs procedures before LNG can displace biomass in residential and small commercial segments.
Other drivers and restraints analyzed in the detailed report include:
- Heavy-Duty Truck Fleet Shift to LNG in China's "Blue Corridor" Program
- Caribbean & Central-American Micro-Grid Conversions to LNG-to-Power
- High Boil-Off & Re-Liquefaction Costs Below 0.05 MTPA Plants
For complete list of drivers and restraints, kindly check the Table Of Contents.
Segment Analysis
Liquefaction terminals generated 62.5% of 2024 revenue, reflecting their pivotal role in gas monetization where pipelines are absent. This portion of the small-scale LNG market size is supported by simplified SMR process trains that balance capital cost and energy efficiency. Developers in the United States alone plan to lift combined micro-LNG capacity to 2.3 million gallons per day. The small-scale LNG market share held by liquefaction facilities is expected to decline slightly as regasification assets grow faster, yet absolute throughput will rise given new off-grid demand from mines and rural utilities.
A parallel wave of floating storage and regasification units is reshaping import options for emerging buyers. FSRUs require USD 300 million and 1-3 years to commission, far below onshore alternatives, and are forecast to post a 14% CAGR through 2030. Innovations such as shallow-draft hulls and articulated tug barges allow access to rivers and near-shore anchorages once deemed unreachable. Developers pair these units with power barges or modular combined-cycle plants, unlocking incremental offtake in Africa, South Asia, and the Caribbean.
Road-based delivery held 52.5% of 2024 revenue thanks to its ability to reach sites beyond pipeline grids. Stabilis Solutions alone has moved more than 420 million gallons via 43,000 truckloads, demonstrating the resilience of this "virtual pipeline" model. Cost competitiveness stems from modular cryogenic pumps, standard ISO-tank interfaces, and GPS-linked fleet scheduling tools that optimize turnaround times.
Bunkering exhibits the sharpest growth at a 14.5% CAGR, propelled by low-sulphur marine rules that favor LNG-dual-fuel ships. LNG is now available in 198 ports, and the bunker fleet stands at 56 specialized vessels-both numbers are poised to multiply as more than 1,200 LNG-capable ships could sail by 2028. Supply chains increasingly blend truck-to-ship, ship-to-ship, and pipeline-to-ship delivery methods to match port layouts and vessel schedules.
The Small-Scale LNG Market Report is Segmented by Type (Liquefaction Terminal and Regasification Terminal), Mode of Supply (Truck, Transshipment and Bunkering, Pipeline and Rail, and ISO Container), Application (Transportation, Power Generation, and Others), End-User (Utilities and IPPs, Oil and Gas Upstream Operators, and Others), and Geography (North America, Europe, Asia-Pacific, South America, and Middle East and Africa).
Geography Analysis
Asia-Pacific generated 47.5% of global revenue in 2024 and is forecast to maintain the highest 16% CAGR through 2030. Regional import capacity rose from 15.27 mtpa in 2022 to an expected 23 mtpa by 2025. China remains the linchpin, importing 78.64 MT of LNG in 2024, while aggressively rolling out "Blue Corridor" refueling nodes. Indonesia corroborates the model by demonstrating that small-scale LNG can undercut high-speed diesel by up to 60%, opening avenues for hundreds of island grids.
Europe accounted for roughly 25% of market value, driven by stringent carbon rules and diversification from Russian gas. The continent hosts 28 large-scale import terminals and 8 small-scale facilities totaling 227 bcm of regas capacity, equivalent to 40% of 2024 demand. The Nordic cluster deploys the most advanced environmental tendering in maritime transport, and ports such as Rotterdam, Zeebrugge, and Klaipeda anchor regional bunkering networks. The EU's share of LNG in overall gas supply has more than doubled since 2021, translating into stable base-load for flexible mobile terminals.
North America contributed roughly 20% of revenue, with the United States as the technology leader and largest exporter. US LNG export capacity has tripled since 2018 and will nearly double again by 2030 on sanctioned projects. The local small-scale LNG market climbed from 499 million gallons in 2018 toward 1.9 billion gallons by 2030, propelled by shale gas abundance, tax credits, and accelerating adoption of LNG as truck and rail fuel. Canadian and Mexican developers also explore modular plants to connect remote mines and industrial parks.
The remainder of demand is split among Latin America, the Middle East, and Africa. Latin America's growth centers on Brazil, Chile, and the Dominican Republic, where floating import solutions allow fast ramp-up of LNG-to-power projects. The Middle East uses small-scale LNG mainly for remote oilfield operations and island tourism complexes, leveraging abundant gas feedstock. Africa remains the least penetrated region, constrained by logistics gaps, yet Nigeria and Mozambique present sizable upside if transport bottlenecks ease.
- Linde plc
- Wartsila Oyj Abp
- Baker Hughes Co.
- Honeywell UOP
- Chart Industries Inc.
- Black & Veatch
- New Fortress Energy LLC
- Shell plc
- TotalEnergies SE
- Eni SpA
- PJSC Gazprom
- Novatek PJSC
- Gasum Oy
- Engie SA
- Anthony Veder Group NV
- Stolt-Nielsen Gas Ltd
- Eagle LNG Partners
- Guanghui Energy Co.
- Equinor ASA
- Pavilion Energy Pte Ltd
Additional Benefits:
- The market estimate (ME) sheet in Excel format
- 3 months of analyst support
TABLE OF CONTENTS
1 Introduction
- 1.1 Study Assumptions & Market Definition
- 1.2 Scope of the Study
2 Research Methodology
3 Executive Summary
4 Market Landscape
- 4.1 Market Overview
- 4.2 Market Drivers
- 4.2.1 Tightening IMO & FuelEU Maritime Sulphur Caps Accelerating Marine LNG Bunkering Adoption (Europe)
- 4.2.2 Rapid Build-out of Modular Liquefaction Plants for Remote Mining & Off-Grid Power (Asia-Pacific)
- 4.2.3 Heavy-Duty Truck Fleet Shift to LNG in China's "Blue Corridor" Program
- 4.2.4 Caribbean & Central-American Micro-grid Conversions to LNG-to-Power
- 4.2.5 Tax Incentives for Small-Scale LNG Equipment under US Inflation Reduction Act
- 4.2.6 Nordic LNG Bus & Ferry Subsidy Schemes Driving Demand for Bunkering
- 4.3 Market Restraints
- 4.3.1 Sparse ISO-Tank Back-haul Logistics in Sub-Saharan Africa
- 4.3.2 High Boil-Off & Re-liquefaction Costs Below 0.05 MTPA Plants
- 4.3.3 Fragmented Permitting Framework for Mobile Liquefiers in Brazil
- 4.3.4 Russia-Ukraine Conflict Raising Geopolitical Risk Premium on Spot LNG
- 4.4 Supply-Chain Analysis
- 4.5 Regulatory Outlook
- 4.6 Technological Outlook
- 4.7 Porter's Five Forces
- 4.7.1 Bargaining Power of Suppliers
- 4.7.2 Bargaining Power of Buyers
- 4.7.3 Threat of New Entrants
- 4.7.4 Threat of Substitutes
- 4.7.5 Intensity of Competitive Rivalry
5 Market Size & Growth Forecasts
- 5.1 By Type
- 5.1.1 Liquefaction Terminal (Micro, Mini, and Small)
- 5.1.2 Regasification Terminal (Onshore and Offshore FSRU)
- 5.2 By Mode of Supply
- 5.2.1 Truck
- 5.2.2 Pipeline and Rail
- 5.2.3 Transshipment and Bunkering (Ship-to-ship and Shore-to-ship)
- 5.2.4 ISO Container
- 5.3 By Application
- 5.3.1 Transportation (Road and Marine Bunkering)
- 5.3.2 Industrial Feedstock
- 5.3.3 Power Generation
- 5.3.4 Other Applications
- 5.4 By End-User
- 5.4.1 Utilities and Independent Power Producers (IPPs)
- 5.4.2 Oil nd Gas Upstream Operators
- 5.4.3 Manufacturing Industries
- 5.4.4 Commercial and Municipal
- 5.5 By Geography
- 5.5.1 North America
- 5.5.1.1 United States
- 5.5.1.2 Canada
- 5.5.1.3 Mexico
- 5.5.2 Europe
- 5.5.2.1 United Kingdom
- 5.5.2.2 Germany
- 5.5.2.3 France
- 5.5.2.4 Spain
- 5.5.2.5 Nordic Countries
- 5.5.2.6 Russia
- 5.5.2.7 Rest of Europe
- 5.5.3 Asia-Pacific
- 5.5.3.1 China
- 5.5.3.2 India
- 5.5.3.3 Japan
- 5.5.3.4 South Korea
- 5.5.3.5 Malaysia
- 5.5.3.6 Thailand
- 5.5.3.7 Indonesia
- 5.5.3.8 Vietnam
- 5.5.3.9 Australia
- 5.5.3.10 Rest of Asia-Pacific
- 5.5.4 South America
- 5.5.4.1 Brazil
- 5.5.4.2 Argentina
- 5.5.4.3 Colombia
- 5.5.4.4 Rest of South America
- 5.5.5 Middle East and Africa
- 5.5.5.1 United Arab Emirates
- 5.5.5.2 Saudi Arabia
- 5.5.5.3 Qatar
- 5.5.5.4 Egypt
- 5.5.5.5 South Africa
- 5.5.5.6 Rest of Middle East and Africa
- 5.5.1 North America
6 Competitive Landscape
- 6.1 Market Concentration
- 6.2 Strategic Moves (M&A, Partnerships, PPAs)
- 6.3 Market Share Analysis (Market Rank/Share for key companies)
- 6.4 Company Profiles (includes Global level Overview, Market level overview, Core Segments, Financials as available, Strategic Information, Products & Services, and Recent Developments)
- 6.4.1 Linde plc
- 6.4.2 Wartsila Oyj Abp
- 6.4.3 Baker Hughes Co.
- 6.4.4 Honeywell UOP
- 6.4.5 Chart Industries Inc.
- 6.4.6 Black & Veatch
- 6.4.7 New Fortress Energy LLC
- 6.4.8 Shell plc
- 6.4.9 TotalEnergies SE
- 6.4.10 Eni SpA
- 6.4.11 PJSC Gazprom
- 6.4.12 Novatek PJSC
- 6.4.13 Gasum Oy
- 6.4.14 Engie SA
- 6.4.15 Anthony Veder Group NV
- 6.4.16 Stolt-Nielsen Gas Ltd
- 6.4.17 Eagle LNG Partners
- 6.4.18 Guanghui Energy Co.
- 6.4.19 Equinor ASA
- 6.4.20 Pavilion Energy Pte Ltd
7 Market Opportunities & Future Outlook
- 7.1 White-Space & Unmet-Need Assessment
 小規模天然氣市場規模、佔有率和趨勢分析報告:按供應類型、類別、應用、地區和細分市場預測(2026-2033 年)
 小規模液化天然氣市場:2026-2032年全球市場預測(按設施類型、設備、終端類型、容量、安裝類型和應用分類)
 小規模天然氣市場報告:按終端類型、供應形式、儲存槽類型、應用和地區分類(2026-2034 年)
 2026年全球小規模天然氣市場報告
 小規模液化天然氣(SSLNG)液化裝置市場-全球產業規模、佔有率、趨勢、機會及預測(依應用、技術、產能、原料來源、地區及競爭格局分類,2021-2031)
 小型液化天然氣市場規模、佔有率和成長分析(按類型、供應方式、儲存槽容量、應用、最終用途和地區分類)-2026-2033年產業預測
 小規模LNG市場,規模,佔有率,趨勢,產業分析報告:各供給形態,類別,各用途,各地區 - 2025~2034年市場預測
 全球小型液化天然氣市場(按類型、供應模式、應用和地區)-2030 年預測
 亞太地區小型液化天然氣 -市場佔有率分析、產業趨勢與統計、成長預測(2025-2030)