


 |
市場調查報告書
商品編碼
1851486
英國太陽能:市場佔有率分析、行業趨勢、統計數據和成長預測(2025-2030 年)United Kingdom Solar Power - Market Share Analysis, Industry Trends & Statistics, Growth Forecasts (2025 - 2030) |
||||||
※ 本網頁內容可能與最新版本有所差異。詳細情況請與我們聯繫。
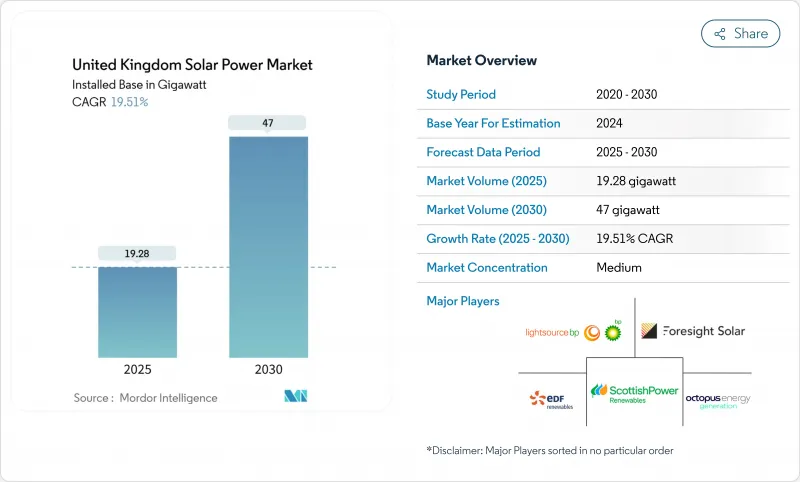
英國太陽能光電裝置容量市場規模預計將從 2025 年的 19.28 吉瓦成長到 2030 年的 47 吉瓦,預測期(2025-2030 年)的複合年成長率為 19.51%。
如今,以商業經濟為主導的模式已成為主流,市電平價定價使計劃無需補貼即可參與競爭,而併網規則改革也縮短了已準備就緒的資產的等待時間。企業購電協議(PPA)活動的增加、農光互補和儲能電站的成長、收入來源的拓展以及供應鏈本地化獎勵,都降低了對進口的依賴風險。然而,持續存在的障礙包括土地利用規劃方面的摩擦、英格蘭北部地區較長的併網等待時間以及差價合約(CfD)價格波動導致淨利率縮小。
英國太陽能市場趨勢與洞察
可再生能源證書延期促進企業購電協議
隨著再生能源證書(ROC)的購買價格在2025年至2026年間上漲至每張證書67.06英鎊,直接購買太陽能電力購買協議(PPA)比支付違約金更划算,這促成了數百兆瓦的企業承諾,並為債務融資結構提供了支持。隨著企業信貸取代補貼成為計劃融資能力的核心,開發人員可以更快地籌集資金並擴大其專案儲備。
實現平價上網加速商業太陽能發展
對於最佳地段而言,平準化成本低於批發日前價格,這使得開發人員無需差價合約 (CfD) 支持即可獲得與市場掛鉤的回報。英國國家電網公司斥資 580 億英鎊的「2030 年後升級計畫」專門為商業再生能源分配容量,這正吸引著投資者的目光。
英格蘭國家規劃政策架構中的土地利用規劃限制。
2018年至2023年間,三分之二的可再生能源提案被駁回或推遲,原因是農業保護法規凌駕於能源政策之上,迫使開發商在邊際土地上進行開發,推高了成本,並延長了授權流程。地方政府往往缺乏專業人員,即使國家目標鼓勵擴大太陽能發電,反對意見也會阻礙計劃的進展。
細分市場分析
由於供應鏈日趨成熟且每瓦成本不斷下降,到2024年,單晶矽將佔據英國太陽能市場65%的佔有率。薄膜矽的複合年成長率高達20.8%,這主要得益於其軟性輕質組件,這些組件因其半透明特性有利於作物生長,在農業太陽能框架中備受青睞。增強型被動發送器極背接觸(PERC)技術的持續發展不斷降低電池價格,擠壓了多晶的市場佔有率。新興的鈣鈦礦/矽疊層結構已在實驗室中測試出30%的效率,大學實驗室計畫在2027年前進行現場試驗。隨著可靠性門檻的降低,英國太陽能市場預計將採用高效的屋頂和建築幕牆設計,支撐起具有較高空間溢價的組件平均售價。
到2024年,地面安裝式光伏陣列將佔英國太陽能光電市場的69%,這主要得益於輔助設備成本的下降和佈局物流的簡化。南部地區的農場正擴大採用追蹤器,預計將使產量提高15%至25%。由於能源帳單持續不穩定以及新的建築法規要求所有住宅從2025年6月起必須安裝浮體式光電系統的可行性研究預測,其總合潛在發電量可達2.7太瓦時,但生態學授權延緩了該專案的實施。
英國太陽能光電市場報告按技術(單晶矽光伏、多晶光伏、其他)、安裝類型(屋頂、地面安裝、其他)、最終用戶(住宅、商業/工業、公共產業)、併網類型(併網、離網)、容量範圍(小於 5 千瓦、5-100 千瓦、100 千瓦-1 兆瓦、其他組件、光伏組件、光伏組件、光伏組件、逆變器類型、光伏組件、其他組件、光伏組件、光伏組件、光伏組件、光伏組件、光伏組件、其他組件、光伏組件、光伏組件、光伏組件、光伏組件、光伏組件、光變器、光伏組件、光伏組件、光伏組件、光伏組件、光伏組件、光變器中進行。
其他福利:
- Excel格式的市場預測(ME)表
- 3個月的分析師支持
目錄
第1章 引言
- 研究假設和市場定義
- 調查範圍
第2章調查方法
第3章執行摘要
第4章 市場情勢
- 市場概覽
- 市場促進因素
- 可再生能源證書(ROC)延期促進企業購電協議(PPA)的簽訂
- 實現大型計劃併市電平價,加速商業太陽能發電
- 國家電網電力系統營運商改革,鼓勵參與分散式太陽能發電
- 隨著英國農業部門脫碳,對農業光電的需求不斷成長。
- Ofgem的靈活連接線提高了併網太陽能發電的經濟效益
- 英國淨零排放策略中針對原始設備製造商供應鏈在地化的獎勵
- 市場限制
- 英格蘭國家規劃政策架構中的土地利用規劃限制
- 新疆矽模組供應鏈的進口依賴風險
- 英格蘭北部交通堵塞,轉乘時間過長
- 波動較大的差價合約執行價格限制了小型計劃的融資可行性。
- 供應鏈分析
- 監管環境
- 技術展望
- 波特五力模型
- 供應商的議價能力
- 買方的議價能力
- 新進入者的威脅
- 替代品的威脅
- 競爭對手之間的競爭
- PESTEL 分析
第5章 市場規模與成長預測
- 透過技術
- 單晶矽光電電池
- 多晶光電池
- 薄膜太陽能電池(CdTe、CIGS)
- 新興高效率裝置(TOPCon、HJT、鈣鈦礦串聯裝置)
- 拜山
- 屋頂太陽能
- 地面安裝式太陽能
- 浮體式太陽能
- 最終用戶
- 住宅
- 商業和工業
- 公用事業
- 並聯型性別
- 併網
- 離網
- 按容量範圍
- 小於5千瓦
- 5~100 kW
- 100 kW~1 MW
- 1兆瓦或以上
- 按組件
- 太陽能發電模組
- 逆變器
- 安裝和追蹤器
- 系統平衡 (BoS) 組件
第6章 競爭情勢
- 市場集中度
- 策略性舉措(併購、夥伴關係、購電協議)
- 市場佔有率分析(主要企業的市場排名/佔有率)
- 公司簡介
- Lightsource bp Renewable Energy Investments Ltd
- EDF Renewables UK(Electricite de France SA)
- Octopus Energy Generation
- Foresight Solar Fund Ltd
- ScottishPower Renewables(Iberdrola SA)
- SSE Renewables
- Statkraft UK
- Vattenfall AB
- BayWa re UK Ltd
- First Solar Inc.
- JinkoSolar Holding Co. Ltd
- Canadian Solar Inc.
- Trina Solar Co. Ltd
- Anesco Ltd
- Hive Energy Ltd
- Renewable Energy Systems Ltd
- Ecotricity Group Ltd
- Ameresco Inc.
- NextEnergy Capital Group
- Good Energy Group PLC
第7章 市場機會與未來展望
The United Kingdom Solar Power Market size in terms of installed base is expected to grow from 19.28 gigawatt in 2025 to 47 gigawatt by 2030, at a CAGR of 19.51% during the forecast period (2025-2030).
Merchant economics now dominate as grid-parity pricing allows projects to compete without subsidies, while reforms to grid-connection rules shorten queues for ready-to-build assets. Enhanced corporate PPA activity, expanding agrivoltaics and battery-coupled plants, broadening revenue options, and supply-chain localisation incentives de-risk import reliance. Persistent hurdles include land-use planning friction, long Northern England interconnection wait times, and price volatility in the Contracts-for-Difference (CfD) auctions that narrows margins.
United Kingdom Solar Power Market Trends and Insights
Renewable Energy Obligation Certificates Extension Spurs Corporate PPAs
ROC buy-out prices rise to GBP 67.06 per certificate for 2025-2026, making direct solar PPAs cheaper than paying penalties and triggering multi-hundred-megawatt corporate contracts that now underpin debt finance structures. Corporate credit replaces subsidies as the core of project bankability, allowing developers to close financing more quickly and scale pipelines.
Grid-Parity Achievement Accelerates Merchant Solar
Levelised costs have fallen below wholesale day-ahead prices in the best-irradiated sites, letting developers forego CfD support and capture market-linked revenues. National Grid's GBP 58 billion Beyond 2030 upgrade programme specifically allocates capacity for merchant renewables, widening investor interest.
Land-Use Planning Constraints in England's NPPF
Two-thirds of renewable proposals were refused or delayed between 2018-2023 because agricultural protection rules override energy policy, forcing developers onto marginal land that inflates costs and elongates permitting. Local authorities often lack specialist staff, so objections stall projects even when national targets encourage solar expansion.
Other drivers and restraints analyzed in the detailed report include:
- National Grid ESO Reform Opens the Queue for Distributed Solar
- Battery-Coupled Solar Economics Strengthened by Flexible Connection Code
- Grid Congestion & Long Queue Times in Northern England
For complete list of drivers and restraints, kindly check the Table Of Contents.
Segment Analysis
Monocrystalline silicon held 65% of the UK solar power market share in 2024, thanks to maturing supply chains and falling per-watt costs. Thin-film's 20.8% CAGR stems from flexible, lighter modules valued in agrivoltaic frames where translucence supports crop growth. Enhanced passivated emitter and rear contact (PERC) lines continue lowering cell prices, squeezing polycrystalline's role. Emerging tandem perovskite-on-silicon architectures test 30% lab efficiencies, with university labs targeting field pilots by 2027. Once reliability hurdles fall, the UK solar power market could adopt high-efficiency designs for roof and facade areas where space premiums justify higher module ASPs.
Ground-mounted arrays commanded 69% of the UK solar power market size 2024 on lower balance-of-plant costs and simpler layout logistics. Tracker deployment is rising on southern farms, adding 15-25% yield uplift. Residential rooftops now post a 21.5% CAGR as energy bills remain volatile and new-build rules mandate panels on all homes from June 2025. Commercial rooftops follow, using self-consumption to sidestep non-commodity charges. Floating solar feasibility studies across reservoirs total 2.7 TWh of output potential, though ecological permitting slows real-world execution.
The United Kingdom Solar Power Market Report is Segmented by Technology (Monocrystalline Silicon PV, Polycrystalline Silicon PV, and Others), Mounting (Rooftop Solar, Ground-Mounted Solar, and Others), End User (Residential, Commercial and Industrial, and Utility), Grid Connectivity (On-Grid and Off-Grid), Capacity Range (Below 5 KW, 5 To 100 KW, 100 KW To 1 MW, and Others), and Component (Solar PV Modules, Inverters, and Others).
List of Companies Covered in this Report:
- Lightsource bp Renewable Energy Investments Ltd
- EDF Renewables UK (Electricite de France SA)
- Octopus Energy Generation
- Foresight Solar Fund Ltd
- ScottishPower Renewables (Iberdrola SA)
- SSE Renewables
- Statkraft UK
- Vattenfall AB
- BayWa r.e. UK Ltd
- First Solar Inc.
- JinkoSolar Holding Co. Ltd
- Canadian Solar Inc.
- Trina Solar Co. Ltd
- Anesco Ltd
- Hive Energy Ltd
- Renewable Energy Systems Ltd
- Ecotricity Group Ltd
- Ameresco Inc.
- NextEnergy Capital Group
- Good Energy Group PLC
Additional Benefits:
- The market estimate (ME) sheet in Excel format
- 3 months of analyst support
TABLE OF CONTENTS
1 Introduction
- 1.1 Study Assumptions & Market Definition
- 1.2 Scope of the Study
2 Research Methodology
3 Executive Summary
4 Market Landscape
- 4.1 Market Overview
- 4.2 Market Drivers
- 4.2.1 Renewable Energy Obligation Certificates (ROCs) Extension Spurs Corporate PPAs
- 4.2.2 Grid-Parity Achievement in Utility-scale Projects Accelerating Merchant Solar
- 4.2.3 National Grid's ESO Reform Favouring Distributed Solar Participation
- 4.2.4 Rising Demand for Agri-PV to Decarbonise UK Farming Sector
- 4.2.5 Battery-Coupled Solar Economics Enhanced by Ofgem's Flexible Connection Code
- 4.2.6 OEM Supply-Chain Localisation Incentives Under UK Net-Zero Strategy
- 4.3 Market Restraints
- 4.3.1 Land-Use Planning Constraints in England's National Planning Policy Framework
- 4.3.2 Import Dependency Risk from Xinjiang Silicon Module Supply Chain
- 4.3.3 Grid Congestion & Long Queue Times for Connections in Northern England
- 4.3.4 Volatile CFD Strike Prices Limiting Small-scale Project Bankability
- 4.4 Supply-Chain Analysis
- 4.5 Regulatory Landscape
- 4.6 Technological Outlook
- 4.7 Porter's Five Forces
- 4.7.1 Bargaining Power of Suppliers
- 4.7.2 Bargaining Power of Buyers
- 4.7.3 Threat of New Entrants
- 4.7.4 Threat of Substitutes
- 4.7.5 Competitive Rivalry
- 4.8 PESTLE Analysis
5 Market Size & Growth Forecasts
- 5.1 By Technology
- 5.1.1 Monocrystalline Silicon PV
- 5.1.2 Polycrystalline Silicon PV
- 5.1.3 Thin-Film PV (CdTe, CIGS)
- 5.1.4 Emerging High-Efficiency (TOPCon, HJT, Perovskite Tandem)
- 5.2 By Mounting
- 5.2.1 Rooftop Solar
- 5.2.2 Ground-Mounted Solar
- 5.2.3 Floating Solar
- 5.3 By End User
- 5.3.1 Residential
- 5.3.2 Commercial and Industrial
- 5.3.3 Utility
- 5.4 By Grid Connectivity
- 5.4.1 On-Grid
- 5.4.2 Off-Grid
- 5.5 By Capacity Range
- 5.5.1 Below 5 kW
- 5.5.2 5 to 100 kW
- 5.5.3 100 kW to 1 MW
- 5.5.4 Above 1 MW
- 5.6 By Component
- 5.6.1 Solar PV Modules
- 5.6.2 Inverters
- 5.6.3 Mounting Structures and Trackers
- 5.6.4 Balance of System (BoS) Components
6 Competitive Landscape
- 6.1 Market Concentration
- 6.2 Strategic Moves (M&A, Partnerships, PPAs)
- 6.3 Market Share Analysis (Market Rank/Share for key companies)
- 6.4 Company Profiles (includes Global level Overview, Market level overview, Core Segments, Financials as available, Strategic Information, Products & Services, and Recent Developments)
- 6.4.1 Lightsource bp Renewable Energy Investments Ltd
- 6.4.2 EDF Renewables UK (Electricite de France SA)
- 6.4.3 Octopus Energy Generation
- 6.4.4 Foresight Solar Fund Ltd
- 6.4.5 ScottishPower Renewables (Iberdrola SA)
- 6.4.6 SSE Renewables
- 6.4.7 Statkraft UK
- 6.4.8 Vattenfall AB
- 6.4.9 BayWa r.e. UK Ltd
- 6.4.10 First Solar Inc.
- 6.4.11 JinkoSolar Holding Co. Ltd
- 6.4.12 Canadian Solar Inc.
- 6.4.13 Trina Solar Co. Ltd
- 6.4.14 Anesco Ltd
- 6.4.15 Hive Energy Ltd
- 6.4.16 Renewable Energy Systems Ltd
- 6.4.17 Ecotricity Group Ltd
- 6.4.18 Ameresco Inc.
- 6.4.19 NextEnergy Capital Group
- 6.4.20 Good Energy Group PLC
7 Market Opportunities & Future Outlook
- 7.1 White-space & Unmet-Need Assessment
 2025年超高效能太陽能全球市場報告
 全球智慧太陽能市場
 全球太陽能電錶市場規模、佔有率和趨勢分析(按技術、最終用途、產品、測量、整合類型和地區)、展望和預測(2025 年至 2032 年)太陽能光電市場分析及2034年預測:類型、產品、服務、技術、應用、組件、最終用戶、安裝類型、設備、解決方案太陽能電錶市場規模、佔有率、趨勢分析報告(按整合類型、產品類型、檢測法、技術、最終用途、地區、細分市場預測),2025 年至 2030 年美國太陽能電錶市場規模、佔有率、趨勢分析報告(按整合類型、產品類型、檢測法、技術、最終用途、細分市場預測,2025-2030 年)光伏幫浦市場分析及預測(至 2034 年):類型、產品、服務、技術、組件、應用、材料類型、部署、最終用戶、功能
 太陽能光伏發電儀表市場,規模,佔有率,趨勢,產業分析報告:整合類別,各產品,檢測法,各技術,各最終用途,各地區,2025年~2034年的市場預測
 太陽能電錶市場 - 全球產業規模、佔有率、趨勢、機會和預測(細分、按類型、按測量、按最終用戶、按外形尺寸、按地區、按競爭,2020-2030 年預測)2025年全球太陽能電錶市場報告