


 |
市場調查報告書
商品編碼
1851484
證券分析:市場佔有率分析、產業趨勢、統計數據和成長預測(2025-2030 年)Security Analytics - Market Share Analysis, Industry Trends & Statistics, Growth Forecasts (2025 - 2030) |
||||||
※ 本網頁內容可能與最新版本有所差異。詳細情況請與我們聯繫。
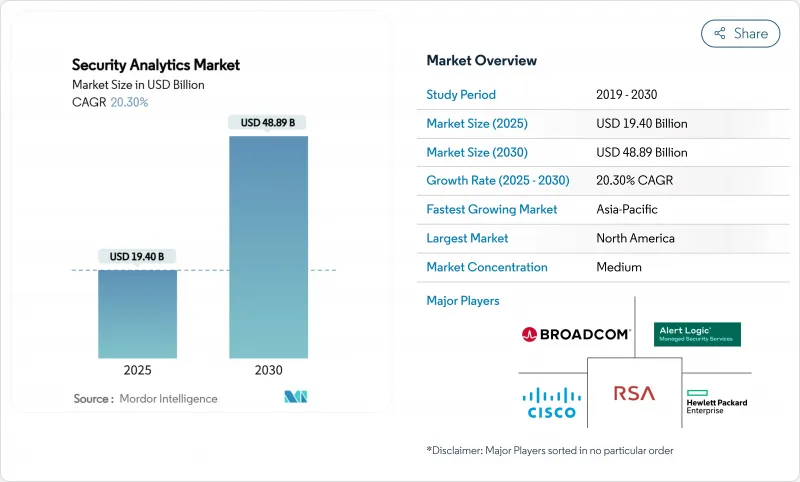
安全分析市場預計將從 2025 年的 194 億美元成長到 2030 年的 488.9 億美元,複合年成長率為 20.30%。
這種快速成長反映了企業致力於利用人工智慧主導的平台來抵禦高級網路攻擊,這些平台能夠即時分析數十億個事件。物聯網終端的爆炸性成長、雲端優先轉型計劃以及日益嚴格的法令遵循(需要自動化分析)是推動這一成長的主要因素。領先的供應商正在將安全資訊和事件管理 (SIEM)、安全營運自動化與回應 (SOAR)、用戶端行為分析 (UEBA) 和威脅情報整合到一個統一的套件中,以簡化操作並解決工具分散的問題。 CrowdStrike、Palo Alto Networks、微軟、IBM 和思科在分析的廣度、速度和原生自動化方面展開激烈競爭,而專注於特定領域的專家則憑藉差異化的人工智慧模型和雲端原生架構保持著市場地位。
全球安全分析市場趨勢與洞察
網路威脅日益複雜
國家級攻擊者如今正部署自動化工具鏈來規避基於特徵碼的防禦,這促使各組織轉向行為分析來偵測橫向移動和零時差漏洞。美國聯邦調查局指出,針對通訊業者的、由國家主導的監視和資料竊取攻擊激增。因此,安全團隊傾向於選擇具備機器學習模型的平台,這些模型能夠自學習網路基準,並在毫秒內標記異常路徑。供應商正在將用戶行為分析 (UEBA) 和威脅情報直接整合到其安全資訊和事件管理 (SIEM) 引擎中,以縮短攻擊者潛伏時間並提高平均偵測時間。這場競爭的贏家是那些無需手動特徵工程即永續重新訓練模型的供應商。
物聯網和自帶設備辦公終端的爆炸性成長
工業感測器、醫療設備和遠端辦公筆記型電腦正在擴大攻擊面,並突破邊界控制。一項發表在《科學報告》上的研究發現,超過 60% 的組織面臨與未託管設備相關的內部威脅。現代分析技術從 OT 閘道、行動 EDR 代理程式和邊緣節點收集遙測數據,並應用無監督學習來對設備行為進行分類。邊緣處理可降低延遲,即使在連接性下降的情況下也能確保持續運作。供應商現在將輕量級代理嵌入韌體,並將其與雲端圖分析相結合,以關聯數百萬個終端節點的異常情況。
數據整合和工具激增帶來的挑戰
大多數公司都在使用 25 到 50 種安全工具,每種工具輸出的日誌模式各不相同,這迫使他們使用自訂解析器,並導致關聯速度緩慢。 CSO Online 報告稱,整合開銷正在耗盡分析師的資源,並使他們無法識別跨向量攻擊。雖然買家正在用整合分析套件取代零散的解決方案,但對供應商鎖定的擔憂正在減緩替換計劃的進展。隨著雲端遷移增加複雜性,平台必須將本機系統日誌、雲端 API元資料和 SaaS審核追蹤規範化到單一資料湖中,否則將面臨資料孤島持續存在的風險。
細分市場分析
到2024年,網路安全分析將佔總收入的38%,這凸顯了深層封包檢測和NetFlow分析在安全分析市場中的持久重要性。隨著企業將工作負載遷移到外部部署並尋求跨雲端可見性,預計到2030年,雲端安全分析將以17.6%的複合年成長率成長。應用分析、網路分析和終端分析正在融合,以擴展偵測覆蓋範圍,而內部威脅模組則利用UEBA來分析使用者行為。
這些細分領域的整合迫使供應商採用基於微服務的收集器,將各種遙測資料整合到統一的資料架構中。與傳統規則引擎相比,提供人工智慧主導的策略建議和自動修復功能的平台可以將誤報率降低 59%。這使得整合套件對希望減少警報噪音,同時透過單一主機保護網路、應用和識別層的安全主管極具吸引力。
到2024年,本地部署方案將佔總收入的54.5%,這反映出企業在防火牆內保護敏感日誌和實施主權資料規則方面的投入。然而,隨著企業採用SASE和零信任架構,預計2030年,雲端部署的安全分析市場規模將以21%的複合年成長率成長。混合模式正在成為一種可行的過渡方案,它既允許在安全的雲端進行突發分析,又能將關鍵日誌保留在本地。
美國國防部的零信任架構 2.0 計畫於 2027 年實現全面覆蓋,並利用商業雲端分析技術實現可擴展性。基於使用量的授權模式和託管式資料攝取管道消除了資本支出障礙,甚至吸引了受監管行業將運算密集型關聯任務卸載到雲端。供應商還按區域部署雲端“單元”,以滿足資料駐留需求,同時又不犧牲分析深度。
區域分析
北美地區預計到2024年將佔總收入的42%,並將受益於龐大的網路安全預算和人工智慧增強型安全資訊與事件管理(SIEM)系統的早期應用。聯邦政府的強制性規定,例如要求持續診斷和資訊揭露的第14028號行政命令,將進一步推動相關支出。
亞太地區預計將以13.8%的複合年成長率成長,主要受雲端運算轉型、網路保險普及率飆升以及政府支持的數位化項目推動。根據 Gallagher Re 的數據,亞太地區的網路保險保費正以每年近50%的速度成長。澳洲、新加坡、日本和韓國在支出方面處於領先地位,而印度和中國則新增保單數量最多,這得益於本土科技巨頭不斷拓展其全球業務。
到2025年,拉丁美洲的IT預算將成長64%,優先發展分析技術以應對全部區域平均每秒1,600次的網路攻擊。中東和北非地區的IT預算到2025年將超過30億美元,這主要得益於石油天然氣和政府部門對人工智慧的廣泛應用。
其他好處
- Excel格式的市場預測(ME)表
- 3個月的分析師支持
目錄
第1章 引言
- 研究假設和市場定義
- 調查範圍
第2章調查方法
第3章執行摘要
第4章 市場情勢
- 市場概覽
- 市場促進因素
- 日益複雜的網路威脅情勢
- 物聯網和自帶設備辦公終端的爆炸性成長
- 雲端優先數位轉型計劃
- 全球擴大網路安全合規性
- 人工智慧驅動的多態惡意軟體的出現
- 未經管理的機器間身分的激增
- 市場限制
- 數據整合和工具氾濫帶來的挑戰
- 全球SOC分析師短缺
- 高度警覺疲勞和假陽性率
- 資料主權規則限制了分析活動。
- 價值/供應鏈分析
- 監管環境
- 技術展望
- 五力分析
- 新進入者的威脅
- 買方/消費者的議價能力
- 供應商的議價能力
- 替代品的威脅
- 競爭對手之間的競爭
第5章 市場規模與成長預測
- 透過使用
- 網路安全分析
- 應用安全分析
- 網路安全分析
- 端點安全分析
- 雲端安全分析
- 內部威脅分析
- 透過部署模式
- 本地部署
- 雲
- 混合
- 按組織規模
- 主要企業
- 小型企業
- 按最終用戶行業分類
- 銀行和金融服務
- 衛生保健
- 國防/安全
- 電訊和資訊技術
- 零售與電子商務
- 製造業
- 政府機構
- 按地區
- 北美洲
- 美國
- 加拿大
- 墨西哥
- 歐洲
- 英國
- 德國
- 法國
- 義大利
- 西班牙
- 俄羅斯
- 其他歐洲地區
- 亞太地區
- 中國
- 印度
- 日本
- 韓國
- 澳洲
- 亞太其他地區
- 南美洲
- 巴西
- 阿根廷
- 其他南美洲
- 中東和非洲
- 中東
- 沙烏地阿拉伯
- 阿拉伯聯合大公國
- 土耳其
- 其他中東地區
- 非洲
- 南非
- 奈及利亞
- 其他非洲地區
- 北美洲
第6章 競爭情勢
- 市場集中度
- 策略趨勢
- 市佔率分析
- 公司簡介
- Alert Logic, Inc.
- Arbor Networks, Inc.(NETSCOUT Systems, Inc.)
- Broadcom Inc.(Symantec Enterprise Division)
- Cisco Systems, Inc.
- RSA Security LLC
- Hewlett Packard Enterprise Company
- International Business Machines Corporation
- LogRhythm, Inc.
- Mandiant, Inc.
- Splunk Inc.
- Fortinet, Inc.
- McAfee, LLC
- Micro Focus International plc
- Securonix, Inc.
- Exabeam, Inc.
- Devo Technology, Inc.
- Microsoft Corporation
- Palo Alto Networks, Inc.
- CrowdStrike Holdings, Inc.
- Elastic NV
第7章 市場機會與未來展望
The security analytics market is valued at USD 19.40 billion in 2025 and is forecast to touch USD 48.89 billion by 2030, advancing at a CAGR of 20.30%.
The surge reflects enterprises' drive to neutralize sophisticated cyber-attacks with AI-led platforms that analyze billions of events in real time. Growth stems from an explosion of IoT endpoints, cloud-first transformation projects, and tightening compliance regimes that require automated analytics. Demand is further amplified by platform consolidation: large vendors now bundle SIEM, SOAR, UEBA, and threat-intelligence into single suites to simplify operations and counter tool sprawl. CrowdStrike, Palo Alto Networks, Microsoft, IBM, and Cisco compete aggressively on analytics breadth, speed, and native automation while niche specialists maintain traction through differentiated AI models and cloud-native architectures.
Global Security Analytics Market Trends and Insights
Sophistication of cyber-threat landscape
Nation-state actors now deploy automated toolchains that evade signature-based defenses, pushing enterprises toward behavioral analytics that detect lateral movement and zero-day exploits. The FBI cited a spike in state-sponsored attacks on telecom carriers aimed at surveillance and data exfiltration. Security teams therefore favor platforms with machine-learning models that self-learn network baselines and flag anomalous paths in milliseconds. Vendors integrate UEBA and threat-intel feeds directly into SIEM engines, shrinking dwell time and improving mean time to detect. This arms race rewards suppliers able to retrain models continuously without manual feature engineering.
Explosive growth of IoT and BYOD endpoints
Industrial sensors, medical devices, and remote-work laptops have swollen the attack surface, leaving perimeter controls ineffective. Research in Scientific Reports found that more than 60% of organizations suffered insider threats tied to unmanaged devices. Modern analytics ingest telemetry from OT gateways, mobile EDR agents, and edge nodes, applying unsupervised learning to classify device behaviors. Edge processing cuts latency and keeps operations running when connectivity drops. Vendors now embed lightweight agents in firmware and combine them with cloud-side graph analytics to correlate anomalies across fleets of millions of endpoints.
Data-integration and tool-sprawl challenges
Most enterprises juggle 25-50 security tools that emit disjointed log schemas, forcing custom parsers and delaying correlation. CSO Online reports that integration overhead drains analyst capacity and obscures cross-vector attacks. Buyers are replacing point solutions with converged analytics suites, yet fear of vendor lock-in slows rip-and-replace projects. As cloud migration compounds complexity, platforms must normalize on-prem Syslog, cloud API metadata, and SaaS audit trails within a single data lake, or risk perpetuating silos.
Other drivers and restraints analyzed in the detailed report include:
- Cloud-first digital-transformation programs
- Expanding global cybersecurity-compliance regimes
- Global shortage of SOC analysts
For complete list of drivers and restraints, kindly check the Table Of Contents.
Segment Analysis
Network security analytics generated 38% of 2024 revenue, underscoring the enduring role of deep-packet inspection and NetFlow analysis in the security analytics market. Cloud security analytics is advancing at 17.6% CAGR to 2030 as enterprises shift workloads off-premises and seek cross-cloud visibility. Application, web, and endpoint analytics together broaden detection coverage, while insider-threat modules employ UEBA to profile user behavior.
The convergence of these sub-segments pushes vendors to embed microservices-based collectors that ingest diverse telemetry into unified data fabrics. Platforms offering AI-driven policy recommendations and automated remediation now achieve a 59% drop in false positives versus legacy rule engines. Integrated suites therefore appeal to security leaders aiming to slash alert noise while protecting network, application, and identity layers in one console.
On-premise implementations held 54.5% revenue in 2024, reflecting sunk investments and sovereign-data rules that keep sensitive logs inside firewalls. Yet the security analytics market size for cloud deployments is forecast to expand at a 21% CAGR through 2030 as firms adopt SASE and zero-trust mandates. Hybrid models are emerging as a pragmatic bridge-critical logs remain local while burst analysis occurs in secure clouds.
The U.S. Department of Defense's Zero Trust Architecture 2.0 targets full coverage by 2027, leaning on commercial cloud analytics for scalability. Consumption-based licensing and managed ingestion pipelines erase capital expenditure hurdles, enticing even regulated industries to offload compute-intensive correlation tasks. Vendors also deploy regional cloud "cells" to meet data-residency directives without sacrificing analytic depth.
The Security Analytics Market Report is Segmented by Application (Network Security Analytics, Application Security Analytics, and More), Deployment Mode (On-Premise, Cloud, Hybrid), Organization Size (Large Enterprises, Small and Medium Enterprises), End-User Industry (Banking and Financial Services, Healthcare, and More), and Geography. The Market Forecasts are Provided in Terms of Value (USD).
Geography Analysis
North America commanded 42% revenue in 2024, benefitting from sizable cyber-budgets and early uptake of AI-enhanced SIEM. Federal directives such as Executive Order 14028 force continuous diagnostics and disclosure, further fueling spend.
Asia-Pacific is projected to grow at 13.8% CAGR, propelled by cloud migrations, cyber-insurance penetration jumps, and government-backed digital programs. Gallagher Re reports Asia-Pacific cyber-insurance premiums climbing nearly 50% annually. Australia, Singapore, Japan, and South Korea spearhead spending, yet India and China add the largest volume of new deployments as domestic tech champions scale globally.
Latin America eyes 64% IT-budget expansion for 2025, prioritizing analytics that handle a region-wide average of 1,600 attacks per second. EMEA growth remains steady; Europe leans on GDPR and the forthcoming Cyber Resilience Act, while Middle East and North Africa security outlays are set to exceed USD 3 billion in 2025, spurred by AI adoption in oil, gas, and government sectors.
- Alert Logic, Inc.
- Arbor Networks, Inc. (NETSCOUT Systems, Inc.)
- Broadcom Inc. (Symantec Enterprise Division)
- Cisco Systems, Inc.
- RSA Security LLC
- Hewlett Packard Enterprise Company
- International Business Machines Corporation
- LogRhythm, Inc.
- Mandiant, Inc.
- Splunk Inc.
- Fortinet, Inc.
- McAfee, LLC
- Micro Focus International plc
- Securonix, Inc.
- Exabeam, Inc.
- Devo Technology, Inc.
- Microsoft Corporation
- Palo Alto Networks, Inc.
- CrowdStrike Holdings, Inc.
- Elastic N.V.
Additional Benefits:
- The market estimate (ME) sheet in Excel format
- 3 months of analyst support
TABLE OF CONTENTS
1 INTRODUCTION
- 1.1 Study Assumptions and Market Definition
- 1.2 Scope of the Study
2 RESEARCH METHODOLOGY
3 EXECUTIVE SUMMARY
4 MARKET LANDSCAPE
- 4.1 Market Overview
- 4.2 Market Drivers
- 4.2.1 Sophistication of cyber-threat landscape
- 4.2.2 Explosive growth of IoT and BYOD endpoints
- 4.2.3 Cloud-first digital-transformation programs
- 4.2.4 Expanding global cybersecurity-compliance regimes
- 4.2.5 AI-driven polymorphic malware emergence
- 4.2.6 Surge in unmanaged machine-to-machine identities
- 4.3 Market Restraints
- 4.3.1 Data-integration and tool-sprawl challenges
- 4.3.2 Global shortage of SOC analysts
- 4.3.3 High alert-fatigue and false-positive rates
- 4.3.4 Data-sovereignty rules restricting analytics
- 4.4 Value / Supply-Chain Analysis
- 4.5 Regulatory Landscape
- 4.6 Technological Outlook
- 4.7 Porter?s Five Forces
- 4.7.1 Threat of New Entrants
- 4.7.2 Bargaining Power of Buyers/Consumers
- 4.7.3 Bargaining Power of Suppliers
- 4.7.4 Threat of Substitute Products
- 4.7.5 Intensity of Competitive Rivalry
5 MARKET SIZE AND GROWTH FORECASTS
- 5.1 By Application
- 5.1.1 Network Security Analytics
- 5.1.2 Application Security Analytics
- 5.1.3 Web Security Analytics
- 5.1.4 Endpoint Security Analytics
- 5.1.5 Cloud Security Analytics
- 5.1.6 Insider Threat Analytics
- 5.2 By Deployment Mode
- 5.2.1 On-Premise
- 5.2.2 Cloud
- 5.2.3 Hybrid
- 5.3 By Organization Size
- 5.3.1 Large Enterprises
- 5.3.2 Small and Medium Enterprises
- 5.4 By End-user Industry
- 5.4.1 Banking and Financial Services
- 5.4.2 Healthcare
- 5.4.3 Defense and Security
- 5.4.4 Telecom and IT
- 5.4.5 Retail and E-Commerce
- 5.4.6 Manufacturing
- 5.4.7 Government
- 5.5 By Geography
- 5.5.1 North America
- 5.5.1.1 United States
- 5.5.1.2 Canada
- 5.5.1.3 Mexico
- 5.5.2 Europe
- 5.5.2.1 United Kingdom
- 5.5.2.2 Germany
- 5.5.2.3 France
- 5.5.2.4 Italy
- 5.5.2.5 Spain
- 5.5.2.6 Russia
- 5.5.2.7 Rest of Europe
- 5.5.3 Asia-Pacific
- 5.5.3.1 China
- 5.5.3.2 India
- 5.5.3.3 Japan
- 5.5.3.4 South Korea
- 5.5.3.5 Australia
- 5.5.3.6 Rest of Asia-Pacific
- 5.5.4 South America
- 5.5.4.1 Brazil
- 5.5.4.2 Argentina
- 5.5.4.3 Rest of South America
- 5.5.5 Middle East and Africa
- 5.5.5.1 Middle East
- 5.5.5.1.1 Saudi Arabia
- 5.5.5.1.2 United Arab Emirates
- 5.5.5.1.3 Turkey
- 5.5.5.1.4 Rest of Middle East
- 5.5.5.2 Africa
- 5.5.5.2.1 South Africa
- 5.5.5.2.2 Nigeria
- 5.5.5.2.3 Rest of Africa
- 5.5.1 North America
6 COMPETITIVE LANDSCAPE
- 6.1 Market Concentration
- 6.2 Strategic Moves
- 6.3 Market Share Analysis
- 6.4 Company Profiles (includes Global level Overview, Market level overview, Core Segments, Financials as available, Strategic Information, Market Rank/Share for key companies, Products and Services, and Recent Developments)
- 6.4.1 Alert Logic, Inc.
- 6.4.2 Arbor Networks, Inc. (NETSCOUT Systems, Inc.)
- 6.4.3 Broadcom Inc. (Symantec Enterprise Division)
- 6.4.4 Cisco Systems, Inc.
- 6.4.5 RSA Security LLC
- 6.4.6 Hewlett Packard Enterprise Company
- 6.4.7 International Business Machines Corporation
- 6.4.8 LogRhythm, Inc.
- 6.4.9 Mandiant, Inc.
- 6.4.10 Splunk Inc.
- 6.4.11 Fortinet, Inc.
- 6.4.12 McAfee, LLC
- 6.4.13 Micro Focus International plc
- 6.4.14 Securonix, Inc.
- 6.4.15 Exabeam, Inc.
- 6.4.16 Devo Technology, Inc.
- 6.4.17 Microsoft Corporation
- 6.4.18 Palo Alto Networks, Inc.
- 6.4.19 CrowdStrike Holdings, Inc.
- 6.4.20 Elastic N.V.
7 MARKET OPPORTUNITIES AND FUTURE OUTLOOK
- 7.1 White-space and Unmet-need Assessment
 安全分析市場:按組件、組織規模、分析類型和最終用途分類-2026-2032年全球市場預測
 安全分析市場規模、佔有率、趨勢和預測:按組件、應用、部署類型、企業規模、行業和地區分類,2026-2034 年
 2026年全球安全分析市場報告無人機法醫學調查市場:按組件、最終用戶、應用、產業垂直領域、部署模式和技術分類-全球預測,2026-2032年
 安全分析市場分析及預測(至 2035 年):按類型、產品類型、服務、技術、組件、應用、部署類型、最終用戶和解決方案分類
 2026-2030年全球安全分析市場日本安全分析市場報告:按組件、應用、部署類型、組織規模、產業和地區分類,2026-2034 年
 安全分析市場 - 全球產業規模、佔有率、趨勢、機會和預測(按組件、按部署模型、按應用、按地區和競爭細分,2020-2030 年預測)
 保全分析的全球市場:各零件,各用途,各部署模式,各終端用戶業界,各地區,機會,預測,2018年~2032年
 2032 年安全分析市場預測:按組件、部署類型、組織規模、應用程式、最終用戶和地區進行的全球分析