


 |
市場調查報告書
商品編碼
1851441
車隊管理解決方案:市場佔有率分析、產業趨勢、統計數據和成長預測(2025-2030 年)Fleet Management Solutions - Market Share Analysis, Industry Trends & Statistics, Growth Forecasts (2025 - 2030) |
||||||
※ 本網頁內容可能與最新版本有所差異。詳細情況請與我們聯繫。
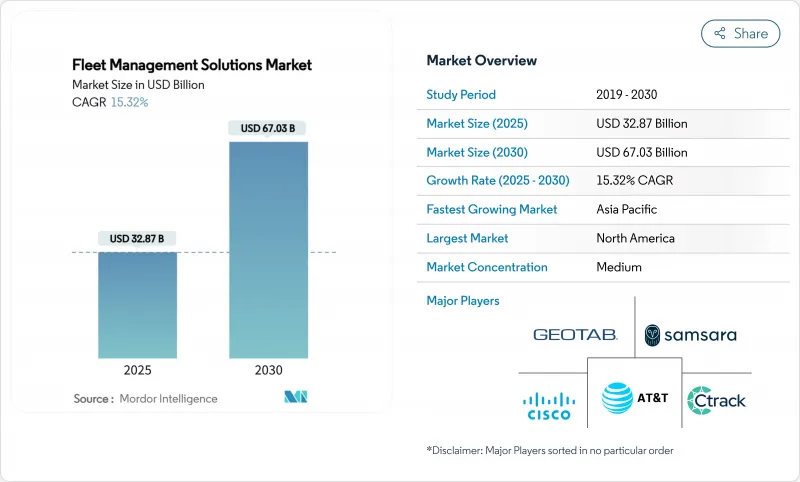
預計到 2025 年,車隊管理解決方案市場將創造 328.7 億美元的收入,到 2030 年將達到 670.3 億美元,複合年成長率高達 15.32%。
這項業績反映了日益嚴格的二氧化碳排放和電子日誌記錄強制規定、OEM嵌入式遠端資訊處理技術的普及以及5G的到來——5G支援低於10毫秒的即時調整延遲。隨著車隊最佳化路線、燃油消耗和預防性保養以提高利潤率,對互聯平台的投資已成為董事會層面的優先事項。將邊緣人工智慧與安全雲端服務結合的供應商正在擴大差距,從而在不損害資料主權的前提下實現預測分析。車隊管理解決方案市場也受益於基於使用量的保險夥伴關係,這種合作將更安全的駕駛與更低的保費掛鉤,形成自我強化的良性循環。半導體短缺和不斷變化的隱私法規抑制了成長前景,主要使缺乏多元化供應鏈和合規專業知識的新參與企業處於不利地位。
全球車隊管理解決方案市場趨勢與洞察
OEM嵌入式資訊系統的激增
到2023年,超過四分之三的新型輕型車輛將具備原生互聯功能,使用戶能夠直接存取引擎診斷、電池健康狀況以及進行無線軟體更新。但整合多個OEM廠商的資料饋送需要強大的標準化引擎和開放的API介面。已與超過150家製造商完成整合的供應商,透過幫助客戶節省售後硬體成本並解鎖更豐富的預測性維護模型,正在贏得市場佔有率。
5G 和 NB-IoT 部署可降低延遲
毫秒級以下的連結使負責人能夠在擁塞顯現之前更新密集都市區道路的路線,從而減少15-20%的燃油消耗。車輛上的邊緣運算模組現在可以執行人工智慧視覺功能,在本地標記急煞車和偏離車道事件,並將異常情況發送到雲端。使用5G技術的智慧電錶可以即時中繼故障數據,加快停電後的恢復速度。
聯網車隊面臨的網路勒索軟體風險
2017年至2022年間,針對交通運輸網路的攻擊將增加四倍,導致即時資產位置暴露,車輛被鎖定直至支付贖金。中型運輸公司通常使用過時的維護軟體,且缺乏多因素身份驗證,這擴大了其面臨的威脅面。產業組織目前建議在所有遠端資訊處理閘道器上採用零信任架構和端點檢測。
細分市場分析
混合架構正以 20.4% 的複合年成長率成長,這主要得益於其能夠在高峰期利用彈性雲分析的同時,將敏感的營運資料保留在本地。到 2024 年,基於雲端的車隊管理解決方案將佔據 63% 的市場佔有率,但出於合規性考慮的買家(例如國防機構)仍然需要本地伺服器。供應商正在捆綁邊緣閘道器,這些閘道器僅同步異常事件,從而降低漫遊費用並支援低頻寬區域的運作。案例研究證實,混合架構在滿足資料保留法規的同時,降低了緊急應變期間的延遲。
這種發展勢頭源於純雲端部署中汲取的經驗教訓,在純雲端部署中,網路連線中斷會導致電子日誌記錄 (ELD) 日誌出現缺失。現在,供應商正在將關鍵規則集預先載入到邊緣裝置上,即使網路連線降至 2G,也能確保駕駛員保持合規。網路連線恢復後,快取的記錄會自動同步。這種模式正在重新定義架構:雲端成為分析核心,邊緣成為合規衛士,而本地設備則確保系統主權。
車輛追蹤仍然是收入支柱,佔比高達 27.5%,但市場需求正轉向分析和彙報,該領域正以每年 18.1% 的速度成長。如今,儀表板會根據安全評分對駕駛員進行排名,並利用機器學習技術預測煞車皮壽命。車隊管理解決方案市場透過自動化指導、燃油稅調整和基於人工智慧的貨物監控等附加元件模組獲得高利潤。將這些洞察與開放 API 打包的供應商正在將單次銷售轉化為多年平台合約。
專業化趨勢日益明顯。一家供應商專注於都市區貨運的低矮橋樑避障技術,而另一家則專注於為歐洲營運商提供煞車性能監測。這種垂直細分正在取代通用的「地圖上的點」式平台。一份報告指出,自從引入連網駕駛員培訓以來,安全事故減少了35%,該培訓將遠端資訊處理數據轉化為微學習影片。
車隊管理解決方案市場報告按部署類型(本地部署、雲端部署、其他)、解決方案類型(資產/車輛追蹤、駕駛員管理和安全、其他)、車輛類型(重型卡車(超過 3.5 噸)、巴士和長途客車、其他)、車隊規模(少於 50 輛車、50-199公共產業、其他)、最終用戶產業
區域分析
北美地區在車隊管理解決方案市場佔據36%的佔有率,主要得益於強制性電子日誌和成熟的行動電話網路。隨著貨運公司因違反營運時間規定而面臨越來越高的處罰,遠端資訊處理已成為必不可少的環節。美國、加拿大和墨西哥之間的跨境營運推動了對統一合規儀表板的需求。此外,該地區還面臨日益嚴重的勒索軟體威脅,促使企業加強對終端安全模組的投資。
亞太地區以15.4%的複合年成長率呈現最高增速。中國的智慧城市試點計畫正在將遠端資訊處理數據整合到交通指揮中心,從而實現優先通行電動貨車的綠燈訊號。在印度,電商企業正在部署路線最佳化器,以緩解交通堵塞並縮短配送時間。澳洲和紐西蘭現已要求重型車輛使用通訊記錄儀,預計2028年,總安裝量將達到270萬台。東南亞部分地區的網路覆蓋分散,促使人們採用混合邊緣雲端-雲模式,在4G網路不可用時進行資料緩衝。
歐洲在歐盟2040年二氧化碳減量目標的後期階段維持了穩定的能源需求。與排放等級掛鉤的基於里程的收費方式迫使車隊即時測量和報告燃油強度,使數據分析成為調度的核心。 GDPR強化了隱私設計架構,並獎勵傳輸過程中採用加密技術的供應商。一家英國物流公司利用人工智慧將遠端資訊處理行程數據與載重係數結合,減少了5萬噸二氧化碳排放。東歐高昂的行動電話費用給實施帶來了挑戰,但共用服務模式正在興起。
其他福利:
- Excel格式的市場預測(ME)表
- 3個月的分析師支持
目錄
第1章 引言
- 研究假設和市場定義
- 調查範圍
第2章調查方法
第3章執行摘要
第4章 市場情勢
- 市場概覽
- 市場促進因素
- OEM嵌入式資訊系統的激增
- 5G 和 NB-IoT 部署可降低延遲
- 基於使用量的保險夥伴關係
- 更嚴格的當地二氧化碳/排放控制規定
- 邊緣人工智慧助力預測性維護
- 商用無人機機隊創造鄰近性
- 市場限制
- 聯網車隊面臨的網路勒索軟體風險
- 監管資料共用規則碎片化
- 反對個人資訊保護
- 碳化矽功率電子元件供電瓶頸
- 價值鏈分析
- 監管環境
- 技術展望
- 波特五力分析
- 供應商的議價能力
- 買方的議價能力
- 新進入者的威脅
- 替代品的威脅
- 競爭對手之間的競爭
- 半導體短缺的影響
第5章 市場規模與成長預測
- 按部署模式
- 本地部署
- 雲(SaaS)
- 混合
- 按解決方案類型
- 資產/車輛追蹤
- 駕駛員管理與安全
- 營運與調度
- 燃油和路線最佳化
- 合規與風險
- 分析與報告
- 按車輛類型
- 輕型商用車(小於3.5噸)
- 大型卡車(超過3.5噸)
- 公車和長途客車
- 拖車/拖車
- 非公路及施工機械
- 按車隊規模
- 少於50個單位
- 50-199個單位
- 200-999個單元
- 超過1000台
- 按最終用戶行業分類
- 運輸與物流
- 能源與公共產業
- 建築和採礦
- 製造和零售分銷
- 政府/公共
- 其他(租賃、廢棄物管理)
- 按地區
- 北美洲
- 美國
- 加拿大
- 墨西哥
- 南美洲
- 巴西
- 阿根廷
- 歐洲
- 德國
- 英國
- 法國
- 西班牙
- 義大利
- 俄羅斯
- 亞太地區
- 中國
- 印度
- 日本
- 韓國
- ASEAN
- 亞太其他地區
- 中東和非洲
- 中東
- 沙烏地阿拉伯
- 阿拉伯聯合大公國
- 土耳其
- 非洲
- 南非
- 奈及利亞
- 埃及
- 北美洲
第6章 競爭情勢
- 市場集中度
- 策略性舉措(合資企業/合資企業)
- 市佔率分析
- 公司簡介
- AT&T Inc.
- Cisco Systems Inc.
- Geotab Inc.
- Verizon Communications Inc.(Verizon Connect)
- Trimble Inc.
- Omnitracs LLC
- Samsara Inc.
- MiX Telematics
- TomTom NV
- Ctrack(Inseego)
- KeepTruckin(Motive)
- Fleet Complete
- Donlen(Hertz)
- Azuga Inc.
- Chevin Fleet Solutions
- Octo Telematics
- Tenna LLC
- Odoo SA
- Rarestep Inc.(Fleetio)
- One Step GPS
- Advance Tracking Technologies
- Astrata Group
- Switchboard Inc.
- Transflo
- Go Fleet
- Wheels Inc.
- ID Systems(PowerFleet)
- Others(white-listed)
第7章 市場機會與未來展望
The fleet management solutions market generated USD 32.87 billion in 2025 and is forecast to climb to USD 67.03 billion by 2030, advancing at a robust 15.32% CAGR.
This performance reflects tightening CO2 and electronic logging mandates, the spread of OEM-embedded telematics, and the arrival of 5G that supports sub-10 millisecond latency for real-time coordination. Margins improve when fleets optimize routes, fuel consumption, and preventive maintenance, so investment in connected platforms has become a board-level priority. Vendors that combine edge AI with secure cloud services are widening the gap because they permit predictive analytics without compromising data sovereignty. The fleet management solutions market also benefits from usage-based insurance partnerships that translate safer driving into premium reductions, creating a self-reinforcing adoption cycle. Semiconductor shortages and evolving privacy rules temper the growth outlook but primarily disadvantage newcomers that lack diversified supply chains and compliance expertise.
Global Fleet Management Solutions Market Trends and Insights
Rapid rise in OEM-embedded telematics
More than three-quarters of new light vehicles shipped with native connectivity in 2023, giving operators direct access to engine diagnostics, battery health, and over-the-air software updates. Blending multiple OEM data feeds, however, demands powerful normalization engines and open APIs. Providers that already integrate across 150-plus makes are gaining wallet share because they spare customers the cost of aftermarket hardware while unlocking richer predictive maintenance models.
5G and NB-IoT rollout lowering latency
Sub-10 millisecond links allow dispatchers to update routes in dense urban corridors before congestion materializes, trimming fuel use by 15-20%. Edge computing modules on the vehicle now run AI vision that flags hard-braking or lane-departure events locally, sending only exceptions to the cloud, which lowers bandwidth charges and speeds driver coaching. Utility fleets illustrate the benefit: smart meters using 5G relay fault data in real time, accelerating outage restoration.
Cyber-ransomware risk on connected fleets
Attacks against transport networks quadrupled between 2017 and 2022, exposing real-time asset locations and immobilizing vehicles until ransoms are paid. Mid-sized carriers often run outdated maintenance software that lacks multifactor authentication, widening the threat surface. Industry associations now recommend zero-trust architectures and endpoint detection on every telematics gateway.
Other drivers and restraints analyzed in the detailed report include:
- Usage-based insurance partnerships
- Stricter CO2 / ELD mandates
- Fragmented regulatory data-sharing rules
For complete list of drivers and restraints, kindly check the Table Of Contents.
Segment Analysis
Hybrid architectures are rising at 20.4% CAGR because they keep sensitive operations data on-premises while tapping elastic cloud analytics during peak demand. The fleet management solutions market size for cloud deployments reached 63% share in 2024, but compliance-driven buyers such as defense agencies still require on-site servers. Suppliers bundle edge gateways that sync only exception events, cutting roaming charges and supporting operations in low-bandwidth geographies. Case studies in government electric vehicle programs confirm that hybrid stacks reduce latency for emergency response while meeting data residency statutes.
Adoption momentum stems from lessons learned in pure-cloud rollouts where connection drops led to gaps in ELD logs. Vendors now pre-load critical rulesets on edge devices, letting drivers stay compliant even if coverage falls to 2G. Once connectivity resumes, cached records synchronize automatically. This pattern is redefining architectures: cloud stays the analytics brain, edge becomes the compliance guard, and on-prem appliances assure sovereignty.
Vehicle tracking remains the revenue anchor at 27.5% share, but demand is shifting toward analytics and reporting that grow 18.1% a year. Dashboards now rank drivers by safety score and project brake-pad life using machine learning. The fleet management solutions market generates higher margins from add-on modules such as automated coaching, fuel tax reconciliation, and AI-based cargo monitoring. Providers that package these insights with open APIs convert single-product sales into multi-year platform contracts.
Specialization is intensifying. Some vendors focus on low-bridge avoidance for urban freight, others on brake-performance monitoring for European operators. This vertical depth is displacing generic "dots-on-a-map" platforms. Early adopters report 35% cuts in safety incidents after rolling out connected driver training that translates telematics data into micro-learning videos.
The Fleet Management Solutions Market Report is Segmented by Deployment Type (On-Premises, Cloud, and More), Solution Type (Asset / Vehicle Tracking, Driver Management and Safety, and More), Vehicle Type (Heavy Trucks (above 3. 5 T), Buses and Coaches, and More), Fleet Size (less Than 50 Vehicles, 50-199 Vehicles, and More), End-User Industry (Transportation and Logistics, Energy and Utilities, and More), and Geography.
Geography Analysis
North America retains 36% share of the fleet management solutions market, bolstered by enforced electronic logs and mature cellular networks. Carriers face stiffer penalties for hours-of-service violations, so telematics is non-negotiable. Insurers reward safe-driving records captured via video AI, and cross-border operations between the United States, Canada, and Mexico elevate demand for unified compliance dashboards. The region also sees higher ransomware exposure, motivating investments in endpoint security modules.
Asia Pacific exhibits the highest growth at 15.4% CAGR. China's smart-city pilots embed telematics feeds into traffic command centers, enabling green-wave signals that favor electric delivery vans. In India, e-commerce boomers deploy route optimizers to tame congestion and shrink delivery windows. Australia and New Zealand now require electronic work diaries for heavy vehicles, lifting total installed units to an expected 2.7 million by 2028. Fragmented telecom coverage in parts of Southeast Asia pushes hybrid edge-cloud models that buffer data when 4G is unavailable.
Europe records steady demand behind the EU's 2040 CO2 targets. Distance-based tolling tied to emission classes forces fleets to measure and report real-time fuel intensity, putting analytics at the heart of dispatch. GDPR elevates privacy-by-design architectures, rewarding vendors that encrypt at rest and in transit. A UK logistics firm trimmed 50,000 tonnes of CO2 by using AI to blend telematics trip data with load factors, underscoring how sustainability mandates intersect with profitability. Adoption challenges persist in Eastern Europe where cellular tariffs remain high, but shared-services models are emerging.
- AT&T Inc.
- Cisco Systems Inc.
- Geotab Inc.
- Verizon Communications Inc. (Verizon Connect)
- Trimble Inc.
- Omnitracs LLC
- Samsara Inc.
- MiX Telematics
- TomTom N.V.
- Ctrack (Inseego)
- KeepTruckin (Motive)
- Fleet Complete
- Donlen (Hertz)
- Azuga Inc.
- Chevin Fleet Solutions
- Octo Telematics
- Tenna LLC
- Odoo SA
- Rarestep Inc. (Fleetio)
- One Step GPS
- Advance Tracking Technologies
- Astrata Group
- Switchboard Inc.
- Transflo
- Go Fleet
- Wheels Inc.
- I.D. Systems (PowerFleet)
- Others (white-listed)
Additional Benefits:
- The market estimate (ME) sheet in Excel format
- 3 months of analyst support
TABLE OF CONTENTS
1 INTRODUCTION
- 1.1 Study Assumptions and Market Definition
- 1.2 Scope of the Study
2 RESEARCH METHODOLOGY
3 EXECUTIVE SUMMARY
4 MARKET LANDSCAPE
- 4.1 Market Overview
- 4.2 Market Drivers
- 4.2.1 Rapid rise in OEM-embedded telematics
- 4.2.2 5G and NB-IoT rollout lowering latency
- 4.2.3 Usage-based insurance partnerships
- 4.2.4 Stricter regional CO? / ELD mandates
- 4.2.5 Edge-AI enabling predictive maintenance
- 4.2.6 Commercial drone fleets creating adjacency
- 4.3 Market Restraints
- 4.3.1 Cyber-ransomware risk on connected fleets
- 4.3.2 Fragmented regulatory data-sharing rules
- 4.3.3 Driver privacy backlash (under-reported)
- 4.3.4 Silicon carbide power electronics supply bottlenecks
- 4.4 Value Chain Analysis
- 4.5 Regulatory Landscape
- 4.6 Technological Outlook
- 4.7 Porter's Five Forces Analysis
- 4.7.1 Bargaining Power of Suppliers
- 4.7.2 Bargaining Power of Buyers
- 4.7.3 Threat of New Entrants
- 4.7.4 Threat of Substitutes
- 4.7.5 Competitive Rivalry
- 4.8 Impact of Semiconductor Shortage
5 MARKET SIZE AND GROWTH FORECASTS (VALUE)
- 5.1 By Deployment Model
- 5.1.1 On-Premise
- 5.1.2 Cloud (SaaS)
- 5.1.3 Hybrid
- 5.2 By Solution Type
- 5.2.1 Asset / Vehicle Tracking
- 5.2.2 Driver Management and Safety
- 5.2.3 Operations and Dispatch
- 5.2.4 Fuel and Route Optimization
- 5.2.5 Compliance and Risk
- 5.2.6 Analytics and Reporting
- 5.3 By Vehicle Type
- 5.3.1 Light Commercial Vehicles (less than 3.5 t)
- 5.3.2 Heavy Trucks (above 3.5 t)
- 5.3.3 Buses and Coaches
- 5.3.4 Trailers / Semi-trailers
- 5.3.5 Off-highway and Construction Equipment
- 5.4 By Fleet Size
- 5.4.1 less than 50 Vehicles
- 5.4.2 50-199 Vehicles
- 5.4.3 200-999 Vehicles
- 5.4.4 above or equal to 1,000 Vehicles
- 5.5 By End-User Industry
- 5.5.1 Transportation and Logistics
- 5.5.2 Energy and Utilities
- 5.5.3 Construction and Mining
- 5.5.4 Manufacturing and Retail Distribution
- 5.5.5 Government and Public Safety
- 5.5.6 Others (Rental, Waste Mgmt.)
- 5.6 By Geography
- 5.6.1 North America
- 5.6.1.1 United States
- 5.6.1.2 Canada
- 5.6.1.3 Mexico
- 5.6.2 South America
- 5.6.2.1 Brazil
- 5.6.2.2 Argentina
- 5.6.3 Europe
- 5.6.3.1 Germany
- 5.6.3.2 United Kingdom
- 5.6.3.3 France
- 5.6.3.4 Spain
- 5.6.3.5 Italy
- 5.6.3.6 Russia
- 5.6.4 Asia Pacific
- 5.6.4.1 China
- 5.6.4.2 India
- 5.6.4.3 Japan
- 5.6.4.4 South Korea
- 5.6.4.5 ASEAN
- 5.6.4.6 Rest of Asia Pacific
- 5.6.5 Middle East and Africa
- 5.6.5.1 Middle East
- 5.6.5.1.1 Saudi Arabia
- 5.6.5.1.2 UAE
- 5.6.5.1.3 Turkey
- 5.6.5.2 Africa
- 5.6.5.2.1 South Africa
- 5.6.5.2.2 Nigeria
- 5.6.5.2.3 Egypt
- 5.6.1 North America
6 COMPETITIVE LANDSCAPE
- 6.1 Market Concentration
- 6.2 Strategic Moves (MandA / JVs)
- 6.3 Market Share Analysis
- 6.4 Company Profiles (includes Global level Overview, Market level overview, Core Segments, Financials as available, Strategic Information, Market Rank/Share for key companies, Products and Services, and Recent Developments)
- 6.4.1 AT&T Inc.
- 6.4.2 Cisco Systems Inc.
- 6.4.3 Geotab Inc.
- 6.4.4 Verizon Communications Inc. (Verizon Connect)
- 6.4.5 Trimble Inc.
- 6.4.6 Omnitracs LLC
- 6.4.7 Samsara Inc.
- 6.4.8 MiX Telematics
- 6.4.9 TomTom N.V.
- 6.4.10 Ctrack (Inseego)
- 6.4.11 KeepTruckin (Motive)
- 6.4.12 Fleet Complete
- 6.4.13 Donlen (Hertz)
- 6.4.14 Azuga Inc.
- 6.4.15 Chevin Fleet Solutions
- 6.4.16 Octo Telematics
- 6.4.17 Tenna LLC
- 6.4.18 Odoo SA
- 6.4.19 Rarestep Inc. (Fleetio)
- 6.4.20 One Step GPS
- 6.4.21 Advance Tracking Technologies
- 6.4.22 Astrata Group
- 6.4.23 Switchboard Inc.
- 6.4.24 Transflo
- 6.4.25 Go Fleet
- 6.4.26 Wheels Inc.
- 6.4.27 I.D. Systems (PowerFleet)
- 6.4.28 Others (white-listed)
7 MARKET OPPORTUNITIES AND FUTURE OUTLOOK
- 7.1 White-space and Unmet-need Assessment
 車隊管理的北美市場 - 第15版
 車隊管理市場:2035年前的產業趨勢和全球預測 - 各元件類型,各車隊類型,各部署類型,各終端用戶類型,各地區
 按動力類型、車輛等級、應用和所有權模式分類的乘用車車隊管理市場-全球預測,2025-2032年車隊管理系統市場按解決方案類型、車輛類型、車隊規模、應用、部署方法和最終用戶行業分類 - 全球預測 2025-2032
 2025年全球施工機械車隊管理軟體市場報告2025年車隊管理全球市場報告
 車隊充電市場,按類型、按安裝類型、按最終用戶、按國家和地區 - 2025 年至 2032 年全球行業分析、市場規模、市場佔有率和預測2025年電動車隊管理全球市場報告機器人車隊管理軟體市場(按機器人類型、部署類型、應用和最終用途)—2025-2030 年全球預測
 全球施工機械車隊管理軟體市場