


 |
市場調查報告書
商品編碼
1851402
雲端儲存:市場佔有率分析、行業趨勢、統計數據和成長預測(2025-2030 年)Cloud Storage - Market Share Analysis, Industry Trends & Statistics, Growth Forecasts (2025 - 2030) |
||||||
※ 本網頁內容可能與最新版本有所差異。詳細情況請與我們聯繫。
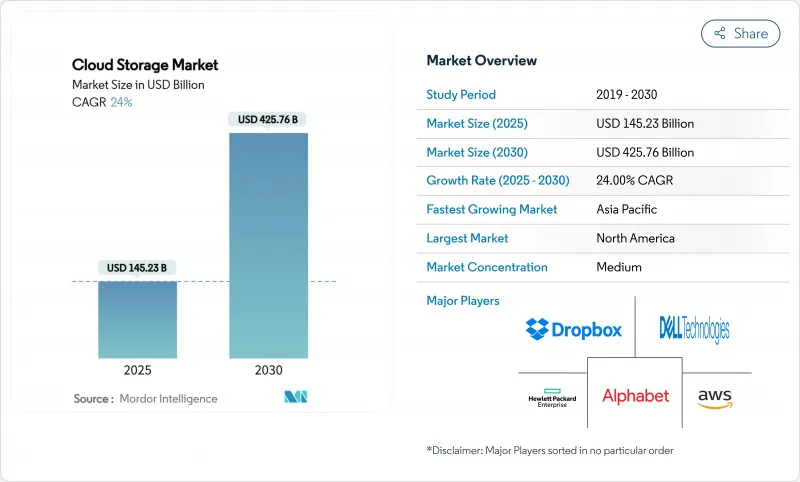
預計到 2025 年,雲端儲存市場規模將達到 1,452.3 億美元,到 2030 年將達到 4,257.6 億美元,複合年成長率為 24.0%。
生成式人工智慧的普及、資料主權要求以及對現代化、節能基礎設施的需求,正在加速企業遷移,並重塑全球儲存架構。超大規模資料中心投資的活性化、亞太地區主權雲端支出的增加以及中小企業的穩定採用,正在擴大全球潛在用戶群,而與通膨掛鉤的建設成本則推動了低功耗技術的創新。物件儲存主導人工智慧工作負載,混合部署成長最快,亞太地區引領著區域擴張。尋求人工智慧最佳化容量、主權雲端區域和碳感知服務的供應商之間的競爭仍然激烈。
全球雲端儲存市場趨勢與洞察
知識工作者應用中由生成式人工智慧主導的資料爆炸(2025 年及以後)
生成式人工智慧工作負載正推動企業資料量呈現數量級成長。由於機械硬碟難以滿足延遲目標,人工智慧訓練環境對固態硬碟的需求正以每年 35% 的速度成長。單次訓練運行的儲存佔用量將從 2025 年的 30TB 成長到 2030 年的 100TB,而隨著新產品整合人工智慧功能,推理節點的成長速度將更快。成本模型顯示,資料處理成本超過了模型開發成本,迫使供應商最佳化分層和壓縮策略。超大規模資料中心正在重新設計其儲存層,採用高吞吐量的非揮發性記憶體叢集和針對並行存取最佳化的物件儲存桶。
加速媒體和遊戲產業的邊緣到雲端工作流程
媒體和遊戲工作室正在採用雲端優先的流程。隨著串流媒體和即時渲染的擴展,97% 的工作室計劃在 2025 年增加儲存預算。雲端遊戲以 44% 的複合年成長率成長,需要分散式快取來維持跨區域的延遲低於 50 毫秒。然而,這些公司將 51% 的儲存預算用於 API 呼叫和外部流量,這促使他們採用多重雲端部署以避免額外費用。預計到 2024 年,邊緣運算投資將達到 2,320 億美元,服務供應商正在整合本地閘道器和超大規模歸檔,以實現無縫的資產流。
數據主權問題持續複雜化
從美國的《雲端法案》到中國的跨境資料流動規則,各種不同的法規迫使企業採用分散的儲存佈局,並複製資料集以符合當地法律法規。法律的不確定性增加了遵循成本,並減緩了企業在全球擴張的步伐,因為企業需要應對重疊的司法管轄權主張。
細分市場分析
2024年,公共雲端將以59.0%的營收成長引領該領域,但隨著資料居住法規的日益嚴格,混合架構到2030年將以26.01%的複合年成長率成長。企業正在將本地節點與公有雲的可擴展性相結合,以滿足延遲和合規性目標。政府主權框架進一步推動了混合雲的需求,而邊緣投資則將微區域納入整合的資源池。目前,混合環境管理著82%的企業工作負載,顯示企業正從完全依賴公有雲的策略轉向混合雲。
第二個成長動力來自人工智慧訓練集群,這類集群需要本地GPU相鄰以實現高吞吐量,但可以透過雲端爆發來應對峰值需求。企業採用控制平面軟體來編配跨站點的策略,從而降低廠商鎖定風險並最佳化成本。供應商透過整合可觀測性、自動化資料分層和市場生態系統來脫穎而出。隨著預算重新分配的持續進行,雲端儲存市場可能會出現部署模式的整合,最終形成一個涵蓋核心區、邊緣區和主權區的靈活、策略主導的架構。
隨著非結構化資料的爆炸性成長,物件儲存庫的營收將在2024年成長51.2%,並在2030年之前維持在25.0%的成長率。物件平台雲端儲存市場規模受益於其固有的可擴展性、豐富的元資料以及糾刪碼的經濟性,這些優勢與生成式人工智慧語料庫的需求相契合。文件層和區塊層將繼續用於傳統工作負載和聯機事務處理(OLTP)工作負載,並將部分佔有率讓給物件層,後者經過強化,可支援Petabyte級並行存取。
創新主要圍繞著多租戶命名空間隔離、內聯加密以及無需預處理即可直接向訓練節點提供資料的GPU直連流水線。美光部署32TB NVMe SSD,凸顯了該公司向基於快閃記憶體的物件叢集轉型的決心。專利申請揭示了糾刪碼快取和分散式雜湊索引的進步,從而提升了效能和持久性。隨著人工智慧應用的不斷擴展,物件儲存很可能成為雲端儲存市場中內容、模型查核點和向量資料庫的基礎。
雲端儲存市場報告按部署模式(私有雲端、公共雲端、其他)、儲存類型(文件儲存、物件儲存、其他)、公司規模(中小企業、大型企業)、應用程式(備份和復原、應用管理、其他)、最終用戶垂直行業(銀行、金融服務和保險、製造業、零售業、電子商務、其他)和地區進行細分。
區域分析
受超大規模資料中心總部需求和人工智慧早期應用的推動,北美地區將佔2024年總營收的38.0%。資料中心電力需求預計到2028年將以每年16%的速度成長,但輸電瓶頸和授權延誤正在影響成長速度。擬議的法規,例如雲端客戶身份驗證(KYC),可能會擾亂跨境工作流程,並促使企業轉向多區域架構。硬體短缺會不時限制產能,但持續的投資將使其在創新和支出方面保持領先地位。
亞太地區是成長引擎,在政府數位化計畫、主權雲端政策以及人工智慧應用日益普及的推動下,年複合成長率高達24.98%。預計到2025年,中國在雲端領域的支出將達到460億美元,主要得益於本土供應商和政策支援。印度的服務市場規模將在2024年上半年達到52億美元,並爭取2028年達到255億美元。澳洲和日本正在推動區域性框架建設,同時建構居住合規區,區域資料中心容量的年複合成長率將達到13.3%。
在GDPR的推動下,歐洲正穩步發展,各行各業都在積極採用加密和資料最小化技術。巴西、墨西哥和智利正在吸引超大規模資料中心營運商的投資,而拉丁美洲的託管資料中心專案規模到2029年預計將達到100億美元。非洲的需求正以每年25%至30%的速度成長,但在全球收入中所佔比例不到1%。本地服務供應商正透過價格和貨幣彈性來提升自身競爭力。這些動態共同建構了一個多極化的市場,在這個市場中,區域生態系統與全球互聯互通並存。
其他福利:
- Excel格式的市場預測(ME)表
- 3個月的分析師支持
目錄
第1章 引言
- 研究假設和市場定義
- 調查範圍
第2章調查方法
第3章執行摘要
第4章 市場情勢
- 市場概覽
- 宏觀經濟影響評估
- 市場促進因素
- 提高各組織機構的雲端採用率
- 對低成本、高速儲存存取的需求日益成長
- 加速媒體和遊戲產業的邊緣到雲端工作流程
- 人工智慧時代將主導知識工作者應用程式的數據爆炸性成長(2025年及以後)。
- 政府對主權雲框架的獎勵策略
- ESG主導的儲存最佳化和碳感知工作負載
- 市場限制
- 數據主權問題的複雜性依然存在
- 民眾對出境費的抗拒情緒日益高漲,以及供應商鎖定風險。
- 多重雲端資料蔓延造成安全漏洞
- 邊遠市場的最後一公里頻寬限制
- 價值鏈分析
- 監管環境
- 技術展望
- 波特五力分析
- 新進入者的威脅
- 供應商的議價能力
- 買方的議價能力
- 替代品的威脅
- 產業間競爭
- 投資分析
第5章 市場規模與成長預測
- 透過部署模式
- 私有雲端
- 公有雲
- 混合雲
- 依儲存類型
- 文件儲存
- 物件儲存
- 區塊儲存
- 按公司規模
- 小型企業
- 主要企業
- 透過使用
- 備份和復原
- 資料管理與歸檔
- 應用程式管理
- 協作與內容服務
- 按最終用戶行業分類
- BFSI
- 醫療保健與生命科學
- 政府和公共機構
- 製造業
- 零售與電子商務
- 資訊科技和電訊
- 媒體與娛樂
- 其他
- 按地區
- 北美洲
- 美國
- 加拿大
- 墨西哥
- 南美洲
- 巴西
- 阿根廷
- 歐洲
- 德國
- 英國
- 法國
- 俄羅斯
- 亞太地區
- 中國
- 印度
- 日本
- 韓國
- ASEAN
- 亞太其他地區
- 中東和非洲
- 中東
- 沙烏地阿拉伯
- 土耳其
- 非洲
- 南非
- 北美洲
第6章 競爭情勢
- 市場集中度
- 策略趨勢
- 市佔率分析
- 公司簡介
- Amazon Web Services Inc.
- Microsoft Corporation
- Google LLC(Alphabet)
- Alibaba Cloud(Alibaba Group)
- IBM Corporation
- Oracle Corporation
- Dell Technologies Inc.
- Hewlett Packard Enterprise
- NetApp Inc.
- Dropbox Inc.
- Box Inc.
- Wasabi Technologies
- Backblaze Inc.
- Tencent Cloud
- OVHcloud
- Rackspace Technology
- Hitachi Vantara
- Fujitsu Limited
- pCloud AG
- Tresorit AG
- Iron Mountain
第7章 市場機會與未來展望
The cloud storage market size reached USD 145.23 billion in 2025 and is forecast to reach USD 425.76 billion by 2030 at a 24.0% CAGR.
Generative-AI adoption, data-sovereignty mandates, and the need for modern, energy-efficient infrastructure are accelerating enterprise migration and reshaping storage architectures worldwide. Intensifying hyperscaler investment, rising sovereign-cloud spend across Asia Pacific, and steady SME adoption are widening the global addressable base while inflation-linked construction costs spur innovation in low-power technologies. Object storage dominates AI workloads, hybrid deployment grows fastest, and Asia Pacific leads regional expansion. Competitive rivalry remains high as providers pursue AI-optimized capacity, sovereign-cloud zones, and carbon-aware services.
Global Cloud Storage Market Trends and Insights
Gen-AI-led data explosion in knowledge-worker apps (2025+)
Generative-AI workloads are multiplying enterprise data volumes by an order of magnitude. Solid-state drive demand for AI training environments is climbing 35% per year as spinning disks struggle to meet latency targets. Storage footprints for single training runs are set to scale from 30 TB in 2025 to 100 TB by 2030, while inference nodes grow even faster as new products embed AI features. Cost models now reveal that data-handling charges eclipse model-development expenses, pushing vendors to optimize tiering and compression. Hyperscalers are redesigning storage layers to favor high-throughput NVM-based clusters and object storage buckets tuned for parallel access.
Edge-to-cloud workflow acceleration in media and gaming
Media and gaming studios are embracing cloud-first pipelines; 97% plan to raise storage budgets in 2025 as streaming and real-time rendering expand. Cloud gaming's 44% CAGR requires distributed caches that maintain <50 ms latency across regions. Yet, these firms spend 51% of storage budgets on API calls and egress traffic, catalyzing multi-cloud placement to avoid fees. Edge-compute spend is forecast at USD 232 billion in 2024, pushing providers to integrate on-premise gateways with hyperscale archives for seamless asset flows.
Persistent data-sovereignty complexity
Divergent regulations-from the U.S. CLOUD Act to China's cross-border flow rules-force organizations to operate fragmented storage footprints and duplicate datasets to meet local statutes. Legal uncertainty raises compliance spend and slows global rollouts as firms navigate overlapping jurisdictional claims.
Other drivers and restraints analyzed in the detailed report include:
- Government stimulus for sovereign cloud frameworks
- ESG-driven storage optimization and carbon-aware workloads
- Escalating egress-fee backlash and vendor lock-in risk
For complete list of drivers and restraints, kindly check the Table Of Contents.
Segment Analysis
The segment's revenue in 2024 reflected a 59.0% public-cloud lead, yet hybrid architectures are on track for a 26.01% CAGR to 2030 as data residency laws tighten. Enterprises blend on-premise nodes with public scalability to meet latency and compliance goals. Governments' sovereign frameworks further propel hybrid demand, while edge investments embed micro-regions into unified pools. Hybrid environments now manage 82% of enterprise workloads, validating the shift away from all-public strategies.
A second growth vector lies in AI training clusters that require local GPU adjacency for throughput yet still need cloud bursts for spikes. Organizations adopt control-plane software to orchestrate policies across sites, mitigating lock-in and optimizing cost. Vendors differentiate via integrated observability, automated data-tiering, and marketplace ecosystems. As budgets reallocate, the cloud storage market will see deployment models converge into fluid, policy-driven fabrics spanning core, edge, and sovereign zones.
Object repositories generated 51.2% revenue in 2024 and will compound at 25.0% through 2030 as unstructured data explodes. The cloud storage market size for object platforms benefits from intrinsic scalability, rich metadata, and erasure-coding economics that align with generative-AI corpus needs. File and block tiers persist for legacy and OLTP workloads but cede share to object layers hardened for petabyte-scale parallel access.
Innovation centers on multi-tenant namespace isolation, in-line encryption, and GPU-direct pipelines that feed training nodes without staging. Micron's roll-out of 32 TB NVMe SSDs underscores the migration toward flash-based object clusters. Patent filings reveal advances in erasure-coded caching and distributed-hash indexing, amplifying performance and durability. As AI adoption broadens, object storage will underpin content, model checkpoints, and vector databases within the cloud storage market.
The Cloud Storage Market Report is Segmented by Deployment Mode (Private Cloud, Public Cloud, and More), Storage Type (File Storage, Object Storage, and More), Enterprise Size (SMEs and Large Enterprises), Application (Backup and Recovery, Application Management, and More), End-User Industry (BFSI, Manufacturing, Retail and E-Commerce, and More), and Geography.
Geography Analysis
North America held 38.0% revenue in 2024 as hyperscaler headquarters and early AI adoption drove demand. Data-center power needs are on a 16% annual trajectory to 2028, though transmission bottlenecks and permitting delays pressure timelines. Regulatory proposals such as cloud know-your-customer (KYC) checks may fragment cross-border workflows, nudging enterprises toward multi-region architectures. Hardware shortages intermittently constrain capacity, but continuous investment sustains leadership in innovation and spend.
Asia Pacific is the growth engine, charting a 24.98% CAGR courtesy of government digitization programs, sovereign-cloud mandates, and rising AI adoption. China's spending will hit USD 46 billion in 2025, buoyed by local vendors and policy support. India's services market reached USD 5.2 billion in H1 2024 and targets USD 25.5 billion by 2028. Australia and Japan advance localized frameworks, while a 13.3% CAGR in regional data-center capacity underscores the build-out of residency-compliant zones.
Europe grows steadily under GDPR, with sectoral codes pushing encryption and data-minimization features. Latin America's colocation pipeline could reach USD 10 billion by 2029 as Brazil, Mexico, and Chile court hyperscaler investment. Africa's demand rises 25-30% annually, yet represents <1% global revenue; local providers differentiate on price and currency flexibility. These dynamics confirm a multipolar cloud storage market where regional ecosystems coexist with global connectivity.
- Amazon Web Services Inc.
- Microsoft Corporation
- Google LLC (Alphabet)
- Alibaba Cloud (Alibaba Group)
- IBM Corporation
- Oracle Corporation
- Dell Technologies Inc.
- Hewlett Packard Enterprise
- NetApp Inc.
- Dropbox Inc.
- Box Inc.
- Wasabi Technologies
- Backblaze Inc.
- Tencent Cloud
- OVHcloud
- Rackspace Technology
- Hitachi Vantara
- Fujitsu Limited
- pCloud AG
- Tresorit AG
- Iron Mountain
Additional Benefits:
- The market estimate (ME) sheet in Excel format
- 3 months of analyst support
TABLE OF CONTENTS
1 INTRODUCTION
- 1.1 Study Assumptions and Market Definition
- 1.2 Scope of the Study
2 RESEARCH METHODOLOGY
3 EXECUTIVE SUMMARY
4 MARKET LANDSCAPE
- 4.1 Market Overview
- 4.2 Macroeconomic Impact Assessment
- 4.3 Market Drivers
- 4.3.1 Increase in cloud adoption across organizations
- 4.3.2 Rising demand for low-cost, high-speed storage access
- 4.3.3 Edge-to-cloud workflow acceleration in media and gaming
- 4.3.4 Gen-AI-led data explosion in knowledge-worker apps (2025+)
- 4.3.5 Government stimulus for sovereign cloud frameworks
- 4.3.6 ESG-driven storage optimization and carbon-aware workloads
- 4.4 Market Restraints
- 4.4.1 Persistent data-sovereignty complexity
- 4.4.2 Escalating egress-fee backlash and vendor lock-in risk
- 4.4.3 Multi-cloud data-sprawl security gaps
- 4.4.4 Limited last-mile bandwidth in frontier markets
- 4.5 Value Chain Analysis
- 4.6 Regulatory Landscape
- 4.7 Technological Outlook
- 4.8 Porter's Five Forces Analysis
- 4.8.1 Threat of New Entrants
- 4.8.2 Bargaining Power of Suppliers
- 4.8.3 Bargaining Power of Buyers
- 4.8.4 Threat of Substitutes
- 4.8.5 Industry Rivalry
- 4.9 Investment Analysis
5 MARKET SIZE AND GROWTH FORECASTS (VALUE)
- 5.1 By Deployment Mode
- 5.1.1 Private Cloud
- 5.1.2 Public Cloud
- 5.1.3 Hybrid Cloud
- 5.2 By Storage Type
- 5.2.1 File Storage
- 5.2.2 Object Storage
- 5.2.3 Block Storage
- 5.3 By Enterprise Size
- 5.3.1 SMEs
- 5.3.2 Large Enterprises
- 5.4 By Application
- 5.4.1 Backup and Recovery
- 5.4.2 Data Management and Archiving
- 5.4.3 Application Management
- 5.4.4 Collaboration and Content Services
- 5.5 By End-user Industry
- 5.5.1 BFSI
- 5.5.2 Healthcare and Life Sciences
- 5.5.3 Government and Public Sector
- 5.5.4 Manufacturing
- 5.5.5 Retail and E-commerce
- 5.5.6 IT and Telecom
- 5.5.7 Media and Entertainment
- 5.5.8 Others
- 5.6 By Geography
- 5.6.1 North America
- 5.6.1.1 United States
- 5.6.1.2 Canada
- 5.6.1.3 Mexico
- 5.6.2 South America
- 5.6.2.1 Brazil
- 5.6.2.2 Argentina
- 5.6.3 Europe
- 5.6.3.1 Germany
- 5.6.3.2 United Kingdom
- 5.6.3.3 France
- 5.6.3.4 Russia
- 5.6.4 Asia Pacific
- 5.6.4.1 China
- 5.6.4.2 India
- 5.6.4.3 Japan
- 5.6.4.4 South Korea
- 5.6.4.5 ASEAN
- 5.6.4.6 Rest of Asia Pacific
- 5.6.5 Middle East and Africa
- 5.6.5.1 Middle East
- 5.6.5.1.1 Saudi Arabia
- 5.6.5.1.2 Turkey
- 5.6.5.2 Africa
- 5.6.5.2.1 South Africa
- 5.6.1 North America
6 COMPETITIVE LANDSCAPE
- 6.1 Market Concentration
- 6.2 Strategic Moves
- 6.3 Market Share Analysis
- 6.4 Company Profiles (includes Global level Overview, Market level overview, Core Segments, Financials as available, Strategic Information, Market Rank/Share for key companies, Products and Services, and Recent Developments)
- 6.4.1 Amazon Web Services Inc.
- 6.4.2 Microsoft Corporation
- 6.4.3 Google LLC (Alphabet)
- 6.4.4 Alibaba Cloud (Alibaba Group)
- 6.4.5 IBM Corporation
- 6.4.6 Oracle Corporation
- 6.4.7 Dell Technologies Inc.
- 6.4.8 Hewlett Packard Enterprise
- 6.4.9 NetApp Inc.
- 6.4.10 Dropbox Inc.
- 6.4.11 Box Inc.
- 6.4.12 Wasabi Technologies
- 6.4.13 Backblaze Inc.
- 6.4.14 Tencent Cloud
- 6.4.15 OVHcloud
- 6.4.16 Rackspace Technology
- 6.4.17 Hitachi Vantara
- 6.4.18 Fujitsu Limited
- 6.4.19 pCloud AG
- 6.4.20 Tresorit AG
- 6.4.21 Iron Mountain
7 MARKET OPPORTUNITIES AND FUTURE OUTLOOK
- 7.1 White-space and Unmet-need Assessment
 2025年全球儲存即服務市場報告2025年全球企業雲端儲存服務市場報告
 儲存即服務市場規模、佔有率和成長分析(按儲存類型、部署模式、最終用戶、企業規模和地區分類)-2025-2032 年產業預測
 雲端儲存市場預測至 2032 年:按元件、部署模式、儲存類型、企業規模、應用程式、最終用戶和地區分類的全球分析
 儲存即服務 (STaaS) 市場規模、佔有率和趨勢分析報告:按服務類型、部署模式、最終用途、地區和細分市場預測 (2025-2033)
 雲端儲存市場按部署模式、組織規模、儲存媒體類型、服務類型、應用和最終用戶分類 - 全球預測 2025-2032雲端儲存服務市場按服務類型、裝置類型、儲存類型、定價模式、部署類型、企業規模、應用程式和最終用戶產業分類 - 全球預測,2025-2032 年雲端原生儲存市場按產品類型、部署模式、最終用戶產業、應用程式和組織規模分類 - 全球預測 2025-20322025年全球雲端儲存市場報告2025年全球雲端原生儲存市場報告