


 |
市場調查報告書
商品編碼
1851400
振動監測:市場佔有率分析、行業趨勢、統計數據和成長預測(2025-2030 年)Vibration Monitoring - Market Share Analysis, Industry Trends & Statistics, Growth Forecasts (2025 - 2030) |
||||||
※ 本網頁內容可能與最新版本有所差異。詳細情況請與我們聯繫。
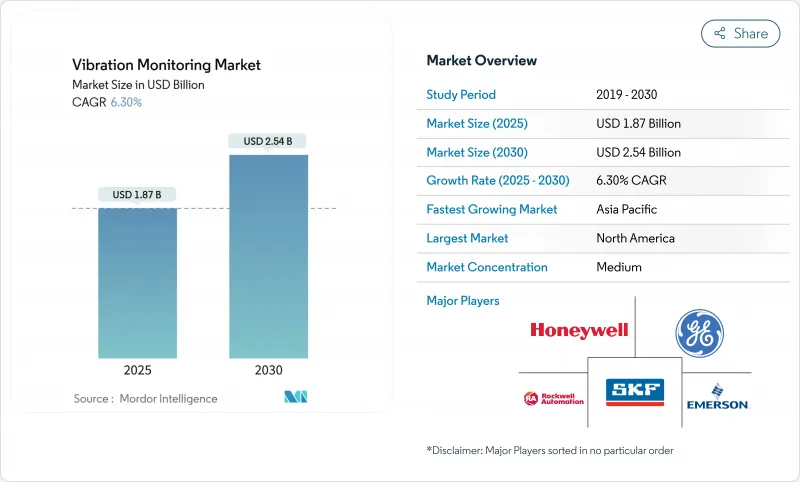
預計到 2025 年,振動監測市場規模將達到 18.7 億美元,到 2030 年將達到 25.4 億美元,預測期內複合年成長率為 6.3%。
人們日益意識到計劃外機械故障的高成本,這正促使維護策略從被動應對轉向預測性維護,從而推動石油天然氣、發電和離散製造等行業對基於狀態的監控技術進行持續投資。無線工業物聯網感測器、邊緣分析和雲端平台正在融合,以降低資料擷取成本,擴大對難以觸及資產的覆蓋範圍,並提供指導性洞察以延長資產壽命。危險產業監管壓力的不斷增加、老舊燃煤發電廠的退役延期以及亞洲政府支持的智慧製造計劃,都將進一步刺激市場需求。隨著自動化領域的領導者將振動分析融入更廣泛的數位雙胞胎生態系統,競爭日益激烈,這提高了獨立感測器供應商的准入門檻,並增強了振動監測市場的長期成長前景。
全球振動監測市場趨勢與洞察
危險區域無線工業物聯網感測器的應用日益普及
在煉油廠、化工廠和海上鑽機,無線本質安全型振動感測器正逐步取代有線解決方案,營運商希望最大限度地減少人員暴露風險和維護成本。艾默生的AMS無線振動監測器採用WirelessHART協議,電池壽命長達三至五年。這款最新設備將三軸加速器與內建的預測分析功能相結合,可實現對泵浦、壓縮機和祛水器的遠端監測。沙烏地阿美在其法迪利天然氣廠部署了454個無線振動節點,充分展現了這些解決方案在大規模危險環境中的可擴展性。不斷改進的通訊協定安全性和邊緣處理能力持續降低整體擁有成本,推動了振動監測產品在市場的廣泛應用。
從週期性在線監測過渡到連續性在線監測
電力公司正逐漸拋棄傳統的路線巡檢方式,轉而採用永久安裝的感測器,將高解析度資料傳輸到由旋轉設備專家組成的遠端中心。 GE Vernova 的遠端監控與診斷服務將數千個蒸氣渦輪和燃氣渦輪機資料點連接到雲端分析平台,可在故障發生前一到兩個月檢測到異常情況,從而實現最佳停機計劃。複合迴圈電廠將從中受益最大,因為突發的負載波動會產生振動模式,而傳統的季度巡檢往往無法檢測到這些模式。隨著原始設備製造商將效能保固與持續監控合規性捆綁在一起,振動監控市場對運作系統的需求可能會持續成長。
ISO 18436-2認證振動分析師短缺
現代系統會產生龐大而複雜的資料集,需要專家解讀才能確認機械故障。培訓分析人員達到 ISO 18436-2 等級需要兩到三年時間,而人才供應無法滿足工業需求,尤其是在快速成長的經濟體。雖然許多公司已透過外包診斷或部署自動化分析來應對這項挑戰,但複雜的渦輪機械故障通常需要人工判斷,這限制了某些振動監測市場的擴張。
細分市場分析
到2024年,硬體將佔振動監測市場收入的62%,其中加速計、速度感測器和接近探頭在每個設施中都扮演著核心角色。加速計憑藉其寬廣的頻率範圍和易於安裝在泵浦、馬達和齒輪箱上的優勢佔據主導地位。隨著MEMS和光學感測器應用範圍的擴大和節點成本的降低,硬體的市場佔有率預計將會放緩。另一方面,到2030年,隨著用戶轉向包含數據分析、診斷和維護建議的基於結果的契約,服務將以7.8%的複合年成長率實現最高成長。軟體也將同步發展,從本地頻譜檢視器轉向應用機器學習數位雙胞胎關聯的雲端平台,從而使供應商能夠獲得持續收入。 TDK的Tronics AXO 315(數位力平衡MEMS加速計)展示了韌體豐富的感測器如何模糊硬體和軟體服務之間的界限。
對預測性洞察的日益重視,正將服務提供者定位為策略夥伴而非交易型供應商。按監控資產或避免停機時間收費的託管服務協議,協調了獎勵,並提升了對分析訂閱的需求。大型自動化公司利用其全球服務網路來獲取這一價值,而專注於複雜故障模式的診斷公司則專注於此。日益嚴重的勞動力短缺有利於自動化診斷,並強化了振動監測市場以服務主導的成長模式。
到2024年,線上連續監測將佔總收入的55%,只要渦輪機、壓縮機和擠出機等關鍵設備需要全天候監測,這一比例就會保持在高位。連續資料流能夠及早識別路徑測量無法捕捉到的頻譜特徵趨勢和瞬態事件。雖然可攜式系統目前仍主要用於一些不太重要的設備,但無線感測成本的降低正促使預算轉向將振動和溫度通道整合到單一設備中的永久安裝節點。
無線遠端監測預計將以9.2%的複合年成長率成長。目前,電池供電節點的使用壽命超過三年,而工業級網狀通訊協定可提供適用於保護邏輯的確定性延遲。艾默生報告稱,每個站點部署了數千個無線振動監測點,證明即使在大型建築群中,無線監測也能實現可行的規模化應用。邊緣駐留分析透過僅傳輸預過濾指標,進一步降低了頻寬需求。這些優勢使得振動監測市場越來越傾向於在待開發區和改裝計劃中採用無線架構。
區域分析
北美地區引領市場,預計2024年將佔全球收入的37%,這主要得益於海上油氣監管法規強制要求進行線上狀態監測,以及美國電力產業的大規模維修。公用事業公共產業延長燃煤機組和複合迴圈電廠的使用壽命將持續推動對感測器的需求,而加拿大油砂作業則需要能夠承受極寒和粉塵環境的堅固耐用的設備。政府對職場安全的重視也推動了投資,鞏固了該地區在振動監測市場的主導地位。
歐洲憑藉其製造業基礎和能源效率法規,保持著較大的市場佔有率。德國正大力推進工業4.0,將振動數據與製造執行系統(MES)和企業資源計劃(ERP)系統整合,以實現對資產的全面了解。英國北海油氣業者正大力投資無線網狀感測技術,以降低危險區域的佈線成本。同時,歐盟嚴格的機械指令將狀態監控納入風險評估架構。這些因素共同構成了持續的、合規主導的需求,這將支撐整個歐洲大陸的振動監測市場。
亞太地區將以8.6%的複合年成長率成為成長最快的地區,中國、日本和印度的智慧製造獎勵將推動感測器應用。半導體產業強調MEMS本地化生產的策略將進一步降低裝置成本。東南亞各國政府推動中小企業快速工業化數位化的措施將擴大潛在市場。無線通訊協定和雲端分析技術在新工廠中迅速普及,擺脫了舊有系統的束縛,使該地區成為振動監測市場的重要成長引擎。
其他福利:
- Excel格式的市場預測(ME)表
- 3個月的分析師支持
目錄
第1章 引言
- 研究假設和市場定義
- 調查範圍
第2章調查方法
第3章執行摘要
第4章 市場情勢
- 市場概覽
- 市場促進因素
- 在全球範圍內,無線工業物聯網感測器在危險區域的應用日益廣泛。
- 發電渦輪機監測方式從週期性監測轉向連續性線上監測(北美和歐洲)
- 中東地區石油和天然氣業者將強制要求根據資產關鍵性進行預測性維護。
- 政府資助的智慧製造計畫提振了對MEMS加速計的需求(亞洲)
- 利用振動監測技術對老舊燃煤發電廠維修,以延長其使用壽命(南美洲)
- 市場限制
- 獲得 ISO 18436-2 認證的振動分析師非常少見。
- 雲端連線監控閘道器的網路安全加固成本
- 一般認為低運轉時間批量食品加工生產線的投資報酬率較低
- 無線標準碎片化造成互通性挑戰
- 價值/供應鏈分析
- 監理展望
- 技術展望
- 波特五力分析
- 供應商的議價能力
- 買方的議價能力
- 新進入者的威脅
- 替代品的威脅
- 競爭對手之間的競爭
第5章 市場規模與成長預測
- 按組件
- 硬體
- 加速計
- 速度感測器
- 位移/接近探頭
- 其他硬體(MEMS、壓電、光學)
- 軟體
- 服務
- 硬體
- 透過監控過程
- 線上/持續
- 可攜式/基於Root的
- 無線遠端(邊緣和雲端)
- 透過部署模式
- 本地部署
- 雲/SaaS
- 透過網路技術
- 有線(4-20 mA、Modbus、乙太網路)
- 無線(BLE、ISA100、6LoWPAN)
- 透過使用
- 馬達和水泵
- 渦輪機和壓縮機
- 變速箱和軸承
- 風扇和鼓風機
- 按最終用戶行業分類
- 石油和天然氣
- 能源與電力
- 汽車與運輸
- 化工/石油化工
- 採礦和金屬
- 飲食
- 航太/國防
- 紙漿和造紙
- 海洋
- 其他行業
- 按地區
- 北美洲
- 美國
- 加拿大
- 墨西哥
- 歐洲
- 英國
- 德國
- 法國
- 義大利
- 其他歐洲地區
- 亞太地區
- 中國
- 日本
- 印度
- 韓國
- 亞太其他地區
- 中東
- 以色列
- 沙烏地阿拉伯
- 阿拉伯聯合大公國
- 土耳其
- 其他中東地區
- 非洲
- 南非
- 埃及
- 其他非洲地區
- 南美洲
- 巴西
- 阿根廷
- 其他南美洲
- 北美洲
第6章 競爭情勢
- 市場集中度
- 策略趨勢
- 市佔率分析
- 公司簡介
- SKF
- Emerson Electric Co.
- General Electric(Baker Hughes)
- Honeywell International Inc.
- Rockwell Automation Inc.
- National Instruments Corp.
- Analog Devices Inc.
- Siemens AG
- ABB Ltd.
- Fluke Corporation
- Bruel and Kjar Vibro
- Meggitt PLC
- SPM Instrument AB
- Schaeffler AG
- STMicroelectronics
- PCB Piezotronics Inc.
- Banner Engineering Corp.
- Parker Hannifin(Kinetics)
- Azima DLI Corporation
- Baker Hughes Condition Monitoring
第7章 市場機會與未來展望
The vibration monitoring market is valued at USD 1.87 billion in 2025 and is projected to reach USD 2.54 billion by 2030, advancing at a 6.3% CAGR through the forecast period.
Increasing recognition of the high cost of unplanned machinery failures is shifting maintenance strategies from reactive to predictive approaches, driving steady investment in condition-based monitoring across oil and gas, power generation, and discrete manufacturing. Wireless IIoT sensors, edge analytics, and cloud platforms are converging to reduce data-collection costs, extend coverage to hard-to-reach assets, and enable prescriptive insights that lengthen asset life. Heightened regulatory pressure in hazardous industries, the retirement deferment of aging coal-fired plants, and government-backed smart-manufacturing schemes in Asia further accelerate demand. Competitive intensity is rising as established automation majors fold vibration analytics into broader digital-twin ecosystems, raising entry barriers for stand-alone sensor suppliers and strengthening the long-term growth outlook for the vibration monitoring market.
Global Vibration Monitoring Market Trends and Insights
Rising Adoption of Wireless IIoT-Enabled Sensors in Hazardous Zones
Wireless, intrinsically safe vibration sensors are replacing cabled solutions in refineries, chemical plants, and offshore rigs as operators seek to minimize human exposure and maintenance overheads. Emerson's AMS Wireless Vibration Monitor, which operates on WirelessHART and provides a three-to-five-year battery life, illustrates how modern devices now combine triaxial accelerometry with embedded prescriptive analytics, enabling remote coverage of pumps, compressors, and steam traps. Aramco's roll-out of 454 wireless vibration nodes at the Fadhili Gas Plant shows the scalability of these solutions in large-scale hazardous. Improved protocol security and edge processing continue to lower total cost of ownership, underpinning broader acceptance across the vibration monitoring market.
Shift from Periodic to Online Continuous Monitoring in Power-Generation Turbines
Power utilities are abandoning route-based checks in favor of permanent sensors that stream high-resolution data to remote centers staffed by rotating-equipment specialists. GE Vernova's Remote Monitoring & Diagnostics service connects thousands of steam- and gas-turbine data points to cloud analytics that spot anomalies one to two months before failure, allowing optimized shutdown scheduling. Combined-cycle plants benefit most, because rapid load changes introduce vibration patterns that legacy quarterly checks overlook. With original-equipment manufacturers now bundling performance guarantees to continuous-monitoring adherence, demand for always-on systems in the vibration monitoring market is set to climb steadily.
Scarcity of Vibration Analysts with ISO 18436-2 Certification
Modern systems generate large, complex data sets that still need expert interpretation to confirm machine faults. Training an analyst to ISO 18436-2 level takes two to three years, and supply lags industrial demand, especially in fast-growing economies. Many firms respond by outsourcing diagnostics or deploying automated analytics, yet intricate turbomachinery failures often require human judgement, tempering expansion in parts of the vibration monitoring market.
Other drivers and restraints analyzed in the detailed report include:
- Asset-Criticality-Based Predictive-Maintenance Mandates by Offshore Oil & Gas Operators
- Government-Funded Smart-Manufacturing Programs Boosting MEMS Accelerometer Demand
- Cyber-Hardening Costs for Cloud-Connected Monitoring Gateways
For complete list of drivers and restraints, kindly check the Table Of Contents.
Segment Analysis
Hardware led the vibration monitoring market with 62% revenue in 2024, underscoring the central role of accelerometers, velocity pickups, and proximity probes in every installation. Accelerometers dominate because they span wide frequency ranges and mount easily on pumps, motors, and gearboxes, while displacement transducers remain mandatory on high-speed turbines. The hardware share is expected to moderate as MEMS and optical sensors widen application scope and reduce node cost. Services, however, post the strongest 7.8% CAGR through 2030 as users shift toward outcome-based contracts that bundle data analytics, diagnostics, and maintenance recommendations. Software evolves in parallel, migrating from on-premise spectrum viewers to cloud platforms that apply machine learning and digital-twin correlation, enabling vendors to lock in recurring revenue. TDK's Tronics AXO 315, a digital, force-rebalance MEMS accelerometer, exemplifies how firmware-rich sensors blur the line between hardware and software services.
The growing emphasis on predictive insights positions service providers as strategic partners rather than transactional suppliers. Managed-service contracts that charge per monitored asset or per avoided downtime align incentives and amplify demand for analytics subscriptions. Large automation houses leverage global service networks to capture this value, while niche diagnostic firms specialize in complex failure modes. As labor shortages tighten, automated diagnostics gain favor, reinforcing service-led growth across the vibration monitoring market.
Online continuous monitoring captured 55% of 2024 revenue, a position it will hold as long as critical equipment such as turbines, compressors, and extruders require around-the-clock oversight. Continuous data streams allow trending of spectral signatures and early identification of transient events that route-based measurements miss. Portable systems still serve lower-criticality assets, yet cost reductions in wireless sensing are tilting budgets toward permanent nodes that combine vibration and temperature channels on a single device.
Wireless remote monitoring is forecast to rise at a 9.2% CAGR. Battery-powered nodes now sustain three-plus years of life, and industrial-grade mesh protocols provide deterministic latency suitable for protection logic. Emerson reports deployments of thousands of wireless vibration points per site, proving viable scale for large complexes. Edge-resident analytics further lower bandwidth needs by transmitting only pre-filtered indicators. As these advantages compound, the vibration monitoring market increasingly favors wireless architectures for both greenfield and retrofit projects.
The Vibration Monitoring Market Report is Segmented by Component (Hardware, Software, Services), Monitoring Process (Online/Continuous, Portable, Wireless Remote), Deployment Mode (On-Premises, Cloud), Network Technology (Wired, Wireless), Application (Motors and Pumps, Turbines, and More), End-User Industry (Oil and Gas, Energy, Automotive, and More), and Geography. The Market Forecasts are Provided in Terms of Value (USD).
Geography Analysis
North America led with 37% of 2024 revenue, propelled by offshore oil and gas regulations that mandate online condition monitoring, plus large-scale retrofits in the United States power sector. Utilities extending the life of coal-fired units and combined-cycle plants underpin continual sensor demand, while Canada's oil sands operations require robust devices that withstand extreme cold and dust. Government emphasis on workplace safety also promotes investment, cementing the region's dominance in the vibration monitoring market.
Europe maintains a sizeable share on the strength of its manufacturing base and energy-efficiency legislation. Germany champions Industry 4.0 roll-outs that couple vibration data with MES and ERP systems for holistic asset views. The United Kingdom's North Sea operators invest heavily in wireless mesh sensing to overcome hazardous-area cabling costs, while the EU's stringent machinery directives embed condition monitoring within risk-assessment frameworks. These factors create stable, compliance-driven demand that supports the vibration monitoring market across the continent.
Asia-Pacific posts the fastest 8.6% CAGR, buoyed by Chinese, Japanese, and Indian smart-manufacturing incentives that subsidize sensor adoption. Semiconductor strategies emphasizing local MEMS production further reduce device cost. Rapid industrialization across Southeast Asia and government efforts to digitalize SMEs expand the addressable base. Adoption of wireless protocols and cloud analytics is swift in new plants unencumbered by legacy systems, positioning the region as a key growth engine for the vibration monitoring market.
- SKF
- Emerson Electric Co.
- General Electric (Baker Hughes)
- Honeywell International Inc.
- Rockwell Automation Inc.
- National Instruments Corp.
- Analog Devices Inc.
- Siemens AG
- ABB Ltd.
- Fluke Corporation
- Bruel and Kjar Vibro
- Meggitt PLC
- SPM Instrument AB
- Schaeffler AG
- STMicroelectronics
- PCB Piezotronics Inc.
- Banner Engineering Corp.
- Parker Hannifin (Kinetics)
- Azima DLI Corporation
- Baker Hughes Condition Monitoring
Additional Benefits:
- The market estimate (ME) sheet in Excel format
- 3 months of analyst support
TABLE OF CONTENTS
1 INTRODUCTION
- 1.1 Study Assumptions and Market Definition
- 1.2 Scope of the Study
2 RESEARCH METHODOLOGY
3 EXECUTIVE SUMMARY
4 MARKET LANDSCAPE
- 4.1 Market Overview
- 4.2 Market Drivers
- 4.2.1 Rising Adoption of Wireless IIoT-Enabled Sensors in Hazardous Zones (Global)
- 4.2.2 Shift from Periodic to Online Continuous Monitoring in Power Generation Turbines (North America and Europe)
- 4.2.3 Asset-criticality-based Predictive Maintenance Mandates by Offshore Oil and Gas Operators (Middle East)
- 4.2.4 Government-funded Smart Manufacturing Programs Boosting MEMS Accelerometer Demand (Asia)
- 4.2.5 Aging Coal-Fired Plants Retrofitting Vibration Monitoring for Life-Extension (South America)
- 4.3 Market Restraints
- 4.3.1 Scarcity of Vibration Analysts with ISO 18436-2 Certification
- 4.3.2 Cyber-hardening Costs for Cloud-connected Monitoring Gateways
- 4.3.3 Low ROI Perception in Low-runtime Batch Food Processing Lines
- 4.3.4 Fragmented Wireless Standards Causing Interoperability Issues
- 4.4 Value / Supply-Chain Analysis
- 4.5 Regulatory Outlook
- 4.6 Technological Outlook
- 4.7 Porter's Five Forces Analysis
- 4.7.1 Bargaining Power of Suppliers
- 4.7.2 Bargaining Power of Buyers
- 4.7.3 Threat of New Entrants
- 4.7.4 Threat of Substitutes
- 4.7.5 Intensity of Competitive Rivalry
5 MARKET SIZE AND GROWTH FORECASTS (VALUE)
- 5.1 By Component
- 5.1.1 Hardware
- 5.1.1.1 Accelerometers
- 5.1.1.2 Velocity Sensors
- 5.1.1.3 Displacement/Proximity Probes
- 5.1.1.4 Other Hardware (MEMS, Piezo, Optical)
- 5.1.2 Software
- 5.1.3 Services
- 5.1.1 Hardware
- 5.2 By Monitoring Process
- 5.2.1 Online/Continuous
- 5.2.2 Portable/Route-based
- 5.2.3 Wireless Remote (Edge and Cloud)
- 5.3 By Deployment Mode
- 5.3.1 On-premises
- 5.3.2 Cloud / SaaS
- 5.4 By Network Technology
- 5.4.1 Wired (4-20 mA, Modbus, Ethernet)
- 5.4.2 Wireless (BLE, ISA100, 6LoWPAN)
- 5.5 By Application
- 5.5.1 Motors and Pumps
- 5.5.2 Turbines and Compressors
- 5.5.3 Gearboxes and Bearings
- 5.5.4 Fans and Blowers
- 5.6 By End-user Industry
- 5.6.1 Oil and Gas
- 5.6.2 Energy and Power
- 5.6.3 Automotive and Transportation
- 5.6.4 Chemicals and Petrochemicals
- 5.6.5 Mining and Metals
- 5.6.6 Food and Beverage
- 5.6.7 Aerospace and Defense
- 5.6.8 Pulp and Paper
- 5.6.9 Marine
- 5.6.10 Other Industries
- 5.7 By Geography
- 5.7.1 North America
- 5.7.1.1 United States
- 5.7.1.2 Canada
- 5.7.1.3 Mexico
- 5.7.2 Europe
- 5.7.2.1 United Kingdom
- 5.7.2.2 Germany
- 5.7.2.3 France
- 5.7.2.4 Italy
- 5.7.2.5 Rest of Europe
- 5.7.3 Asia-Pacific
- 5.7.3.1 China
- 5.7.3.2 Japan
- 5.7.3.3 India
- 5.7.3.4 South Korea
- 5.7.3.5 Rest of Asia-Pacific
- 5.7.4 Middle East
- 5.7.4.1 Israel
- 5.7.4.2 Saudi Arabia
- 5.7.4.3 United Arab Emirates
- 5.7.4.4 Turkey
- 5.7.4.5 Rest of Middle East
- 5.7.5 Africa
- 5.7.5.1 South Africa
- 5.7.5.2 Egypt
- 5.7.5.3 Rest of Africa
- 5.7.6 South America
- 5.7.6.1 Brazil
- 5.7.6.2 Argentina
- 5.7.6.3 Rest of South America
- 5.7.1 North America
6 COMPETITIVE LANDSCAPE
- 6.1 Market Concentration
- 6.2 Strategic Moves
- 6.3 Market Share Analysis
- 6.4 Company Profiles (includes Global level Overview, Market level overview, Core Segments, Financials as available, Strategic Information, Market Rank/Share for key companies, Products and Services, and Recent Developments)
- 6.4.1 SKF
- 6.4.2 Emerson Electric Co.
- 6.4.3 General Electric (Baker Hughes)
- 6.4.4 Honeywell International Inc.
- 6.4.5 Rockwell Automation Inc.
- 6.4.6 National Instruments Corp.
- 6.4.7 Analog Devices Inc.
- 6.4.8 Siemens AG
- 6.4.9 ABB Ltd.
- 6.4.10 Fluke Corporation
- 6.4.11 Bruel and Kjar Vibro
- 6.4.12 Meggitt PLC
- 6.4.13 SPM Instrument AB
- 6.4.14 Schaeffler AG
- 6.4.15 STMicroelectronics
- 6.4.16 PCB Piezotronics Inc.
- 6.4.17 Banner Engineering Corp.
- 6.4.18 Parker Hannifin (Kinetics)
- 6.4.19 Azima DLI Corporation
- 6.4.20 Baker Hughes Condition Monitoring
7 MARKET OPPORTUNITIES AND FUTURE OUTLOOK
- 7.1 White-space and Unmet-need Assessment
 2025-2033 年振動監測市場報告(按組件、系統類型、監測流程、最終用途行業和地區)
 2025年全球振動系統市場報告2025年火箭振動監測全球市場報告
 振動監測市場按組件、監測流程、功能、連接類型、行業領域和應用分類 - 2025-2030 年全球預測
 振動監測系統市場 - 預測 2025-2030
 全球振動監測市場規模、佔有率、趨勢分析(按流程、組件、行業垂直、地區、展望和預測),2025 年至 2032 年
 振動監測市場規模、佔有率、趨勢分析報告:按組件、流程、產業、地區、細分市場、預測,2025 年至 2030 年全球振動監測市場研究報告-產業分析、規模、佔有率、成長、趨勢及2025年至2033年預測
 振動監測市場規模、佔有率、成長分析,按產品提供、按監測流程、按部署類型、按應用、按垂直行業和按地區 - 行業預測,2025 年至 2032 年振動監測系統市場:按組件、應用、系統類型和地區劃分,2024-2031 年