


 |
市場調查報告書
商品編碼
1851396
光學感測器:市場佔有率分析、行業趨勢、統計數據和成長預測(2025-2030 年)Optical Sensor - Market Share Analysis, Industry Trends & Statistics, Growth Forecasts (2025 - 2030) |
||||||
※ 本網頁內容可能與最新版本有所差異。詳細情況請與我們聯繫。
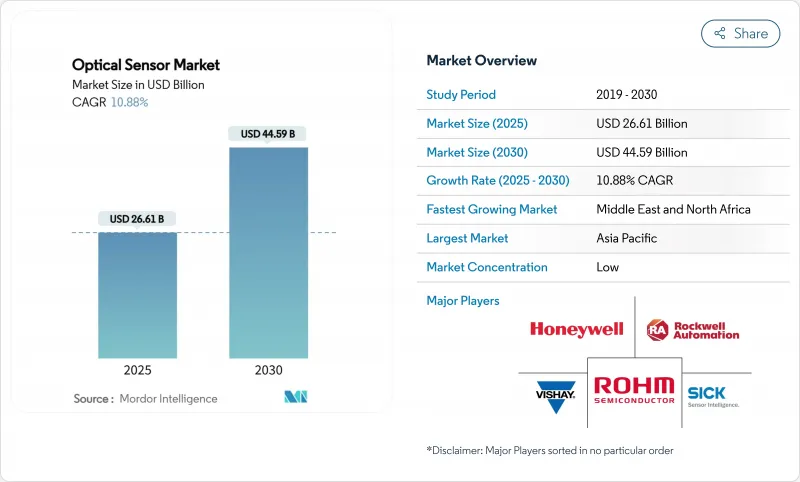
預計到 2025 年,光學感測器市場規模將達到 266.1 億美元,到 2030 年將達到 445.9 億美元,複合年成長率為 10.88%。
圍繞汽車安全、環境監測和資料隱私的持續監管壓力,推動了對整合化、具成本效益矽光電設計的需求。晶圓級光電價格的下降以及網路邊緣人工智慧工作負載的激增,正在加速5G基礎設施、自動駕駛汽車和分散式光纖監測等領域對感測器的應用。高純度二氧化矽和鍺的供應風險凸顯了多元化採購的必要性,而穿戴式裝置和智慧型手機的小型化需求則持續推動大規模生產轉移到亞太地區。隨著小型公司部署光子整合技術並與老牌半導體製造商競爭,競爭日益激烈。
全球光學感測器市場趨勢與洞察
亞太地區消費性電子產品對穿戴式光學裝置小型化的需求
為了達到預期的發光效率目標,AR眼鏡和智慧型穿戴裝置需要亞毫米級的光學堆疊結構。由意法半導體(STMicroelectronics)推出的單層超構光學元件可將透鏡高度降低70%,從而實現旗艦智慧型手機的螢幕下近距離感應功能。磷化銦垂直腔面發射雷射(VCSEL)取代了砷化鎵(GaAs)發射器,為空間受限的裝置提供了更小的光束發散角。亞太地區的契約製造製造商正利用這些技術發展贏得西方品牌的訂單,鞏固了在該地區33%的市場佔有率。
工業IoT的普及推動了光纖感測器在惡劣環境下的應用
分散式光纖感測技術可提供公里級的溫度和應變數據,且不受電磁干擾,從而實現煉油廠、管道和高壓變電站的預測性維護。羅克韋爾自動化指出,對這類數據進行早期預警分析,可將流程工業的非計畫停機時間減少30%。基於人工智慧的模式辨識技術,結合連續的光學回饋,正成為北美和歐洲工業4.0策略的基石。
高純度二氧化矽預製件的供應鏈限制
2024年的颶風造成的網路中斷暴露了單一地區對光纖供應的限制作用。再加上中國對鍺出口的限制,製造商們正以高價談判長期契約,這延緩了分散式光纖解決方案的大規模部署。合成二氧化矽新興企業正在湧現,但距離商業性規模應用仍需兩到三年。
細分市場分析
受多相機智慧型手機和高級駕駛輔助系統(ADAS)部署的推動,影像感測器將在2024年保持42%的光學感測器市場佔有率。SONY的堆疊式CMOS技術將支援120幀/秒的4K影片拍攝,並滿足工廠自動化所需的機器視覺精度要求。光纖感測器雖然目前絕對收入較小,但隨著基礎設施營運商轉向公里級結構健康監測,預計將達到12.7%的最高複合年成長率。這一成長動能將推動光纖解決方案的光學感測器市場規模從2025年的47億美元成長到2030年的86億美元。分散式聲學感測、管線安全和周界入侵偵測系統是推動市場成長的關鍵因素。
光電感測器、環境光感測器和接近感測器的多樣化發展勢頭依然強勁,但平均售價的下降給組件製造商帶來了壓力。像Vishay公司厚度僅為0.5毫米的超緊湊型接近模組支援無邊框行動電話設計,而全局百葉窗工業相機則消除了機器人取放應用中的運動模糊。其他頻譜成像器則支援精密農業和食品安全螢光檢測,並實現了兩位數的成長。
儘管單光子Avalanche二極體 (SPAD) 和Avalanche光電二極體 (APD) 等尖端檢測器的出貨量低於標準光電二極體,但它們的售價卻很高。 SPAD 陣列可提供皮秒級的飛行時間數據,雷射雷達系統正是利用這些數據為自動駕駛車輛提供精確的距離測量。在發射器方面,設計團隊正從 LED 轉向 VCSEL 和邊發射雷射器,以提供更高的光輸出和更精確的頻譜控制。
光學元件和濾光片每克重量的價值最高,因為它們的精密鍍膜和嚴格的公差對新參與企業構成了挑戰。 MetaOptics 正在革新鏡頭設計,以單層圖案化結構取代多元件堆疊,在保持性能的同時減少尺寸和重量。處理電子裝置也在遵循同樣的路徑:更多功能被整合到感測器晶粒上,邊緣人工智慧可以在本地運行,從而降低延遲並減輕頻寬需求。
光學感測器市場按感測器類型(影像感測器、光纖感測器及其他)、感測技術(固有感測器及其他)、組件(光電探測器、光源及其他)、波長(紫外光、可見光及其他)、輸出終端用戶應用(家用電子電器、工業自動化與機器人及其他)以及地區進行細分。市場預測以美元計價。
區域分析
亞太地區將佔2024年總營收的33%,這反映了元件工廠、模組組裝和消費性電子品牌之間的緊密合作。中國和越南的代工製造商目前生產的接近感測器晶片平均售價低於0.09美元,進一步鞏固了其在該地區的成本領先地位。日本的精密光學生態系統支援符合AEC-Q102標準的汽車雷射雷達模組,而韓國的晶圓代工廠正在挑戰堆疊式影像感測器的產量比率極限。
法規主導的應用在歐洲市場佔據主導地位。一家德國一級供應商已獲得一份長期契約,為其提供符合歐洲新車安全評價協會(Euro NCAP)視覺系統指令的近紅外線成像陣列。隨著歐盟甲烷排放法規的日益嚴格,光纖氣體洩漏監測在北海平台周圍的應用也日益廣泛。 GDPR合規性正推動原始設備製造商(OEM)轉向設備端生物識別分析,從而促進內建感測器的應用。
北美在測試新概念方面繼續保持領先地位。預計2024-2025年,光子學新興企業的創業融資將超過7億美元,其中邊緣人工智慧光鏈路特別引人注目。環保機構正在部署分散式光纖網路用於甲烷定量分析,這些網路通常由綠色債券發行提供資金。同時,沙烏地阿拉伯和阿拉伯聯合大公國正在智慧城市計劃中部署高光譜遙測相機陣列,預計將推動中東地區實現13.6%的複合年成長率。
其他福利:
- Excel格式的市場預測(ME)表
- 3個月的分析師支持
目錄
第1章 引言
- 研究假設和市場定義
- 調查範圍
第2章調查方法
第3章執行摘要
第4章 市場情勢
- 市場概覽
- 市場促進因素
- 亞太地區消費性電子市場對小型化穿戴光學元件的需求
- 工業IoT的普及推動了光纖感測器在惡劣環境下的應用
- 歐洲近紅外線影像感測器加速了汽車ADAS和雷射雷達的整合。
- 快速部署 5G 和邊緣資料中心需要高速光感
- 日益嚴格的環境監測法規推動北美分散式光纖感測技術的發展
- 矽光電的進步降低了整合光學感測器的物料清單成本
- 市場限制
- 高純度二氧化矽預製件的供應鏈限制
- 低階智慧型手機的價格敏感度限制了先進接近感測器。
- 頻譜感測器校準的複雜性阻礙了中小企業的採用。
- 歐盟生物辨識光學感測器引發的資料隱私擔憂
- 價值/供應鏈分析
- 監理與技術展望
- 波特五力分析
- 供應商的議價能力
- 買方的議價能力
- 新進入者的威脅
- 替代品的威脅
- 競爭對手之間的競爭
- 定價分析
- 投資和資金籌措趨勢
第5章 市場規模與成長預測
- 依感測器類型
- 影像感測器
- 光纖感測器
- 光電感測器
- 環境光和接近感測器
- 其他(位置、觸摸、頻譜)
- 透過感測技術
- 外置光感測器
- 內建光感應器
- 按組件
- 光電探測器(光電二極體、雪崩光電二極體、單光子雪崩光電二極體)
- 光源(LED、VCSEL、雷射)
- 光學元件和濾波器
- 積體電路和過程電子
- 波長
- 紫外光(100-400奈米)
- 可見光(400-700奈米)
- 近紅外線(700-1400奈米)
- 短波紅外線/中紅外線(波長大於1400奈米)
- 按產量計
- 模擬
- 數位的
- 透過最終用戶使用
- 消費性電子產品
- 工業自動化與機器人
- 汽車/運輸設備
- 醫療保健和醫療設備
- 生物辨識與安全
- 航太/國防
- 能源與環境監控
- 按地區
- 北美洲
- 美國
- 加拿大
- 墨西哥
- 歐洲
- 英國
- 德國
- 法國
- 義大利
- 其他歐洲地區
- 亞太地區
- 中國
- 日本
- 印度
- 韓國
- 亞太其他地區
- 中東
- 以色列
- 沙烏地阿拉伯
- 阿拉伯聯合大公國
- 土耳其
- 其他中東地區
- 非洲
- 南非
- 埃及
- 其他非洲地區
- 南美洲
- 巴西
- 阿根廷
- 其他南美洲
- 北美洲
第6章 競爭情勢
- 市場集中度
- 策略性舉措(併購、合資、產品發布、資金籌措)
- 市佔率分析
- 公司簡介
- ams-OSRAM AG
- Sony Group Corporation
- Hamamatsu Photonics KK
- ON Semiconductor Corp.
- ROHM Co., Ltd.
- SICK AG
- Keyence Corporation
- Teledyne Technologies Inc.
- STMicroelectronics NV
- Vishay Intertechnology Inc.
- Honeywell International Inc.
- IFM Electronic GmbH
- Pepperl+Fuchs SE
- Rockwell Automation Inc.
- Samsung Electronics Co. Ltd.
- Cognex Corporation
- FLIR Systems(Teledyne FLIR)
- Omnivision Technologies Inc.
- Lumentum Holdings Inc.
- Excelitas Technologies Corp.
- Thorlabs, Inc.
第7章 市場機會與未來展望
The optical sensors market reached USD 26.61 billion in 2025 and is projected to climb to USD 44.59 billion by 2030, advancing at a 10.88% CAGR.
Consistent regulatory pressure on automotive safety, environmental monitoring, and data privacy is steering demand toward integrated, cost-efficient silicon-photonics-based designs. Price drops in wafer-level photonics and the proliferation of AI workloads at the network edge are accelerating sensor adoption in 5G infrastructure, autonomous vehicles, and distributed fiber-optic monitoring. Material-supply risks around high-purity silica and germanium underscore the need for diversified sourcing, while miniaturization requirements in wearables and smartphones continue to shift volume production to Asia-Pacific. Competitive intensity is rising as smaller firms deploy photonic integration to rival long-established semiconductor players.
Global Optical Sensor Market Trends and Insights
Miniaturization Demand for Wearable Optics in APAC Consumer Electronics
AR glasses and smart wearables now require sub-millimeter optical stacks that still meet luminous-efficiency targets. Single-layer meta-optics introduced by STMicroelectronics cut lens height by 70%, permitting under-display proximity sensing in flagship smartphones. Indium-phosphide VCSELs are replacing GaAs emitters, delivering tighter beam divergence for space-constrained devices. APAC contract manufacturers leverage these developments to secure design wins from Western brands, reinforcing the region's 33% revenue share position.
Industrial IoT Adoption Fuelling Fiber-optic Sensors in Harsh Environments
Distributed fiber sensing provides kilometre-scale temperature and strain data immune to electromagnetic interference, enabling predictive maintenance across refineries, pipelines, and high-voltage substations. Rockwell Automation notes that early-warning analytics on such data can eliminate 30% of unplanned downtime in process industries. Coupling AI-based pattern recognition with continuous optical feedback is becoming a cornerstone of Industry 4.0 strategies in North America and Europe.
Supply-Chain Constraints for High-Purity Silica Preforms
Quartz mined from a handful of Appalachian deposits accounts for most global preform feedstock; Hurricane-induced outages in 2024 exposed how a single locale can squeeze optical-fiber availability. Coupled with China's export restrictions on germanium, manufacturers are negotiating long-term contracts at price premiums, delaying large-volume deployments of distributed fiber solutions. Synthetic-silica start-ups are emerging, but commercial scaling remains two to three years out.
Other drivers and restraints analyzed in the detailed report include:
- Automotive ADAS & LiDAR Integration Accelerating NIR Image Sensors in Europe
- Advances in Silicon Photonics Lowering Bill-of-Materials Cost for Integrated Optical Sensors
- Data-Privacy Concerns Around Biometric Optical Sensors in EU
For complete list of drivers and restraints, kindly check the Table Of Contents.
Segment Analysis
Image sensors retained 42% share of the optical sensors market in 2024, buoyed by multi-camera smartphones and ADAS roll-outs. Sony's stacked CMOS technology pushes 120 fps 4-K capture, meeting machine-vision tolerances for factory automation. Fiber-optic sensors, while smaller in absolute revenue, are forecast to post the highest 12.7% CAGR as infrastructure operators shift toward kilometre-scale structural health monitoring. This traction lifts the optical sensors market size for fiber-optic solutions from USD 4.7 billion in 2025 toward USD 8.6 billion by 2030. Distributed acoustic sensing, pipeline security, and perimeter intrusion systems are the chief volume drivers.
Diversification across photoelectric, ambient light, and proximity sensors remains steady, although ASP erosion pressures component suppliers. Ultra-mini proximity modules like Vishay's 0.5 mm-thick device cater to bezel-less phone designs, while global-shutter industrial cameras eliminate motion blur in robotic pick-and-place. Multi-spectral imagers within the "Others" bucket are gaining double-digit growth, supporting precision agriculture and food-safety fluorescence assays.
Cutting-edge photodetectors such as single-photon avalanche diodes (SPADs) and avalanche photodiodes (APDs) sell at premium prices even though they ship in lower volumes than standard photodiodes. SPAD arrays deliver picosecond-level time-of-flight data that LiDAR systems rely on for accurate distance readings in self-driving cars. On the emitter side, design teams are moving from LEDs to VCSELs and edge-emitting lasers to gain higher optical power and tighter spectral control; VCSELs also couple easily into fiber while meeting consumer eye-safety rules.
Optics and filters contribute the most value per gram because their precision coatings and tight tolerances are hard for new entrants to match. Meta-optics is shaking up lens design by replacing multi-element stacks with single, patterned layers that keep performance but trim size and weight. Processing electronics are following the same path: more functions now sit on the sensor die, so edge AI can run locally, cutting latency and easing bandwidth demands.
Optical Sensors Market is Segmented by Sensor Type (Image Sensor, Fiber-Optic Sensor, and More), Sensing Technology (Extrinsic Optical Sensor and More), Component (Photodetectors, Light Sources, and More), Wavelength (Ultraviolet, Visible, and More), Output End-User Application (Consumer Electronics, Industrial Automation & Robotics and More), and Geography. The Market Forecasts are Provided in Terms of Value (USD).
Geography Analysis
Asia-Pacific accounted for 33% of 2024 revenue, reflecting its tight coupling of component fabs, module assembly, and consumer electronics brands. Contract manufacturers in China and Vietnam now produce proximity-sensor die at sub-USD 0.09 ASP, reinforcing the region's cost leadership. Japan's precision optics ecosystem supports automotive LiDAR modules meeting AEC-Q102 grade, while South Korea's foundries push the envelope on stacked-image-sensor yields.
Europe's outlook centers on regulatory-driven applications. German Tier-1 suppliers are booking long-term contracts for NIR imaging arrays that comply with Euro NCAP vision-system mandates. Fiber-optic gas-leak monitoring around North Sea platforms is expanding as EU methane-emissions rules tighten. GDPR compliance is steering OEMs toward on-device biometric analysis, supporting intrinsic sensor adoption.
North America continues to test emerging concepts ahead of other regions. Venture funding into photonic start-ups exceeded USD 700 million in 2024-2025, with a focus on edge-AI optical links. Environmental agencies deploy distributed fiber networks for methane quantification, often financed through green-bond issuances. Meanwhile, Saudi Arabia and the UAE are installing hyperspectral camera arrays across smart-city projects, driving the Middle East's 13.6% CAGR outlook.
- ams-OSRAM AG
- Sony Group Corporation
- Hamamatsu Photonics K.K.
- ON Semiconductor Corp.
- ROHM Co., Ltd.
- SICK AG
- Keyence Corporation
- Teledyne Technologies Inc.
- STMicroelectronics N.V.
- Vishay Intertechnology Inc.
- Honeywell International Inc.
- IFM Electronic GmbH
- Pepperl + Fuchs SE
- Rockwell Automation Inc.
- Samsung Electronics Co. Ltd.
- Cognex Corporation
- FLIR Systems (Teledyne FLIR)
- Omnivision Technologies Inc.
- Lumentum Holdings Inc.
- Excelitas Technologies Corp.
- Thorlabs, Inc.
Additional Benefits:
- The market estimate (ME) sheet in Excel format
- 3 months of analyst support
TABLE OF CONTENTS
1 INTRODUCTION
- 1.1 Study Assumptions and Market Definition
- 1.2 Scope of the Study
2 RESEARCH METHODOLOGY
3 EXECUTIVE SUMMARY
4 MARKET LANDSCAPE
- 4.1 Market Overview
- 4.2 Market Drivers
- 4.2.1 Miniaturization Demand for Wearable Optics in APAC Consumer Electronics
- 4.2.2 Industrial IoT Adoption Fueling Fiber-optic Sensors in Harsh Environments
- 4.2.3 Automotive ADAS and LiDAR Integration Accelerating NIR Image Sensors in Europe
- 4.2.4 Rapid 5G & Edge-Data-Center Roll-out Requiring High-Speed Optical Sensing
- 4.2.5 Stricter Environmental-Monitoring Regulations Driving Distributed Fiber Sensing in North America
- 4.2.6 Advances in Silicon Photonics Lowering BOM Cost for Integrated Optical Sensors
- 4.3 Market Restraints
- 4.3.1 Supply-chain Constraints for High-purity Silica Preforms
- 4.3.2 Price Sensitivity in Low-end Smartphones Limiting Advanced Proximity Sensors
- 4.3.3 Calibration Complexity of Multi-spectral Sensors Deterring SME Uptake
- 4.3.4 Data-Privacy Concerns Around Biometric Optical Sensors in EU
- 4.4 Value / Supply-Chain Analysis
- 4.5 Regulatory and Technological Outlook
- 4.6 Porter's Five Forces Analysis
- 4.6.1 Bargaining Power of Suppliers
- 4.6.2 Bargaining Power of Buyers
- 4.6.3 Threat of New Entrants
- 4.6.4 Threat of Substitutes
- 4.6.5 Intensity of Competitive Rivalry
- 4.7 Pricing Analysis
- 4.8 Investment and Funding Trends
5 MARKET SIZE AND GROWTH FORECASTS (VALUE)
- 5.1 By Sensor Type
- 5.1.1 Image Sensor
- 5.1.2 Fiber-optic Sensor
- 5.1.3 Photoelectric Sensor
- 5.1.4 Ambient Light & Proximity Sensor
- 5.1.5 Others (Position, Touch, Multi-spectral)
- 5.2 By Sensing Technology
- 5.2.1 Extrinsic Optical Sensor
- 5.2.2 Intrinsic Optical Sensor
- 5.3 By Component
- 5.3.1 Photodetectors (Photodiodes, APDs, SPADs)
- 5.3.2 Light Sources (LED, VCSEL, Laser)
- 5.3.3 Optics and Filters
- 5.3.4 ICs and Processing Electronics
- 5.4 By Wavelength
- 5.4.1 Ultraviolet (100-400 nm)
- 5.4.2 Visible (400-700 nm)
- 5.4.3 Near-Infrared (700-1400 nm)
- 5.4.4 Short-Wave IR / Mid-IR (>1400 nm)
- 5.5 By Output
- 5.5.1 Analog
- 5.5.2 Digital
- 5.6 By End-user Application
- 5.6.1 Consumer Electronics
- 5.6.2 Industrial Automation and Robotics
- 5.6.3 Automotive and Transportation
- 5.6.4 Healthcare and Medical Devices
- 5.6.5 Biometrics and Security
- 5.6.6 Aerospace and Defense
- 5.6.7 Energy and Environmental Monitoring
- 5.7 By Geography
- 5.7.1 North America
- 5.7.1.1 United States
- 5.7.1.2 Canada
- 5.7.1.3 Mexico
- 5.7.2 Europe
- 5.7.2.1 United Kingdom
- 5.7.2.2 Germany
- 5.7.2.3 France
- 5.7.2.4 Italy
- 5.7.2.5 Rest of Europe
- 5.7.3 Asia-Pacific
- 5.7.3.1 China
- 5.7.3.2 Japan
- 5.7.3.3 India
- 5.7.3.4 South Korea
- 5.7.3.5 Rest of Asia-Pacific
- 5.7.4 Middle East
- 5.7.4.1 Israel
- 5.7.4.2 Saudi Arabia
- 5.7.4.3 United Arab Emirates
- 5.7.4.4 Turkey
- 5.7.4.5 Rest of Middle East
- 5.7.5 Africa
- 5.7.5.1 South Africa
- 5.7.5.2 Egypt
- 5.7.5.3 Rest of Africa
- 5.7.6 South America
- 5.7.6.1 Brazil
- 5.7.6.2 Argentina
- 5.7.6.3 Rest of South America
- 5.7.1 North America
6 COMPETITIVE LANDSCAPE
- 6.1 Market Concentration
- 6.2 Strategic Moves (M&A, JV, Product Launch, Funding)
- 6.3 Market Share Analysis
- 6.4 Company Profiles {(includes Global level Overview, Market level overview, Core Segments, Financials as available, Strategic Information, Market Rank/Share for key companies, Products & Services, and Recent Developments)}
- 6.4.1 ams-OSRAM AG
- 6.4.2 Sony Group Corporation
- 6.4.3 Hamamatsu Photonics K.K.
- 6.4.4 ON Semiconductor Corp.
- 6.4.5 ROHM Co., Ltd.
- 6.4.6 SICK AG
- 6.4.7 Keyence Corporation
- 6.4.8 Teledyne Technologies Inc.
- 6.4.9 STMicroelectronics N.V.
- 6.4.10 Vishay Intertechnology Inc.
- 6.4.11 Honeywell International Inc.
- 6.4.12 IFM Electronic GmbH
- 6.4.13 Pepperl + Fuchs SE
- 6.4.14 Rockwell Automation Inc.
- 6.4.15 Samsung Electronics Co. Ltd.
- 6.4.16 Cognex Corporation
- 6.4.17 FLIR Systems (Teledyne FLIR)
- 6.4.18 Omnivision Technologies Inc.
- 6.4.19 Lumentum Holdings Inc.
- 6.4.20 Excelitas Technologies Corp.
- 6.4.21 Thorlabs, Inc.
7 MARKET OPPORTUNITIES AND FUTURE OUTLOOK
- 7.1 White-space and Unmet-need Assessment
 光學感測器市場:按類型、介面和應用分類 - 2026-2032年全球市場預測
 光學感測器市場報告:按類型、工作原理、感測器類型、應用、行業和地區分類(2026-2034 年)
 2026年全球光學感測器市場報告3D彩色共聚焦感測器市場:按產品、應用和最終用戶分類-2026-2032年全球預測奈米級共聚焦色差感測器市場:按產品類型、銷售管道、終端用戶產業和應用分類-2026-2032年全球預測線型色散共焦感測器市場:按產品類型、雷射波長、測量範圍、應用和最終用戶產業分類-2026-2032年全球預測
 光學感測器市場機會、成長要素、產業趨勢分析及2026年至2035年預測
 光學感測器市場分析及預測(至2035年):按類型、產品類型、技術、組件、應用、材料類型、裝置及最終用戶分類
 全球光學感測器市場:按類型、感測器類別、應用和地區分類-市場規模、產業趨勢、機會分析和未來預測(2026-2035 年)
 光學感測市場-全球產業規模、佔有率、趨勢、機會及預測(按類型、方法、操作、技術、最終用途、地區和競爭格局分類,2021-2031年)