


 |
市場調查報告書
商品編碼
1851392
葡萄酒包裝:市場佔有率分析、行業趨勢、統計數據和成長預測(2025-2030 年)Wine Packaging - Market Share Analysis, Industry Trends & Statistics, Growth Forecasts (2025 - 2030) |
||||||
※ 本網頁內容可能與最新版本有所差異。詳細情況請與我們聯繫。
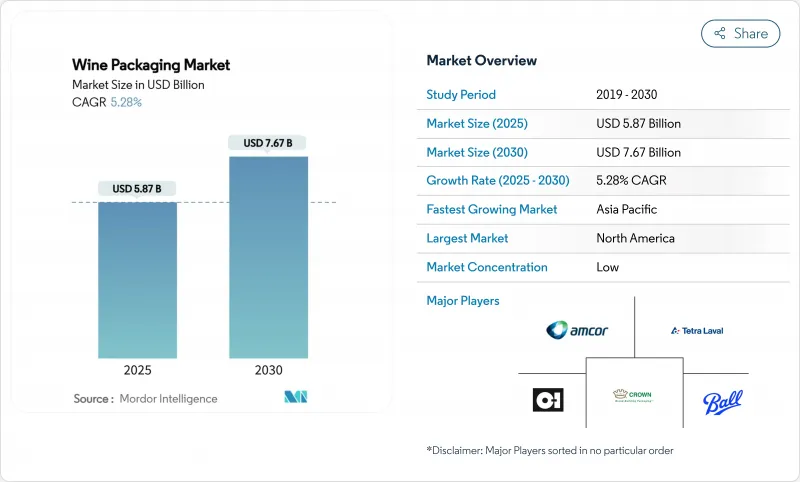
預計到 2025 年,葡萄酒包裝市場規模將達到 58.7 億美元,到 2030 年將達到 76.7 億美元,在此期間的複合年成長率為 5.28%。
玻璃瓶的強勁需求、對輕量化設計的日益成長的興趣,以及罐裝和盒中袋等替代包裝形式的快速普及,共同推動著這一趨勢。中國的優質化、歐洲輕質玻璃的推廣以及北美直銷模式(DtC)的加速發展,正在重塑葡萄酒包裝市場的生產規模和物流經濟格局。從歐盟到2030年實現100%回收的強制要求,到加州提高回收價值,監管壓力持續推動供應商轉向循環材料和節能熔爐,即便玻璃價格依然波動。金屬包裝的可回收性吸引了年輕的行動消費者,而隨著葡萄園對其永續性實踐進行認證,生物基瓶蓋也越來越受歡迎。
全球葡萄酒包裝市場趨勢與洞察
中國葡萄酒優質化推動了對高檔酒瓶的需求。
中國年輕的都市區消費者重視便利性和價格優勢,同時也追求精緻的設計和優良的品質。華東酒莊的桶裝葡萄酒和弗朗西亞酒莊的盒裝葡萄酒等創新產品,既滿足了人們休閒聚會的需求,又沒有降低品牌股權,從而提升了葡萄酒包裝市場的高階定位。
歐洲葡萄酒廠採用輕質玻璃瓶來減少二氧化碳排放
勃根地的碳中和藍圖顯示,瓶子重量是排放的重要因素,而 Verallia 的 300 克波爾多空氣葡萄酒證明,更輕的瓶子可以在保持傳統的同時減少高達 40% 的二氧化碳排放,從而鼓勵葡萄酒包裝市場更廣泛地採用這種做法。
歐盟塑膠包裝稅提高了PET解決方案的成本
PFAS 禁令和再生材料含量強制要求增加了 PET 的合規成本,使其在高階葡萄酒包裝市場競爭力下降。
細分市場分析
由於玻璃具有惰性和高階質感,預計到2024年,玻璃將佔據葡萄酒包裝市場68.22%的佔有率。輕型熔爐的升級改造和玻璃屑比例的提高,有助於玻璃保持其領先地位,同時減少排放。金屬包裝8.43%的複合年成長率反映了鋁的可回收性和快速冷卻的優勢,這些優勢吸引了熱愛戶外活動的消費者,並將塑造未來葡萄酒包裝市場的偏好。隨著監管機構推動100%可回收目標的實現,Frugalpac的紙瓶和PET混合材料正在拓展包裝材料的選擇範圍。
塑膠和紙張技術的進步挑戰著長期以來的等級制度。 Frugalpac 的纖維外殼比玻璃瓶減少 77% 的塑膠用量,碳足跡降低 84%。玻璃製造商正透過試驗電爐和超輕量設計來應對挑戰。鋁瓶利用可重複密封的瓶蓋來延長保鮮期,而生物基 PET 則整合了高達 30% 的再生 PET (rPET),但仍在等待再生材料供應的擴大。
到2024年,傳統瓶裝葡萄酒將佔總銷售量的55.76%,主要用於儲存和禮儀場合。同時,罐裝葡萄酒正以7.88%的複合年成長率成長,以滿足消費者對單次飲用便利性和體育場館相關規定的需求。盒中袋包裝(Bag-in-box)產品線正逐步實現規模經濟,佔瑞典葡萄酒銷售的56%,反映了高階葡萄酒的發展趨勢。
寶特瓶憑藉著Alpla的隔離層,成功佔據了一席之地,保存期限延長了六個月;而軟包裝則在節日市場搶佔了越來越多的佔有率。符合歐盟數位化要求的智慧標籤被應用於瓶罐包裝,增強了葡萄酒包裝市場的可追溯性,並強化了全通路策略。
區域分析
北美仍然是最大的銷售市場。在加州,直接面對消費者的法律和擴大的回收範圍整合了5美分和10美分的押金制度,推動葡萄酒包裝市場轉向更便於路邊回收的設計。歐洲的政策要求在2030年實現100%可回收,這刺激了對電爐和袋中袋包裝創新技術的投資,從而減少了運輸排放。
亞太地區將在2030年前引領成長。中國的優質化將結合精美玻璃瓶和經濟實惠的包裝盒,而澳洲的補貼政策將有利於輕質寶特瓶瓶和紙瓶的使用,從而推動該地區葡萄酒包裝市場的發展。便捷的生鮮電商將與環保行銷結合,吸引年輕消費者。
中東/非洲和南美洲提供了新的發展機會。溫暖的氣候有利於採用輕盈且抗氧化阻隔性更佳的包裝形式,而出口商則採用既能最大限度降低運輸成本又能符合歐盟法規的包裝。國內生產商探索使用再生PET和罐裝生產線來拓展新的消費群體,顯示葡萄酒包裝領域的創新正在全球蔓延。
其他福利:
- Excel格式的市場預測(ME)表
- 3個月的分析師支持
目錄
第1章 引言
- 研究假設和市場定義
- 調查範圍
第2章調查方法
第3章執行摘要
第4章 市場情勢
- 市場概覽
- 市場促進因素
- 中國葡萄酒優質化推動了對高檔酒瓶的需求。
- 歐洲葡萄酒廠採用輕質玻璃瓶來減少二氧化碳排放
- 北歐電商通路迅速採用盒中袋包裝
- 美國直接面對消費者(DTC)管道的興起將加速現場包裝的發展。
- 大洋洲罐裝和PET單份裝葡萄酒的零售需求激增
- 葡萄園永續性認證推動生物基瓶塞的普及
- 市場限制
- 歐盟塑膠包裝稅提高了PET解決方案的成本
- 全球再生材料供不應求限制了rPET葡萄酒瓶的推廣應用。
- 替代封口方式有較高的氧氣傳輸風險,阻礙了優質葡萄酒的傳播。
- 堿灰價格波動推高了玻璃瓶成本。
- 供應鏈分析
- 技術展望
- 監理展望
- 波特五力分析
- 供應商的議價能力
- 買方的議價能力
- 新進入者的威脅
- 替代品的威脅
- 競爭對手之間的競爭
第5章 市場規模與成長預測
- 依材料類型
- 玻璃
- 塑膠
- 金屬
- 紙
- 依產品類型
- 玻璃瓶
- 寶特瓶
- 襯袋紙盒
- 能
- 小袋
- 按封閉類型
- 天然軟木
- 技術/合成軟木
- 螺帽
- 皇冠帽
- 其他(T型止動器、Binolock)
- 按葡萄酒類型
- 無氣泡葡萄酒
- 氣泡酒
- 加烈葡萄酒葡萄酒和甜葡萄酒
- 低酒精/無酒精葡萄酒
- 按產能
- 少於 375 毫升
- 375-750 mL
- 750-1,500 mL
- 1500毫升或更多
- 透過分銷管道
- 直銷
- 間接銷售
- 按地區
- 北美洲
- 美國
- 加拿大
- 墨西哥
- 歐洲
- 德國
- 英國
- 法國
- 義大利
- 西班牙
- 俄羅斯
- 其他歐洲地區
- 亞太地區
- 中國
- 印度
- 日本
- 韓國
- 澳洲、紐西蘭
- 亞太其他地區
- 中東和非洲
- 中東
- 阿拉伯聯合大公國
- 沙烏地阿拉伯
- 土耳其
- 其他中東地區
- 非洲
- 南非
- 奈及利亞
- 埃及
- 其他非洲地區
- 南美洲
- 巴西
- 阿根廷
- 其他南美洲
- 北美洲
第6章 競爭情勢
- 市場集中度
- 策略趨勢
- 市佔率分析
- 公司簡介
- Owens-Illinois Inc.(OI)
- Verallia SA
- Ardagh Group SA
- Saverglass SAS
- Vetropack Holding AG
- BA Glass Group
- Consol Glass Pty Ltd
- Guala Closures Group
- Amorim Cork, SA
- Vinventions LLC(Nomacorc)
- Amcor plc
- Ball Corporation
- TricorBraun Inc.
- Tetra Laval International SA
- SIG Combibloc Group AG
- Scholle IPN(Sealed Air)
- Liqui-Box(Sealed Air)
- International Paper Company
- G3 Enterprises Inc.
- Maverick Enterprises Inc.
- Encore Glass Inc.
- Smurfit WestRock
- Crown Holdings, Inc.
第7章 市場機會與未來展望
The wine packaging market size reached USD 5.87 billion in 2025 and is forecast to climb to USD 7.67 billion by 2030, advancing at a 5.28% CAGR over the period.
Strong glass bottle demand, growing interest in lightweight designs and the rapid adoption of alternative formats such as cans and bag-in-box options are steering this trajectory. Premiumisation in China, lightweight glass roll-outs in Europe, and direct-to-consumer (DtC) acceleration in North America are reshaping production scale and logistics economics across the wine packaging market. Regulatory pressure-from the European Union's 100%-recyclable-by-2030 mandate to California's redemption-value expansion-continues to push suppliers toward circular materials and energy-efficient furnaces, even as glass price volatility persists. Metal packaging's recyclability appeals to younger, mobile consumers while bio-based closures gain traction as vineyards certify sustainability practices.
Global Wine Packaging Market Trends and Insights
Premiumisation of Wine in China Elevating Demand for Designer Bottles
Young urban consumers in China value convenience and affordability yet still associate sophisticated design with quality. Innovations such as Huadong Winery's keg wine and Franzia's boxed offerings support casual gatherings without diluting brand equity, lifting premium-styled alternatives within the wine packaging market.
Lightweight Glass Bottle Adoption by European Wineries to Cut CO2
Bourgogne's carbon-neutral roadmap exposed bottle weight as a critical emissions driver; Verallia's 300 g Bordeaux Air proves that a lighter bottle can retain tradition while trimming up to 40% of CO2, propelling broader adoption across the wine packaging market.
EU Plastic Packaging Taxes Increasing Cost of PET Solutions
Mandatory recycled-content quotas and PFAS bans inflate compliance costs, making PET less competitive for premium lines within the wine packaging market.
Other drivers and restraints analyzed in the detailed report include:
- Rapid Uptake of Bag-in-Box Formats in the Nordics' E-grocery Channel
- Rise of DtC Channels in the US Accelerating On-premise Ready-to-Ship Packaging
- Global Recyclate Supply Shortages Limiting rPET Wine Bottle Roll-outs
For complete list of drivers and restraints, kindly check the Table Of Contents.
Segment Analysis
Glass accounted for 68.22% of the wine packaging market in 2024 due to its inert nature and premium perception. Lightweight furnace upgrades and higher cullet ratios help maintain leadership while cutting emissions. Metal's 8.43% CAGR reflects aluminum's recyclability and chill-speed advantages, luring outdoor-oriented consumers and shaping future preference across the wine packaging market. Paper bottles from Frugalpac and PET hybrids broaden the material field as regulators push 100% recyclable targets.
Plastic and paper advances test longstanding hierarchies. Frugalpac's fibre shell uses 77% less plastic and holds an 84% lower carbon footprint than glass, making it an attractive alternative in the wine packaging industry. Glass manufacturers counter by piloting electric furnaces and ultra-light designs. Aluminum bottles leverage resealable tops to extend freshness, while bio-based PET integrates up to 30% rPET yet awaits greater recyclate supply.
Traditional bottles delivered 55.76% of 2024 revenue, an anchor for cellaring and ritual. Still, cans are growing at 7.88% CAGR, meeting single-serve convenience and stadium regulations within the wine packaging market. Bag-in-box lines achieve scale benefits and hold 56% of Swedish volume, illustrating premium-grade evolution.
PET bottles secure niche roles with six-month shelf life thanks to ALPLA's barrier layers, while pouches win festival share. Smart labels that satisfy EU digital mandates surface on bottles and cans alike, enriching traceability and reinforcing the wine packaging market's omnichannel strategy.
The Wine Packaging Market Report is Segmented by Material Type (Glass, Plastic, and More), Product Type (Glass Bottles, Plastic Bottles, and More), Closure Type (Natural Cork, and More), Wine Type (Still Wine, Sparkling Wine, and More), Capacity ( Less Than Equal To 375 ML, 375-750 ML, and More), Distribution Channel (Direct Sales, Indirect Sales), and Geography. The Market Forecasts are Provided in Terms of Value (USD).
Geography Analysis
North America remain the largest revenue contributor. Robust DtC laws and recycling expansion in California integrate 5- and 10-cent deposits that steer the wine packaging market toward curbside-compatible designs. European policies dictate 100% recyclability by 2030, sparking investment in electric furnaces and bag-in-box innovation that lowers freight emissions.
Asia-Pacific leads growth through 2030. China's premiumisation mixes designer glass with cost-effective boxes, while Australian grants back lightweight PET and paper bottles, accelerating regional momentum for the wine packaging market. E-grocery convenience intertwines with environmental marketing to convert younger consumers.
Middle East and Africa and South America provide emerging pathways. Warmer climates lean toward lighter, oxidation-barrier formats, and exporters deploy packaging that meets EU rules while minimizing freight. Domestic producers explore rPET and canning lines to reach new drinkers, illustrating the global spread of the wine packaging industry's innovations.
- Owens-Illinois Inc. (O-I)
- Verallia SA
- Ardagh Group SA
- Saverglass SAS
- Vetropack Holding AG
- BA Glass Group
- Consol Glass Pty Ltd
- Guala Closures Group
- Amorim Cork, S.A.
- Vinventions LLC (Nomacorc)
- Amcor plc
- Ball Corporation
- TricorBraun Inc.
- Tetra Laval International SA
- SIG Combibloc Group AG
- Scholle IPN (Sealed Air)
- Liqui-Box (Sealed Air)
- International Paper Company
- G3 Enterprises Inc.
- Maverick Enterprises Inc.
- Encore Glass Inc.
- Smurfit WestRock
- Crown Holdings, Inc.
Additional Benefits:
- The market estimate (ME) sheet in Excel format
- 3 months of analyst support
TABLE OF CONTENTS
1 INTRODUCTION
- 1.1 Study Assumptions and Market Definition
- 1.2 Scope of the Study
2 RESEARCH METHODOLOGY
3 EXECUTIVE SUMMARY
4 MARKET LANDSCAPE
- 4.1 Market Overview
- 4.2 Market Drivers
- 4.2.1 Premiumisation of Wine in China Elevating Demand for Designer Bottles
- 4.2.2 Light-weight Glass Bottle Adoption by European Wineries to Cut CO2
- 4.2.3 Rapid Uptake of Bag-in-Box Formats in the Nordics' E-grocery Channel
- 4.2.4 Rise of Direct-to-Consumer (DtC) Channels in the US Accelerating On-premise Ready-to-Ship Packaging
- 4.2.5 Surge in Canned and PET-Single-Serve Wines for Outdoor Consumption in Oceania
- 4.2.6 Vineyard Sustainability Certifications Driving Bio-based Closures Adoption
- 4.3 Market Restraints
- 4.3.1 EU Plastic Packaging Taxes Increasing Cost of PET Solutions
- 4.3.2 Global Recyclate Supply Shortages Limiting rPET Wine Bottle Roll-outs
- 4.3.3 Higher Oxygen Transmission Risk in Alternative Closures Capping Premium-Wine Penetration
- 4.3.4 Volatility in Soda-ash Pricing Inflating Glass Bottle Costs
- 4.4 Supply-Chain Analysis
- 4.5 Technological Outlook
- 4.6 Regulatory Outlook
- 4.7 Porter's Five Forces Analysis
- 4.7.1 Bargaining Power of Suppliers
- 4.7.2 Bargaining Power of Buyers
- 4.7.3 Threat of New Entrants
- 4.7.4 Threat of Substitutes
- 4.7.5 Intensity of Competitive Rivalry
5 MARKET SIZE AND GROWTH FORECASTS (VALUE)
- 5.1 By Material Type
- 5.1.1 Glass
- 5.1.2 Plastic
- 5.1.3 Metal
- 5.1.4 Paper
- 5.2 By Product Type
- 5.2.1 Glass Bottles
- 5.2.2 Plastic Bottles
- 5.2.3 Bag-in-Box
- 5.2.4 Cans
- 5.2.5 Pouches
- 5.3 By Closure Type
- 5.3.1 Natural Cork
- 5.3.2 Technical/Synthetic Cork
- 5.3.3 Screw Caps
- 5.3.4 Crown Caps
- 5.3.5 Others (T-stoppers, Vino-Lok)
- 5.4 By Wine Type
- 5.4.1 Still Wine
- 5.4.2 Sparkling Wine
- 5.4.3 Fortified and Dessert Wine
- 5.4.4 Low and No-Alcohol Wine
- 5.5 By Capacity
- 5.5.1 Less than 375 mL
- 5.5.2 375-750 mL
- 5.5.3 750-1,500 mL
- 5.5.4 More than 1,500 mL
- 5.6 By Distribution Channel
- 5.6.1 Direct Sales
- 5.6.2 Indirect Sales
- 5.7 By Geography
- 5.7.1 North America
- 5.7.1.1 United States
- 5.7.1.2 Canada
- 5.7.1.3 Mexico
- 5.7.2 Europe
- 5.7.2.1 Germany
- 5.7.2.2 United Kingdom
- 5.7.2.3 France
- 5.7.2.4 Italy
- 5.7.2.5 Spain
- 5.7.2.6 Russia
- 5.7.2.7 Rest of Europe
- 5.7.3 Asia-Pacific
- 5.7.3.1 China
- 5.7.3.2 India
- 5.7.3.3 Japan
- 5.7.3.4 South Korea
- 5.7.3.5 Australia and New Zealand
- 5.7.3.6 Rest of Asia-Pacific
- 5.7.4 Middle East and Africa
- 5.7.4.1 Middle East
- 5.7.4.1.1 United Arab Emirates
- 5.7.4.1.2 Saudi Arabia
- 5.7.4.1.3 Turkey
- 5.7.4.1.4 Rest of Middle East
- 5.7.4.2 Africa
- 5.7.4.2.1 South Africa
- 5.7.4.2.2 Nigeria
- 5.7.4.2.3 Egypt
- 5.7.4.2.4 Rest of Africa
- 5.7.5 South America
- 5.7.5.1 Brazil
- 5.7.5.2 Argentina
- 5.7.5.3 Rest of South America
- 5.7.1 North America
6 Competitive Landscape
- 6.1 Market Concentration
- 6.2 Strategic Moves
- 6.3 Market Share Analysis
- 6.4 Company Profiles (includes Global level Overview, Market level overview, Core Segments, Financials as available, Strategic Information, Market Rank/Share for key companies, Products and Services, and Recent Developments)
- 6.4.1 Owens-Illinois Inc. (O-I)
- 6.4.2 Verallia SA
- 6.4.3 Ardagh Group SA
- 6.4.4 Saverglass SAS
- 6.4.5 Vetropack Holding AG
- 6.4.6 BA Glass Group
- 6.4.7 Consol Glass Pty Ltd
- 6.4.8 Guala Closures Group
- 6.4.9 Amorim Cork, S.A.
- 6.4.10 Vinventions LLC (Nomacorc)
- 6.4.11 Amcor plc
- 6.4.12 Ball Corporation
- 6.4.13 TricorBraun Inc.
- 6.4.14 Tetra Laval International SA
- 6.4.15 SIG Combibloc Group AG
- 6.4.16 Scholle IPN (Sealed Air)
- 6.4.17 Liqui-Box (Sealed Air)
- 6.4.18 International Paper Company
- 6.4.19 G3 Enterprises Inc.
- 6.4.20 Maverick Enterprises Inc.
- 6.4.21 Encore Glass Inc.
- 6.4.22 Smurfit WestRock
- 6.4.23 Crown Holdings, Inc.
7 Market Opportunities & Future Outlook
- 7.1 White-space and Unmet-need Assessment
 葡萄酒桶市場規模、佔有率和成長分析:按材質、產能、烘焙程度、最終用戶和地區分類-2026-2033年產業預測
 葡萄酒包裝袋市場 - 全球產業規模、佔有率、趨勢、機會、預測:按類型、應用、分銷管道、地區和競爭格局分類,2021-2031年
 可重複使用桶市場:按材料類型、烘焙類型、最終用途行業和地區分類。葡萄酒包裝盒市場:按類型、分銷管道和地區分類
 葡萄酒及汽水配件市場:商機、成長要素、產業趨勢分析及2026-2035年預測
 葡萄酒包裝市場規模、佔有率、趨勢和預測:按材料、包裝類型和地區分類,2026-2034年
 葡萄酒包裝市場:依包裝類型、瓶蓋類型和瓶身尺寸分類-2026-2032年全球預測
 2026年全球葡萄酒桶市場報告木桶市場按應用、最終用戶、木材類型、容量、通路、狀況和烘焙程度分類-2026-2032年全球預測桶材市場:按木材類型、分銷管道、烘烤類型和最終用途分類,全球預測(2026-2032年)