


 |
市場調查報告書
商品編碼
1851391
美國太陽能:市場佔有率分析、行業趨勢、統計數據和成長預測(2025-2030 年)United States Solar Energy - Market Share Analysis, Industry Trends & Statistics, Growth Forecasts (2025 - 2030) |
||||||
※ 本網頁內容可能與最新版本有所差異。詳細情況請與我們聯繫。
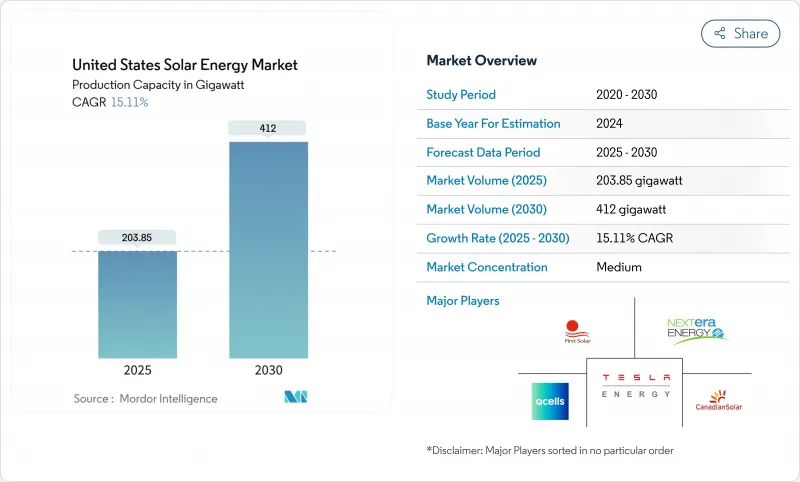
美國太陽能裝置容量市場規模預計將從 2025 年的 203.85 吉瓦成長到 2030 年的 412 吉瓦,預測期(2025-2030 年)的複合年成長率為 15.11%。
以目前的規模,美國太陽能市場將於2025年達到產能飽和,而太陽能光電發電將佔2024年新增發電量的53%,成為美國新增電力容量成長最快的來源。推動這項成長的三大支柱是:根據《通膨控制法案》(IRA)提供的為期10年的穩定稅收優惠;不斷壯大的國內製造業基礎,能夠滿足70%的組件需求;以及企業對低碳購電協議的需求。儘管開發商仍然傾向於公用事業規模的計劃,因為在用電照度地區,平準化成本已降至40美元/兆瓦時以下,但隨著金融機構在許多州推出零首付融資,將投資回收期縮短至7年以內,分散式發電正在加速發展。併網排隊和輸電堵塞仍然是重大障礙,但計劃中的電網投資和光伏儲能混合電站的普及預計將從2026年起緩解這些限制。
美國太陽能市場趨勢與洞察
《通膨控制法案》中的稅收優惠將加速公用事業規模購電協議的達成。
投資再投資法案(IRA)將30%的投資稅額扣抵延長了10年,並引入了生產稅額扣抵,為開發商提供第二個收入來源。結合國內產品和能源社區獎勵稅收抵免,太陽能資源豐富的地區的計劃可以以低於50美元/兆瓦時的價格簽訂長期購電協議(PPA),從而促成了類似微軟與Brookfield達成的10.5吉瓦交易(迄今為止最大的企業清潔能源合約)。從2025年開始實施的學徒制條款也有助於培養技術純熟勞工,並降低數吉瓦計畫的風險。
一對電網邊緣儲能單元提高了計劃的融資可行性。
到2024年底,太陽能-電池混合電站的太陽能發電裝置容量將達到49吉瓦,電池運作將達到3.6吉瓦。電池儲能可以將白天的過剩電力轉移到晚間用電高峰,從而將有效容量係數提高40%以上,這在加州獨立系統營運商(CAISO)和德克薩斯州電力可靠性委員會(ERCOT)的市場中是一項關鍵優勢。目前已有599吉瓦的混合電站計畫正在等待併網核准,顯示金融機構越來越認為,在電網堵塞的節點,獨立式太陽能光電發電並非商業性的最佳選擇。
互連隊列瓶頸會增加前置作業時間
2024年全國併網待建容量已激增至2.6太瓦,平均研究時間超過36個月。加州獨立系統營運商(CAISO)列出了超過200吉瓦的太陽能光電發電專案等待升級,德州電力可靠性委員會(ERCOT)也面臨類似的困境。儘管美國能源部的i2X改革將簡化叢集研究流程,但大多數區域輸電組織至少需要兩年才能實施。
細分市場分析
到2024年,光電發電將主導美國太陽能市場,佔92%的市場佔有率,這主要得益於組件價格低廉且成熟的供應鏈。這一地位為光伏領域拓展基於TOPCon和異質結設計的新型國產電池生產線提供了清晰的路徑。然而,聚光型太陽熱能發電(CSP)具有光伏發電所不具備的熱能儲存和製程熱特性。隨著工業用戶日益減少熱源碳排放,預計到2030年,CSP將以17%的複合年成長率成長。內華達州新月沙丘的復興及其第三代CSP原型機(目標是每千瓦時5美分)證明了即使在日照強度超過7千瓦時/平方米/天的地區,小規模部署CSP也是可行的。
隨著計畫新增超過7吉瓦的TOPCon和HJT產能,美國國內太陽能模組效率預計將從2024年的平均21%提升至25%的全球領先水準。儘管如此,在生產商應對產能推出風險方面,PERC技術在短期內仍具有優勢。 CSP技術可能主要集中在美國西南部,但也有望在煉油廠和水泥廠等需要500攝氏度高溫蒸氣的地區站穩腳跟。隨著這兩種技術的發展,2030年,美國太陽能市場中分配給CSP的發電量可能達到總發電量的約5%,透過發電結構的多元化提高電網韌性。成本平價目標的實現取決於IRA的持續支援以及高溫熔鹽塔授權的簡化。
此市場細分報告按太陽能光伏類型(光伏、聚光型太陽光電)、安裝方式(地面安裝、屋頂安裝、浮體)和最終用途(公用事業規模、商業/工業、住宅)提供市場規模和預測。市場規模和預測以裝置容量(GW)為單位。
其他福利:
- Excel格式的市場預測(ME)表
- 3個月的分析師支持
目錄
第1章 引言
- 研究假設和市場定義
- 調查範圍
第2章調查方法
第3章執行摘要
第4章 市場情勢
- 市場概覽
- 市場促進因素
- 《通貨膨脹削減法案》(IRA)的稅收優惠加速了公用事業規模購電協議的達成
- 將電網邊緣儲能與計劃融資能力結合
- 企業淨零排放指令推動工商業購電協議的簽訂
- 社區太陽能計畫擴大了人口稠密州的太陽能普及率
- 降低進口國產學分模組的風險
- 農光互補改善了中西部地區的土地利用經濟效益
- 市場限制
- 互連隊列瓶頸導致前置作業時間超過 36 個月
- 第 201/301 條貿易措施導致模組價格波動
- 西南地區日益嚴重的輸電擁塞阻礙了公用事業計劃的進展
- 技術純熟勞工短缺導致EPC成本較去年同期上漲超過18%。
- 供應鏈分析
- 監管和政策展望(聯邦+州)
- 技術展望(拓樸複合、異質結電晶體、鈣鈦礦、雙面)
- 波特五力模型
- 新進入者的威脅
- 供應商的議價能力
- 買方的議價能力
- 替代品的威脅(風能、再生天然氣、長期儲存)
- 競爭對手之間的競爭
- PESTEL 分析
第5章 市場規模與成長預測
- 按類型
- 光伏(PV)
- 聚光太陽能發電(CSP)
- 按安裝類型
- 地面安裝
- 屋頂
- 浮體式太陽能
- 按最終用途
- 實用規模
- 商業和工業
- 住房
第6章 競爭情勢
- 市場集中度
- 策略性舉措(併購、夥伴關係、購電協議)
- 市場佔有率分析(主要企業的市場排名/佔有率)
- 公司簡介
- First Solar Inc.
- NextEra Energy Inc.
- SunPower Corporation
- Hanwha Q CELLS USA Corp.
- Canadian Solar Inc.
- JinkoSolar Holding Co. Ltd.
- Tesla Energy
- Sunrun Inc.
- 8minute Solar Energy
- SOLV Energy LLC
- Mortenson Construction
- Rosendin Electric Inc.
- Renewable Energy Systems Americas
- Brookfield Renewable US
- EDF Renewables North America
- Enphase Energy Inc.
- Trina Solar Ltd.
- LONGi Solar
- REC Group(REC Solar Norway AS)
- Array Technologies Inc.
- Nextracker Inc.
第7章 市場機會與未來展望
The United States Solar Energy Market size in terms of installed base is expected to grow from 203.85 gigawatt in 2025 to 412 gigawatt by 2030, at a CAGR of 15.11% during the forecast period (2025-2030).
At this scale, the United States solar energy market size for 2025 positions solar as the country's fastest-growing source of new electric capacity, with photovoltaic (PV) installations representing 53% of all generation additions logged during 2024 .Growth rests on three pillars: stable 10-year tax incentives under the Inflation Reduction Act (IRA), a swelling domestic manufacturing base that can now supply 70% of module demand, and corporate demand for low-carbon power purchase agreements. Developers continue to favor utility-scale projects because levelized costs have fallen below USD 40/MWh in high-irradiance regions, yet distributed generation is accelerating as lenders roll out zero-down financing that cuts payback periods to fewer than seven years in many states. Interconnection queues and transmission congestion remain the chief speed bumps, but planned grid investments and the adoption of hybrid solar-plus-storage plants are expected to ease curtailment pressures from 2026 forward.
United States Solar Energy Market Trends and Insights
Inflation Reduction Act tax incentives accelerating utility-scale PPAs
The IRA extended the 30% investment tax credit for a decade and introduced production tax credits that offer developers a second monetization route. Paired with bonus credits for domestic content and energy communities, projects in sun-rich regions can sign long-term PPAs below USD 50/MWh, fostering deals such as Microsoft's 10.5 GW agreement with Brookfield-the largest corporate clean-power contract to date. Apprenticeship stipulations that start in 2025 are also building a skilled labor pipeline, which helps de-risk multi-gigawatt pipelines.
Grid-edge storage pairing enhancing project bankability
Hybrid solar-plus-storage plants reached 49 GW of PV and 3.6 GW of batteries in operation by end-2024. Storage raises effective capacity factors to over 40% by shifting excess midday output into evening peaks, a key advantage in CAISO and ERCOT markets. Interconnection queues already list 599 GW of proposed hybrid capacity, signifying that financiers increasingly view standalone solar as commercially sub-optimal in congested nodes.
Interconnection queue bottlenecks lengthening lead times
The national queue swelled to 2.6 TW in 2024, with average study times surpassing 36 months. CAISO lists more than 200 GW of solar awaiting upgrades, while ERCOT experiences similar logjams. DOE's i2X reforms will streamline cluster studies, yet most regional transmission organizations need at least two years to implement them.
Other drivers and restraints analyzed in the detailed report include:
- Corporate net-zero mandates spurring commercial & industrial PPAs
- Community-solar programs expanding access
- Section 201/301 trade actions causing price volatility
For complete list of drivers and restraints, kindly check the Table Of Contents.
Segment Analysis
Solar PV dominated the United States solar energy market in 2024, holding 92% share thanks to low module costs and mature supply chains. This position gave the segment a clear runway to scale new domestic cell lines based on TOPCon and heterojunction designs. However, concentrated solar power (CSP) offers thermal storage and process-heat attributes that PV lacks, leading to a forecast 17% CAGR for CSP through 2030 as more industrial users decarbonize heat streams. Nevada's Crescent Dunes revival and Gen3 CSP prototypes targeting 5 cents/kWh illustrate how niche adoption can still be material where direct-normal irradiance exceeds 7 kWh/m2/day.
Planned TOPCon and HJT capacity expansions exceeding 7 GW should raise domestic module efficiency from a 2024 average of 21% toward the global frontier of 25%. Even so, the short-term edge remains with PERC as producers manage ramp-up risk. CSP will likely stay concentrated in the Southwest but could gain footholds at refineries or cement plants that need 500 °C steam. As both technologies grow, the United States solar energy market size allocated to CSP may reach about 5% of total capacity by 2030, improving grid resilience through diversified generation profiles. Cost-parity targets rely on continued IRA support and streamlined permitting for high-temperature molten salt towers.
The United States Solar Energy Market Report is Segmented by Type (Solar Photovoltaic and Concentrated Solar Power), Mounting Type (Ground-Mounted, Rooftop, and Floating Solar), and End-Use (Utility-Scale, Commercial and Industrial, and Residential). The Market Sizes and Forecasts are Provided in Terms of Installed Capacity (GW).
List of Companies Covered in this Report:
- First Solar Inc.
- NextEra Energy Inc.
- SunPower Corporation
- Hanwha Q CELLS USA Corp.
- Canadian Solar Inc.
- JinkoSolar Holding Co. Ltd.
- Tesla Energy
- Sunrun Inc.
- 8minute Solar Energy
- SOLV Energy LLC
- Mortenson Construction
- Rosendin Electric Inc.
- Renewable Energy Systems Americas
- Brookfield Renewable US
- EDF Renewables North America
- Enphase Energy Inc.
- Trina Solar Ltd.
- LONGi Solar
- REC Group (REC Solar Norway AS)
- Array Technologies Inc.
- Nextracker Inc.
Additional Benefits:
- The market estimate (ME) sheet in Excel format
- 3 months of analyst support
TABLE OF CONTENTS
1 Introduction
- 1.1 Study Assumptions & Market Definition
- 1.2 Scope of the Study
2 Research Methodology
3 Executive Summary
4 Market Landscape
- 4.1 Market Overview
- 4.2 Market Drivers
- 4.2.1 Inflation Reduction Act (IRA) Tax Incentives Accelerating Utility-Scale PPAs
- 4.2.2 Grid?Edge Storage Pairing Enhancing Project Bankability
- 4.2.3 Corporate Net-Zero Mandates Spurring C&I Power-Purchase Agreements
- 4.2.4 Community-Solar Programs Expanding Access in High-Population States
- 4.2.5 Domestic Manufacturing Credits Cutting Module Import Risk
- 4.2.6 Agrivoltaics Improving Land-Use Economics in the Midwest
- 4.3 Market Restraints
- 4.3.1 Interconnection Queue Bottlenecks Increasing Lead-Times Beyond 36 Months
- 4.3.2 Section 201/301 Trade Actions Causing Module-Price Volatility
- 4.3.3 Rising Transmission Congestion Curtailing Southwest Utility Projects
- 4.3.4 Skilled-Labor Shortage Inflating EPC Costs by greater than 18 % YoY
- 4.4 Supply Chain Analysis
- 4.5 Regulatory & Policy Outlook (Federal + State)
- 4.6 Technological Outlook (TOPCon, HJT, Perovskites, Bifacial)
- 4.7 Porter's Five Forces
- 4.7.1 Threat of New Entrants
- 4.7.2 Bargaining Power of Suppliers
- 4.7.3 Bargaining Power of Buyers
- 4.7.4 Threat of Substitutes (Wind, RNG, Long-Duration Storage)
- 4.7.5 Competitive Rivalry
- 4.8 PESTLE Analysis
5 Market Size & Growth Forecasts
- 5.1 By Type
- 5.1.1 Solar Photovoltaic (PV)
- 5.1.2 Concentrated Solar Power (CSP)
- 5.2 By Mounting Type
- 5.2.1 Ground-Mounted
- 5.2.2 Rooftop
- 5.2.3 Floating Solar
- 5.3 By End-Use
- 5.3.1 Utility-Scale
- 5.3.2 Commercial and Industrial
- 5.3.3 Residential
6 Competitive Landscape
- 6.1 Market Concentration
- 6.2 Strategic Moves (M&A, Partnerships, PPAs)
- 6.3 Market Share Analysis (Market Rank/Share for key companies)
- 6.4 Company Profiles (includes Global level Overview, Market level overview, Core Segments, Financials as available, Strategic Information, Products & Services, and Recent Developments)
- 6.4.1 First Solar Inc.
- 6.4.2 NextEra Energy Inc.
- 6.4.3 SunPower Corporation
- 6.4.4 Hanwha Q CELLS USA Corp.
- 6.4.5 Canadian Solar Inc.
- 6.4.6 JinkoSolar Holding Co. Ltd.
- 6.4.7 Tesla Energy
- 6.4.8 Sunrun Inc.
- 6.4.9 8minute Solar Energy
- 6.4.10 SOLV Energy LLC
- 6.4.11 Mortenson Construction
- 6.4.12 Rosendin Electric Inc.
- 6.4.13 Renewable Energy Systems Americas
- 6.4.14 Brookfield Renewable US
- 6.4.15 EDF Renewables North America
- 6.4.16 Enphase Energy Inc.
- 6.4.17 Trina Solar Ltd.
- 6.4.18 LONGi Solar
- 6.4.19 REC Group (REC Solar Norway AS)
- 6.4.20 Array Technologies Inc.
- 6.4.21 Nextracker Inc.
7 Market Opportunities & Future Outlook
- 7.1 White-Space & Unmet-Need Assessment
 2026年全球太陽能市場報告
 太陽能發電系統市場分析及預測(至2035年):依類型、產品類型、服務、技術、組件、應用、安裝類型、最終用戶、功能及設備分類
 東南亞太陽能:市場佔有率分析、產業趨勢與統計、成長預測(2026-2031)泰國太陽能:市場佔有率分析、產業趨勢與統計、成長預測(2026-2031)西班牙太陽能:市場佔有率分析、行業趨勢和統計數據、成長預測(2026-2031 年)越南太陽能市場:市場佔有率分析、產業趨勢與統計、成長預測(2026-2031年)
 太陽能解決方案市場 - 全球產業規模、佔有率、趨勢、機會及預測(按類型、應用、地區和競爭格局分類,2021-2031年)印尼太陽能市場:市場佔有率分析、產業趨勢與統計、成長預測(2026-2031)義大利太陽能市場:市場佔有率分析、產業趨勢與統計、成長預測(2026-2031)菲律賓太陽能市場:市場佔有率分析、產業趨勢與統計、成長預測(2026-2031年)