


 |
市場調查報告書
商品編碼
1851380
甲醇:市場佔有率分析、產業趨勢、統計數據和成長預測(2025-2030 年)Methanol - Market Share Analysis, Industry Trends & Statistics, Growth Forecasts (2025 - 2030) |
||||||
※ 本網頁內容可能與最新版本有所差異。詳細情況請與我們聯繫。
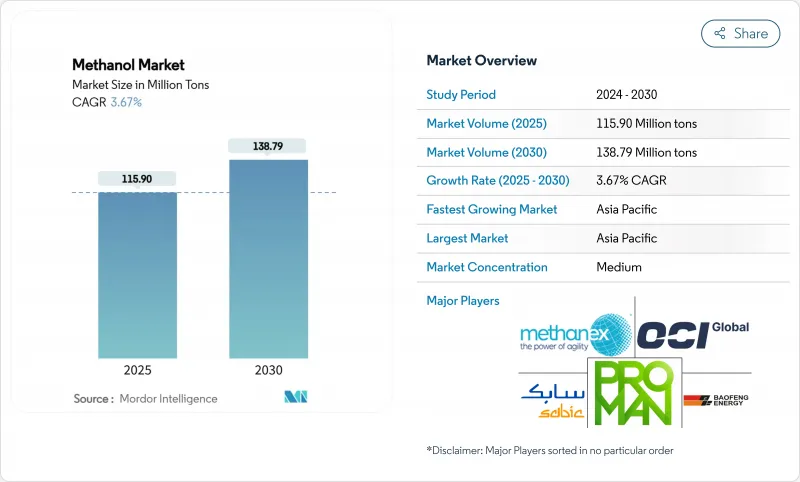
預計到 2025 年甲醇市場規模將達到 1.159 億噸,到 2030 年將達到 1.3879 億噸,在預測期(2025-2030 年)內複合年成長率為 3.67%。
整體數據掩蓋了區域差異:大西洋盆地的價格在計劃外停產後保持堅挺,而亞洲現貨價格走軟,擴大了交易者的套利空間。中國不斷擴大的甲醇制烯烴(MTO)產能、北美「超大型」工廠以及激增的船用燃料需求,共同支撐了市場成長。可再生甲醇計劃具有巨大的成長潛力,但認證延遲和基礎設施缺口限制了近期供應的擴張。然而,對低碳生產和船用轉化技術的持續投資,將支撐甲醇市場在中期內保持穩定發展。
全球甲醇市場趨勢與洞察
中國、美國和新興亞洲地區的石化產能擴張
隨著煉油廠轉向化工原料,甲醇需求不斷成長。中國綜合煉油廠預計2024年原油加工能力將達到創紀錄的1,480萬桶/日。同時,美國正在建造「超大型」甲醇工廠,以供應中國的甲醇製油(MTO)裝置,從而形成一條跨太平洋價值鏈,這將改變傳統的貿易格局。新興亞洲生產商正在效仿這一模式,多個煤製甲醇項目正在建設中。這些計劃將共同提升該地區的甲醇自給率,同時也將需求成長與甲醇市場基本面緊密連結起來。預計到2030年,這項動態將新增約800萬噸甲醇消費量,鞏固亞太地區在全球國際收支平衡的中心地位。
推動海洋產業向低碳燃料轉型
2023年,可使用甲醇的船舶訂單量達到138艘,超過了可使用液化天然氣(LNG)的船舶訂單量130艘。 2025年初,訂單量又增加了23艘,而像馬士基這樣的大型航運公司計劃在2027年擁有25艘雙燃料貨櫃船,預計每年可減少150萬噸二氧化碳排放。可再生甲醇可將船舶生命週期溫室氣體排放減少高達95%,符合國際海事組織(IMO)2024年生命週期強度指引的要求。船舶採用甲醇的快速速度超過了實際燃料供應速度,這支撐了強勁的需求預期,並增強了甲醇市場的長期發展動力。
原物料價格波動
2024年,天然氣價格波動劇烈,地緣政治緊張局勢影響了歐洲和亞洲的液化天然氣基準價格,並推高了依賴進口地區的甲醇生產成本。尤其是在歐洲,與北美和中東的工廠相比,天然氣供應不穩定的生產商面臨利潤空間壓縮的困境。由於天然氣仍佔甲醇原料的65%,甲醇市場極易受到這些波動的影響。價格波動也使新建產能的投資決策更加複雜,並降低了下游買家的價格透明度。儘管避險和整合策略可以部分抵銷風險,但持續的波動會削弱近期的成長前景。
細分市場分析
到2024年,天然氣將佔所有原料的65%。海恩斯維爾和二疊紀盆地頁岩氣的強勁產量支撐了具有成本競爭力的生產,確保了甲醇市場的穩定供應。生物甲醇和電甲醇的可再生能源結合,標誌著甲醇產業的轉型,目前已宣布的210個計劃預計到2030年產能將達到3,570萬噸。
預計到2030年,天然氣仍將是主要的甲醇原料,但隨著經認證的綠色替代燃料因其溢價而受到航運和化學客戶的青睞,其市場佔有率將逐漸萎縮。甲醇市場受惠於這兩種成長趨勢:傳統企業利用原料優勢獲利,而率先採用可再生技術的企業則獲得更高的利潤率和品牌差異化優勢。
至2024年,包括機油轉化燃料油(MTO)、汽油調合燃料和船用燃料在內的能源相關應用將佔甲醇消費量的54%,凸顯其對甲醇市場動態的影響。光是中國甲醇制烯烴產業的蓬勃發展,就將在2024年額外消耗400萬噸甲醇,進一步增強該地區在全球貿易中的影響力。
儘管目前船用燃料的需求量不大,但其市佔率卻相當可觀。雙燃料訂單噸位預測,到2030年,船用燃料油的需求量將每年增加700萬噸,這意味著甲醇在船舶應用領域的市場規模可能與現有能源用途的市場規模相媲美。甲醇在燃料和化學品領域的多功能性有助於平抑週期性波動,從而增強該行業的韌性。
區域分析
到2024年,亞太地區將佔全球甲醇消費量的78%(約90,400千噸)。中國的煤製烯烴技術、印尼B40生質柴油的推廣以及東南亞地區計畫中的產能擴張,將鞏固該地區的領先地位。預計到2030年,亞太地區甲醇市場規模將以3.86%的複合年成長率成長,這主要得益於航運和可再生燃料等新興需求推動了石化產品需求的成長。亞太地區的甲醇價格與中國的進口價格密切相關,使其成為全球市場情緒的風向標。
北美在甲醇市場中的角色正在轉變。豐富的頁岩氣資源推動了一系列出口導向計劃的發展,其中以路易斯安那州查爾斯湖甲醇公司投資32億美元的計畫為首。美國甲醇產量過去主要用於國內甲醛生產,如今則轉向亞洲甲醇生產商,這重塑了貿易格局,並提供了套利機會。
歐洲和中東採取了不同的策略。歐洲正投資發展電子甲醇,以實現其「Fit for 55」目標,例如Forestal del Atlantico在西班牙的工廠計劃就瞄準了船舶燃料供應市場。相反,中東則加倍投入傳統的天然氣製甲醇設施,並利用其原料優勢向亞洲供應甲醇。這些地區共同造就了一個日益分化的甲醇市場:一部分企業追求低碳溢價,而另一部分企業則力求成本領先。
其他福利:
- Excel格式的市場預測(ME)表
- 3個月的分析師支持
目錄
第1章 引言
- 研究假設和市場定義
- 調查範圍
第2章調查方法
第3章執行摘要
第4章 市場情勢
- 市場概覽
- 市場促進因素
- 中國、美國和新興亞洲地區石化產能擴張
- 海事領域向低碳燃料轉型:全球航運公司採用綠色甲醇
- 東協和拉丁美洲政府強制推行燃料混合燃料政策,並推廣甲醇汽油和二甲醚。
- 擴大甲醇在烯烴生產上的應用
- 丙烯供不應求推高了中東地區對甲醇燃料的需求。
- 市場限制
- 原物料價格波動
- 綠色甲醇認證框架的延誤限制了承購協議的達成。
- 不良健康影響
- 價值鏈分析
- 技術展望
- 波特五力模型
- 供應商的議價能力
- 買方的議價能力
- 新進入者的威脅
- 替代品的威脅
- 競爭程度
- 主要原料產能分析
- 貿易流量分析
- 價格趨勢與預測
第5章 市場規模與成長預測
- 按原料
- 天然氣
- 煤炭
- 可再生原料(生質能、固態廢棄物)
- 其他(二氧化碳、綠氫、石油殘渣、石腦油)
- 透過衍生/應用
- 傳統化學品
- 甲醛
- 醋酸
- 溶劑
- 甲胺
- 其他傳統化學品
- 能源相關
- 甲醇制烯烴(MTO)
- 甲基三級丁基醚(MTBE)
- 汽油混合物
- 二甲醚(DME)
- 生質柴油
- 傳統化學品
- 按最終用途行業分類
- 汽車與運輸
- 化學品
- 船用燃料
- 其他(電子產品/家用電器、發電)
- 按年級
- 化學級
- 燃油等級
- 其他(超清潔/電池級、可再生燃料(生物/電甲醇))
- 按地區
- 亞太地區
- 中國
- 印度
- 日本
- 韓國
- 越南
- 泰國
- 印尼
- 馬來西亞
- 澳洲
- 紐西蘭
- 亞太其他地區
- 北美洲
- 美國
- 加拿大
- 墨西哥
- 歐洲
- 德國
- 英國
- 義大利
- 法國
- 土耳其
- 俄羅斯
- 北歐國家
- 西班牙
- 其他歐洲地區
- 南美洲
- 巴西
- 阿根廷
- 哥倫比亞
- 其他南美洲
- 中東和非洲
- 沙烏地阿拉伯
- 卡達
- 阿拉伯聯合大公國
- 伊朗
- 南非
- 奈及利亞
- 埃及
- 其他中東和非洲地區
- 亞太地區
第6章 競爭情勢
- 市場集中度
- 策略趨勢
- 市佔率分析
- 公司簡介
- Atlantic Methanol
- BASF SE
- Carbon Recycling International(CRI)
- Celanese Corporation
- China National Chemical Corporation(ChemChina)
- Coogee
- Enerkem
- Eni SpA
- Gujarat State Fertilizers & Chemicals Limited(GSFC)
- INEOS
- Kaveh Methanol Company
- Kingboard Holdings Limited
- LyondellBasell Industries Holdings BV
- Methanex Corporation
- MITSUBISHI GAS CHEMICAL COMPANY, INC
- Natgasoline
- Ningxia Baofeng Energy Group
- OCI
- Petroliam Nasional Berhad(PETRONAS)
- Proman
- SABIC
- Yankuang Energy
- ZPC Integrated Refining & Petrochemical(Zhejiang)
第7章 市場機會與未來展望
The Methanol Market size is estimated at 115.90 Million tons in 2025, and is expected to reach 138.79 Million tons by 2030, at a CAGR of 3.67% during the forecast period (2025-2030).
The headline figures hide sharp regional contrasts: Atlantic basin prices firmed after unplanned outages, while Asian spot prices softened, widening arbitrage windows for traders. China's expanding methanol-to-olefins (MTO) capacity, North American "mega-mega" plants, and surging marine-fuel demand anchor the growth narrative. Renewable methanol projects offer sizeable upside, yet certification lags and infrastructure gaps restrict near-term supply build-out. Feedstock volatility and uneven policy support add complexity, but sustained investment in low-carbon production and shipping conversions underpin a steady medium-term trajectory for the methanol market.
Global Methanol Market Trends and Insights
Expanding Petrochemical Capacity in China, US and Emerging Asia
Record crude throughput of 14.8 million bpd at Chinese integrated complexes in 2024 has raised methanol demand as refiners pivot toward chemical feedstocks. Concurrently, purpose-built US "mega-mega" methanol plants are geared to serve Chinese MTO units, forging a trans-Pacific value chain that recasts traditional trade flows. Emerging Asian producers are replicating this model, with several coal-to-methanol investments under construction. These projects collectively lift regional self-sufficiency, yet they also keep incremental demand firmly tethered to methanol market fundamentals. The dynamic is expected to add around 8 million tons of new consumption by 2030, cementing Asia-Pacific's centrality to global balances.
Marine Sector Transition to Low-Carbon Fuels
Methanol displaced LNG as the leading alternative fuel for newbuilds in 2023, when 138 methanol-capable vessels were ordered versus 130 LNG-ready ships. In early 2025, the orderbook grew by a further 23 ships, and major carriers such as Maersk now target 25 dual-fuel containerships on the water by 2027, potentially abating 1.5 million tCO2 each year. Renewable methanol can cut lifecycle greenhouse-gas emissions by up to 95%, aligning with the IMO's 2024 life-cycle intensity guidelines. The rapid pace of vessel commitments has outstripped realized fuel supply, underpinning firm demand expectations and reinforcing the long-term pull on the methanol market.
Feedstock Price Volatility
Natural-gas prices swung sharply in 2024 as geopolitical tensions affected European and Asian LNG benchmarks, inflating methanol production costs in import-dependent regions. Producers without secure gas supply, notably in Europe, faced compressed margins relative to plants in North America and the Middle East. The methanol market remains exposed to these swings because natural gas still accounts for 65% of feedstock. Volatility also complicates investment decisions for new capacity and hampers price transparency for downstream buyers. While hedging and integration strategies partly offset the risk, persistent instability tempers near-term growth prospects.
Other drivers and restraints analyzed in the detailed report include:
- Government Mandates on Blended Fuels in ASEAN & LATAM
- Increasing Utilization of Methanol in the Production of Olefins
- Slow Certification Frameworks for Green Methanol
For complete list of drivers and restraints, kindly check the Table Of Contents.
Segment Analysis
Natural gas accounted for 65% of total feedstock in 2024. Robust shale production in the Haynesville and Permian regions underpins cost-competitive output, ensuring reliable supply for the methanol market size. Renewable pathways-biomethanol and e-methanol-together represent 210 announced projects with potential capacity of 35.7 million t by 2030, signalling an incipient shift in the methanol industry.
Natural gas is projected to remain the anchor feedstock through 2030, but its share gradually contracts as certified green alternatives secure premiums from shipping and chemical customers. The methanol market benefits from this dual-track growth: conventional players capitalize on feedstock advantage, while early adopters of renewable technologies command higher margins and brand differentiation.
Energy-related uses-including MTO, gasoline blending and marine fuel-captured 54% of consumption in 2024, underscoring their influence on methanol market dynamics. The methanol-to-olefins boom in China alone absorbed an incremental 4 million t in 2024, reinforcing the region's pull on global trade.
Although currently modest in tonnage, marine fuel demand holds a significant share. Dual-fuel tonnage on order implies an additional 7 million t of annual bunker demand by 2030, indicating that the methanol market size for marine applications could rival existing energy uses. The versatility of methanol across fuels and chemicals thus smooths cyclical swings, enhancing the sector's resilience.
The Methanol Market Report Segments the Industry by Feedstock (Natural Gas, Coal, and More), Derivative/Application (Traditional Chemical and Energy Related), End-Use Industry (Automotive and Transportation, Chemical, and More), Grade (Chemical Grade, Fuel Grade, and More), and Geography (Asia-Pacific, North America, Europe, South America, and Middle East and Africa). The Market Forecasts are Provided in Terms of Volume (tons).
Geography Analysis
Asia-Pacific held a commanding 78% of global methanol consumption in 2024, equal to almost 90,400 kilotons. China's coal-to-olefins build-out, Indonesia's biodiesel B40 rollout and Southeast Asia's planned capacity additions cement regional leadership. The methanol market size in Asia-Pacific is forecast to grow at 3.86% CAGR to 2030 as new demand nodes from shipping and renewable fuels augment petrochemical requirements. Regional pricing remains closely tied to Chinese import parity, making the area the bellwether for global sentiment.
North America's role in the methanol market is undergoing transformation. Abundant shale gas underwrites a wave of export-oriented projects, typified by Lake Charles Methanol's USD 3.2 billion complex in Louisiana. US output, once mainly for domestic formaldehyde, is now squarely aimed at Asian MTO buyers, realigning trade corridors and providing arbitrage optionality.
Europe and the Middle East illustrate divergent strategies. Europe channels investment into e-methanol to meet "Fit for 55" goals, with projects such as Forestal del Atlantico's Spanish plant targeting shipping bunkers. Conversely, the Middle East doubles down on conventional natural-gas-based facilities, leveraging feedstock advantage to supply Asia. Together, these regions shape an increasingly bifurcated methanol market: one side chasing low-carbon premiums, the other maximizing cost leadership.
- Atlantic Methanol
- BASF SE
- Carbon Recycling International (CRI)
- Celanese Corporation
- China National Chemical Corporation (ChemChina)
- Coogee
- Enerkem
- Eni S.p.A.
- Gujarat State Fertilizers & Chemicals Limited (GSFC)
- INEOS
- Kaveh Methanol Company
- Kingboard Holdings Limited
- LyondellBasell Industries Holdings B.V.
- Methanex Corporation
- MITSUBISHI GAS CHEMICAL COMPANY, INC
- Natgasoline
- Ningxia Baofeng Energy Group
- OCI
- Petroliam Nasional Berhad (PETRONAS)
- Proman
- SABIC
- Yankuang Energy
- ZPC Integrated Refining & Petrochemical (Zhejiang)
Additional Benefits:
- The market estimate (ME) sheet in Excel format
- 3 months of analyst support
TABLE OF CONTENTS
1 Introduction
- 1.1 Study Assumptions and Market Definition
- 1.2 Scope of the Study
2 Research Methodology
3 Executive Summary
4 Market Landscape
- 4.1 Market Overview
- 4.2 Market Drivers
- 4.2.1 Expanding Petrochemical Capacity in China, US, and Emerging Asia
- 4.2.2 Marine Sector Transition to Low-Carbon Fuels - Adoption of Green Methanol by Global Carriers
- 4.2.3 Government Mandates on Blended Fuels in ASEAN and LATAM Promoting Methanol Gasoline and DME
- 4.2.4 Increasing Utilization of Methanol in the Production of Olefins
- 4.2.5 On-Purpose Propylene Deficit Strengthening Demand for Methanol-Based Routes in the Middle East
- 4.3 Market Restraints
- 4.3.1 Feedstock Price Volatility
- 4.3.2 Slow Certification Frameworks for Green Methanol Limiting Off-take Agreements
- 4.3.3 Hazardous Impacts on Health
- 4.4 Value Chain Analysis
- 4.5 Technological Outlook
- 4.6 Porter's Five Forces
- 4.6.1 Bargaining Power of Suppliers
- 4.6.2 Bargaining Power of Buyers
- 4.6.3 Threat of New Entrants
- 4.6.4 Threat of Substitute Products and Services
- 4.6.5 Degree of Competition
- 4.7 Production Capacity Analysis by Key Feedstock
- 4.8 Trade Flow Analysis
- 4.9 Pricing Trends and Forecasts
5 Market Size and Growth Forecasts (Volume and Value)
- 5.1 By Feedstock
- 5.1.1 Natural Gas
- 5.1.2 Coal
- 5.1.3 Renewable Feedstock (Biomass, Municipal Solid Waste)
- 5.1.4 Others (CO2, Green Hydrogen, Petroleum Residues and Naphtha)
- 5.2 By Derivative/Application
- 5.2.1 Traditional Chemical
- 5.2.1.1 Formaldehyde
- 5.2.1.2 Acetic Acid
- 5.2.1.3 Solvent
- 5.2.1.4 Methylamine
- 5.2.1.5 Other Traditional Chemicals
- 5.2.2 Energy Related
- 5.2.2.1 Methanol-to-olefin (MTO)
- 5.2.2.2 Methyl Tert-butyl Ether (MTBE)
- 5.2.2.3 Gasoline Blending
- 5.2.2.4 Dimethyl Ether (DME)
- 5.2.2.5 Biodiesel
- 5.2.1 Traditional Chemical
- 5.3 By End-use Industry
- 5.3.1 Automotive and Transportation
- 5.3.2 Chemical
- 5.3.3 Marine Fuel
- 5.3.4 Others (Electronics and Appliances, power generation)
- 5.4 By Grade
- 5.4.1 Chemical Grade
- 5.4.2 Fuel Grade
- 5.4.3 Others (Ultra-Clean/Battery Grade and Renewable (Bio-/E-Methanol))
- 5.5 By Geography
- 5.5.1 Asia-Pacific
- 5.5.1.1 China
- 5.5.1.2 India
- 5.5.1.3 Japan
- 5.5.1.4 South Korea
- 5.5.1.5 Vietnam
- 5.5.1.6 Thailand
- 5.5.1.7 Indonesia
- 5.5.1.8 Malaysia
- 5.5.1.9 Australia
- 5.5.1.10 New Zealand
- 5.5.1.11 Rest of Asia-Pacific
- 5.5.2 North America
- 5.5.2.1 United States
- 5.5.2.2 Canada
- 5.5.2.3 Mexico
- 5.5.3 Europe
- 5.5.3.1 Germany
- 5.5.3.2 United Kingdom
- 5.5.3.3 Italy
- 5.5.3.4 France
- 5.5.3.5 Turkey
- 5.5.3.6 Russia
- 5.5.3.7 Nordics
- 5.5.3.8 Spain
- 5.5.3.9 Rest of Europe
- 5.5.4 South America
- 5.5.4.1 Brazil
- 5.5.4.2 Argentina
- 5.5.4.3 Colombia
- 5.5.4.4 Rest of South America
- 5.5.5 Middle East and Africa
- 5.5.5.1 Saudi Arabia
- 5.5.5.2 Qatar
- 5.5.5.3 United Arab Emirates
- 5.5.5.4 Iran
- 5.5.5.5 South Africa
- 5.5.5.6 Nigeria
- 5.5.5.7 Egypt
- 5.5.5.8 Rest of Middle East and Africa
- 5.5.1 Asia-Pacific
6 Competitive Landscape
- 6.1 Market Concentration
- 6.2 Strategic Moves
- 6.3 Market Share Analysis
- 6.4 Company Profiles (includes Global level Overview, Market level overview, Core Segments, Financials as available, Strategic Information, Market Rank/Share for key companies, Products and Services, and Recent Developments)
- 6.4.1 Atlantic Methanol
- 6.4.2 BASF SE
- 6.4.3 Carbon Recycling International (CRI)
- 6.4.4 Celanese Corporation
- 6.4.5 China National Chemical Corporation (ChemChina)
- 6.4.6 Coogee
- 6.4.7 Enerkem
- 6.4.8 Eni S.p.A.
- 6.4.9 Gujarat State Fertilizers & Chemicals Limited (GSFC)
- 6.4.10 INEOS
- 6.4.11 Kaveh Methanol Company
- 6.4.12 Kingboard Holdings Limited
- 6.4.13 LyondellBasell Industries Holdings B.V.
- 6.4.14 Methanex Corporation
- 6.4.15 MITSUBISHI GAS CHEMICAL COMPANY, INC
- 6.4.16 Natgasoline
- 6.4.17 Ningxia Baofeng Energy Group
- 6.4.18 OCI
- 6.4.19 Petroliam Nasional Berhad (PETRONAS)
- 6.4.20 Proman
- 6.4.21 SABIC
- 6.4.22 Yankuang Energy
- 6.4.23 ZPC Integrated Refining & Petrochemical (Zhejiang)
7 Market Opportunities and Future Outlook
- 7.1 Growing Trends Toward Renewable Methanol
- 7.2 White-space and Unmet-Need Assessment
 甲醇市場:依來源、生產方法、純度、碳強度、應用、終端用戶產業和通路分類-2026-2032年全球市場預測
 全球甲醇市場(2026-2036 年)甲醇市場規模、佔有率、成長及全球產業分析:按類型和應用分類,區域洞察及2026-2034年預測碳再生甲醇市場:依排放源、原料類型、生產技術及最終用戶分類-2026-2032年全球預測甲醇加熱器市場:按類型、容量、安裝方式、應用領域和分銷管道分類,全球預測(2026-2032年)
 甲醇市場分析及預測(至2035年):類型、產品、應用、技術、最終用戶、製程、組件、安裝類型、解決方案和模式全球甲醇市場規模、佔有率、趨勢和成長分析報告(2026-2034年)
 2026年全球二氧化碳再生甲醇市場報告
 甲醇市場-全球產業規模、佔有率、趨勢、機會、預測:按來源、最終用戶、地區和競爭對手分類,2021-2031年二氧化碳再生甲醇市場:依反應路徑、催化劑、原料及最終用途分類,全球預測(2026-2032年)