


 |
市場調查報告書
商品編碼
1851375
電動車充電站:市場佔有率分析、行業趨勢、統計數據和成長預測(2025-2030 年)Electric Vehicle Charging Station - Market Share Analysis, Industry Trends & Statistics, Growth Forecasts (2025 - 2030) |
||||||
※ 本網頁內容可能與最新版本有所差異。詳細情況請與我們聯繫。
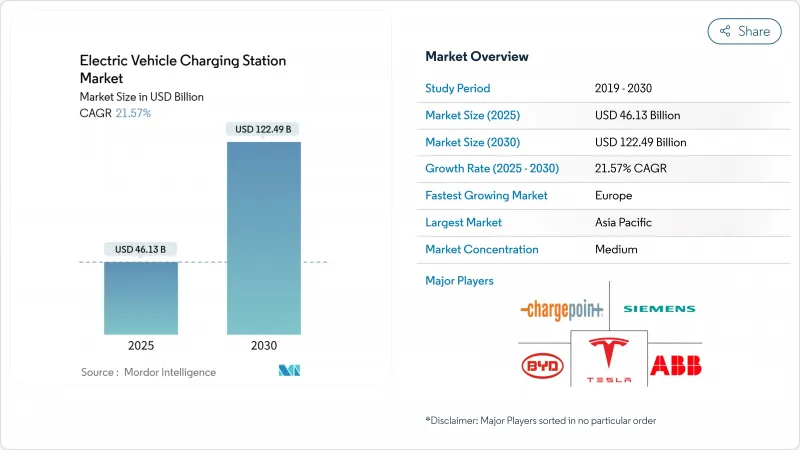
預計到 2025 年,電動車充電站市場規模將達到 461.3 億美元,到 2030 年將達到 1,224.9 億美元,在預測期(2025-2030 年)內,複合年成長率將達到 21.57%。
持續的政策壓力促使內燃機汽車逐步淘汰,電池成本的快速下降推動了電動車和電動車的普及,高速公路快速充電走廊的建設也緩解了里程焦慮,這些都是推動電動車需求飆升的核心因素。大型車隊營運商正在製定多年電氣化目標,以確保充電樁的高運作,而Vehicle-to-Grid)經營模式正在創造新的收入來源,從而提高計劃回報。雖然亞太地區仍佔大部分的安裝量,但歐洲目前正經歷最快的成長,這主要得益於跨境網路合作。在北美,NEVI Formula計畫以及特斯拉向其他品牌開放其超級充電系統正在加速電動車的普及,並提高了人們對基準技術的期望。同時,殼牌等能源巨頭正在關閉加油站,並將資金轉向高功率充電樁,這標誌著策略轉變,將加劇市場競爭。
全球電動車充電站市場趨勢與洞察
政府零排放指令和內燃機禁令時間表
隨著各國政府實施具有約束力的零排放車輛強制規定,並明確規定了具體的充電容量要求,監管正在加速充電基礎設施的部署。歐盟的《替代燃料基礎設施法規》要求成員國根據註冊電動車的數量按比例增加充電容量。同時,加州的《先進清潔車隊規則》要求公共和私營車隊營運商在各自規定的期限內過渡到零排放車輛。中國國家發展和改革委員會計劃在2024年之前,透過在高速公路服務區新增3000個充電樁和5000個停車位來擴大充電基礎設施,從而助力中國佔40.9%的新能源汽車市場發展。沙烏地阿拉伯承諾在2025年建成5萬個充電站,而阿拉伯聯合大公國則設定了2050年實現50%的電動或混合動力汽車保有量的目標。這些強制性規定創造了可預測的需求訊號,為私人資本投資充電基礎設施提供了合理性,從而降低了投資風險並加速了市場擴張。
電池價格/千瓦時下跌推動整體擁有成本與市場持平
隨著電動車的總擁有成本逐漸接近與內燃機汽車持平的關鍵閾值,電池成本的下降正在推動對充電基礎設施的需求。目前,主要採購合約中鋰離子電池組的價格已低於100美元/千瓦時,這有助於電動車在用車量較大的細分市場實現與汽油動力汽車的成本持平。諸如碳化矽逆變器等組件創新提高了充電效率,減少了能量損耗,並使營運商能夠以每千瓦的裝置容量服務更多車輛。更便宜的電池也使得換電站模式成為可能,從而可以將資本投資分散到各個車隊,並擴展電動車充電站產業的業務範圍。電池成本下降和充電效率提高的共同作用,縮短了充電時間,降低了對基礎設施利用率的要求,加速了部署的經濟效益。這是因為電池成本的下降使得更小的充電量和更頻繁的充電成為可能,從而最佳化了營運靈活性。
功率超過150千瓦的充電樁需要較高的初始投資。
高功率充電基礎設施所需的資本支出是其部署的一大障礙,尤其對於獨立營運商和新興市場而言更是如此。 P3集團對歐洲電動卡車充電基礎設施的分析預測,到2030年,歐洲需要4.5萬個公共充電樁和23.5萬個停車場充電樁,並指出高昂的初始資本支出和漫長的電網擴建核准流程是主要挑戰。加州能源委員會的一項研究表明,直流快速充電站面臨巨大的資金籌措挑戰,需要透過降低需求電費每年節省4300美元,並透過太陽能併網每年節省4780至6000美元,才能提高其可行性。部署能夠為重型車輛輸出高達3.75兆瓦功率的兆瓦級充電系統,需要對電力基礎設施進行大規模維修,每個安裝項目的成本將超過100萬美元。高額的資本支出尤其限制了農村和低度開發地區的部署,這些地區的利用率可能不足以抵消投資,從而造成充電基礎設施可用性的地理差異。
細分市場分析
2024年,乘用車佔據了電動車充電站市場佔有率的89.10%,而商用車將以55.47%的複合年成長率(CAGR)實現最快成長,直至2030年,這反映了車輛電氣化強制要求的基礎設施需求。公車是電氣化進程中的關鍵商用領域,由於都市區空氣品質法規和可預測的路線模式,其充電基礎設施的最佳化部署將加速發展。二輪車在新興市場,尤其是印度,正獲得越來越多的關注,電池更換模式已被證明在經濟上可行。卡車由於重量限制和營運需求,需要最先進的充電基礎設施,這推動了高功率充電系統和基於站點的充電解決方案的創新。
商用車電氣化為車隊營運商創造了穩定的需求,使其充電基礎設施投資更具合理性,因為商用車的使用模式可預測,且功率需求高於乘用車。 CharIN 在奧斯陸舉行的 EVS35 大會上正式發布了其兆瓦級充電系統,為高達 3.75 兆瓦的充電容量樹立了新標準,使商用車能夠與柴油動力車輛並駕齊驅。商用車的普及也惠及乘用車基礎設施,因為共用充電走廊可以降低每輛車的基礎設施成本,並提高各類車輛的網路利用率。
至2024年,直流充電站將維持78.70%的電動車充電站市場佔有率,並在預測期內以56.29%的複合年成長率加速成長。橡樹嶺國家實驗室在無線充電技術領域取得了突破性進展,成功實現了透過5吋(約12.7公分)的空氣間隙向乘用車傳輸100千瓦的功率,效率高達96%,展現了顛覆傳統連接器式充電模式的潛力。 22千瓦以下的交流充電主要用於家庭和職場,可以適應更長的充電時間和更慢的充電速度。商用車兆瓦級充電系統的出現將催生一個獨立的超高高功率類別,需要專門的電力基礎設施和冷卻系統。
SAE International 發布了一項新的小型電動車無線充電標準,其中包括一種差分感應定位系統,可實現不同供應商硬體之間的互通性,效率高達 93%。無線充電技術解決了用戶對便利性的擔憂,並透過消除易磨損和人為破壞的實體連接器,降低了基礎設施維護需求。向高功率充電系統的過渡反映了營運商的經濟效益:更短的充電時間可提高充電站利用率並提升投資回報率,尤其是在交通繁忙、土地成本足以支撐高速充電的地區。
區域分析
亞太地區將在2024年以60.70%的市場佔有率引領電動車充電站市場,這主要得益於中國1,282萬個公共充電樁的建設以及每年25%的新增裝置成長。目前,中國已在6000個高速公路服務區設立了國家級充電站,確保了遠距覆蓋,這與中國新能源汽車40.9%的銷售構成比相符。日本正在為重型卡車率先開發兆瓦級充電系統,而印度的二輪車換電中心則展現了低成本出行需求將如何加速充電樁的普及。在貿易摩擦的背景下,韓國正努力成為電池材料的替代供應商,而澳洲則在偏遠走廊地帶投資建造充電站,以連接遙遠的城市間。
歐洲的成長速度最快,到2030年複合年成長率將達到42.68%。 Spark聯盟在25個國家整合了11,000個高功率充電樁,提供透明的價格和100%可再生電力。德國計劃在2030年建成超過100萬個充電樁,符合歐盟將基礎設施分配與電動車註冊掛鉤的規定。挪威仍然是人均充電樁安裝數量的世界領導者,法國則透過低利率貸款鼓勵私人用戶使用充電樁。英國的政策將從2035年起禁止銷售大多數新的汽油動力汽車,並強制要求公共充電樁支持支付卡互通性,這進一步增強了消費者的信心。
在北美,NEVI Formula的50億美元資金籌措20.4萬個公共充電樁。由七家汽車製造商組成的IONNA合資企業將新增3萬個高功率連接器,並對特斯拉超級充電樁維修,使其能夠兼容多個品牌,預計到2030年將創造60億至120億美元的額外收入。跨產業合作將把充電設施與零售配套設施連接起來,並效仿歐洲的服務站模式。
其他福利:
- Excel格式的市場預測(ME)表
- 3個月的分析師支持
目錄
第1章 引言
- 研究假設和市場定義
- 調查範圍
第2章調查方法
第3章執行摘要
第4章 市場情勢
- 市場概覽
- 市場促進因素
- 政府零排放指令和內燃機禁令時間表
- 電池價格(每度)的下降將有助於降低總擁有成本。
- 全球高速公路快速充電走廊發展現狀
- 主要物流公司對車輛電氣化的承諾迅速增加
- 網格服務貨幣化(V2G/V2X)經營模式
- 人工智慧最佳化的充電器安裝提高了使用率
- 市場限制
- 功率超過150千瓦的充電樁需要大量的初始投資。
- 不均衡的授權和公用設施併網時間表
- SiC MOSFET原料瓶頸
- 連網充電器的網路安全漏洞
- 監管環境
- 波特五力模型
- 新進入者的威脅
- 買方的議價能力
- 供應商的議價能力
- 替代品的威脅
- 競爭對手之間的競爭
第5章 市場規模與成長預測
- 按車輛類型
- 搭乘用車
- 商用車輛
- 公車和長途客車
- 按充電器類型
- 交流充電站
- 直流充電站
- 自有車型
- 公共
- 私人住宅
- 平民 - 艦隊/職場
- 按安裝位置
- 自己的家
- 外出/零售
- 公路/交通
- 艦隊倉庫
- 依連接器標準
- CCS
- CHAdeMO
- GB/T
- 特斯拉 NACS
- 無線的
- 按地區
- 北美洲
- 美國
- 加拿大
- 北美其他地區
- 南美洲
- 巴西
- 智利
- 其他南美洲國家
- 歐洲
- 德國
- 英國
- 法國
- 挪威
- 義大利
- 西班牙
- 荷蘭
- 波蘭
- 奧地利
- 俄羅斯
- 其他歐洲地區
- 亞太地區
- 中國
- 日本
- 印度
- 韓國
- 印尼
- 越南
- 菲律賓
- 澳洲
- 紐西蘭
- 亞太其他地區
- 中東和非洲
- 沙烏地阿拉伯
- 阿拉伯聯合大公國
- 埃及
- 土耳其
- 南非
- 其他中東和非洲地區
- 北美洲
第6章 競爭情勢
- 市場集中度
- 策略趨勢
- 市佔率分析
- 公司簡介
- ABB Ltd.
- ChargePoint Inc.
- Tesla Inc.
- Siemens AG
- Schneider Electric Corporation
- Shell Plc.
- ENGIE SA(EVBox)
- BYD Motors Inc.
- Tritium Charging Inc.
- Blink Charging o.
- Delta Electronics Inc.
- Kempower Oyj
- Electrify America, LLC
- IONITY GmbH
- Leviton Manufacturing Co. Inc.
第7章 市場機會與未來展望
The electric vehicle charging station market generated USD 46.13 billion in 2025 and is forecast to reach USD 122.49 billion by 2030, registering a 21.57% CAGR during the forecast period (2025-2030).
Continuous policy pressure to phase out internal-combustion engines, steep battery cost declines that bring total ownership parity forward, and the roll-out of highway fast-charging corridors that neutralize range anxiety are the core forces keeping demand on a steep climb. Large fleet operators are locking in multi-year electrification targets, guaranteeing high charger utilization, while vehicle-to-grid business models create additional revenue layers that lift project returns. Asia-Pacific still accounts for most installations, but Europe now supplies the fastest incremental growth on the back of cross-border network alliances. In North America, the NEVI Formula Program and the opening of Tesla's Supercharger system to other brands accelerate deployment while raising baseline technology expectations. Meanwhile, energy majors like Shell are closing petroleum stations and reallocating capital toward high-power chargers, signaling a strategic shift that tightens competitive intensity.
Global Electric Vehicle Charging Station Market Trends and Insights
Government-backed Zero-emission Mandates and ICE-ban Timelines
Regulatory momentum accelerates charging infrastructure deployment as governments implement binding zero-emission vehicle mandates with specific charging capacity requirements. The EU's Alternative Fuels Infrastructure Regulation mandates that member states increase charging capacity proportionally to EV registrations. At the same time, California's Advanced Clean Fleets Rule requires public and private fleet operators to transition to zero-emission vehicles by sector-specific deadlines. China's National Development and Reform Commission expanded highway service area charging infrastructure by adding 3,000 charging piles and 5,000 parking spaces in 2024, supporting the country's 40.9% new energy vehicle market penetration. Saudi Arabia's commitment to 50,000 charging stations by 2025 and the UAE's target of 50% electric or hybrid vehicles by 2050 extend regulatory pressure to emerging markets. These mandates create predictable demand signals that justify private capital deployment in charging infrastructure, reducing investment risk and accelerating market expansion.
Falling Battery $/kWh Driving TCO Parity
Battery cost reductions approach the critical threshold where electric vehicles achieve total cost of ownership parity with internal combustion engines, catalyzing charging infrastructure demand. Lithium-ion pack prices now edge below USD 100/kWh in leading procurement contracts, helping electric cars reach cost parity with petrol equivalents in usage-heavy segments. Component innovations such as silicon-carbide inverters raise charging efficiency and lower energy losses, allowing operators to serve more vehicles per installed kilowatt. Cheaper batteries also enable swap-station models that spread capex across fleets, broadening service formats within the electric vehicle charging station industry. The convergence of falling battery costs and improved charging efficiency creates a compounding effect where reduced charging times and lower infrastructure utilization requirements accelerate deployment economics. Commercial fleet operators particularly benefit from this dynamic, as reduced battery costs enable smaller, more frequent charging sessions that optimize operational flexibility.
High Upfront CAPEX for More Than 150 kW Chargers
Capital expenditure requirements for high-power charging infrastructure create deployment barriers, particularly for independent operators and emerging markets. The P3 Group analysis of European eTruck charging infrastructure forecasts 45,000 public and 235,000 depot charging points needed by 2030, with high initial capital expenditures and lengthy approval processes for grid expansions identified as primary challenges. The California Energy Commission research demonstrated that DC fast charging stations face significant financing challenges, with potential annual savings of USD 4,300 from demand charge mitigation and USD 4,780 to USD 6,000 from solar integration required to improve viability. The deployment of megawatt charging systems, capable of delivering up to 3.75 MW for heavy-duty vehicles, requires substantial electrical infrastructure upgrades exceeding USD 1 million per installation site. High CAPEX requirements particularly constrain deployment in rural and underserved areas where utilization rates may not justify investment, creating geographic disparities in charging infrastructure availability.
Other drivers and restraints analyzed in the detailed report include:
- Global Build-out of Highway Fast-charging Corridors
- Surging Fleet-Electrification Commitments from Logistics Giants
- Uneven Permitting and Utility Interconnection Timelines
For complete list of drivers and restraints, kindly check the Table Of Contents.
Segment Analysis
Passenger cars commanded 89.10% of the electric vehicle charging station market share in 2024, yet commercial vehicles exhibit the fastest growth at 55.47% CAGR through 2030, reflecting the infrastructure requirements for fleet electrification mandates. Buses represent a critical commercial segment where electrification accelerates due to urban air quality mandates and predictable route patterns that enable optimized charging infrastructure deployment. Two-wheelers gain traction in emerging markets where battery swapping models prove economically viable, particularly in India. Trucks require the most sophisticated charging infrastructure due to weight constraints and operational demands, driving innovation in high-power charging systems and depot-based solutions.
Commercial vehicle electrification creates anchor demand that justifies charging infrastructure investment, as fleet operators provide predictable utilization patterns and higher power requirements than passenger vehicles. CharIN officially launched the Megawatt Charging System at EVS35 in Oslo, establishing standards for charging capacities up to 3.75 MW that enable commercial vehicles to achieve operational parity with diesel counterparts. Passenger car infrastructure benefits from commercial vehicle deployment as shared charging corridors reduce per-unit infrastructure costs and improve network utilization rates across vehicle categories.
DC charging station maintained 78.70% of the electric vehicle charging station market share in 2024, while it accelerated at 56.29% CAGR during the forecast period, driven by operator strategies to reduce charging session duration and increase throughput. Oak Ridge National Laboratory achieved a breakthrough in wireless charging technology, demonstrating 100-kW power transfer to passenger vehicles with 96% efficiency across a five-inch air gap, potentially disrupting traditional connector-based charging. AC charging below 22 kW serves primarily residential and workplace applications where longer dwell times accommodate slower charging speeds, while maintaining cost advantages for installations with lower utilization requirements. The emergence of megawatt charging systems for commercial vehicles creates a distinct ultra-high-power category that requires specialized electrical infrastructure and cooling systems.
SAE International published new standards for wireless light-duty EV charging, including the Differential Inductive Positioning System that enables cross-compatibility among different suppliers' hardware with up to 93% efficiency. Wireless charging technology addresses user convenience concerns and reduces infrastructure maintenance requirements by eliminating physical connectors that experience wear and vandalism. The transition toward higher-power charging systems reflects operator economics. Reduced charging times enable higher station utilization and improved return on investment, particularly in high-traffic locations where land costs justify premium charging speeds.
The Electric Vehicle Charging Station Market Report is Segmented by Vehicle Type (Passenger Cars, Commercial Vehicles, and More), Charger Type (AC Charging Station, and DC Charging Station), Ownership Model (Public, and More), Installation Site (Home, and More), Connector Standard (CCS, and More), and Geography. The Market Forecasts are Provided in Terms of Value (USD).
Geography Analysis
Asia-Pacific leads the electric vehicle charging station market with a 60.70% share in 2024, supported by China's 12.82 million public connectors and a 25% annual installation increase. National programs now equip 6,000 highway service areas, ensuring long-distance coverage mirrors the country's 40.9% new-energy vehicle sales mix. Japan pioneers megawatt systems for heavy trucks, while India's two-wheeler battery-swapping hubs show how low-cost mobility needs can accelerate charger density. South Korea is positioning itself as an alternative battery-material supplier amid trade tensions, and Australia funds remote-area corridor sites to bridge its vast intercity distances.
Europe shows the fastest regional growth at 42.68% CAGR to 2030. The Spark Alliance integrates 11,000 high-power connectors across 25 countries, offering transparent pricing and 100% renewable electricity. Germany's plan for more than 1 million new charging points by 2030 aligns with EU regulations that tie infrastructure quotas to EV registrations. Norway retains the world's highest per-capita charger count, while France uses low-interest loans to spur private deployments. UK policy bans sales of most new petrol cars from 2035 and now mandates payment-card interoperability at public chargers, further strengthening consumer confidence.
North America accelerates through the NEVI Formula's USD 5 billion funding, enabling 204,000 public ports. The seven-automaker IONNA venture will add 30,000 high-power connectors, and the retrofitting of Tesla Superchargers for multi-brand use could generate USD 6-12 billion in additional revenue by 2030. Cross-industry alliances link charging to retail amenities, mirroring European service-station strategies.
- ABB Ltd.
- ChargePoint Inc.
- Tesla Inc.
- Siemens AG
- Schneider Electric Corporation
- Shell Plc.
- ENGIE SA (EVBox)
- BYD Motors Inc.
- Tritium Charging Inc.
- Blink Charging o.
- Delta Electronics Inc.
- Kempower Oyj
- Electrify America, LLC
- IONITY GmbH
- Leviton Manufacturing Co. Inc.
Additional Benefits:
- The market estimate (ME) sheet in Excel format
- 3 months of analyst support
TABLE OF CONTENTS
1 Introduction
- 1.1 Study Assumptions and Market Definition
- 1.2 Scope of the Study
2 Research Methodology
3 Executive Summary
4 Market Landscape
- 4.1 Market Overview
- 4.2 Market Drivers
- 4.2.1 Government-backed zero-emission mandates and ICE-ban timelines
- 4.2.2 Falling battery $/kWh driving TCO parity
- 4.2.3 Global build-out of highway fast-charging corridors
- 4.2.4 Surging fleet-electrification commitments from logistics giants
- 4.2.5 Grid-services monetisation (V2G/V2X) business models
- 4.2.6 AI-optimised charger siting improving utilisation rates
- 4.3 Market Restraints
- 4.3.1 High upfront CAPEX for More Than 150 kW chargers
- 4.3.2 Uneven permitting and utility interconnection timelines
- 4.3.3 Raw-material bottlenecks for SiC MOSFETs
- 4.3.4 Cyber-security vulnerabilities in networked chargers
- 4.4 Regulatory Landscape
- 4.5 Porter's Five Forces
- 4.5.1 Threat of New Entrants
- 4.5.2 Bargaining Power of Buyers
- 4.5.3 Bargaining Power of Suppliers
- 4.5.4 Threat of Substitutes
- 4.5.5 Competitive Rivalry
5 Market Size and Growth Forecasts (Value (USD))
- 5.1 By Vehicle Type
- 5.1.1 Passenger Cars
- 5.1.2 Commercial Vehicles
- 5.1.3 Buses and Coaches
- 5.2 By Charger Type
- 5.2.1 AC Charging Station
- 5.2.2 DC Charging Station
- 5.3 By Ownership Model
- 5.3.1 Public
- 5.3.2 Private - Residential
- 5.3.3 Private - Fleet/Workplace
- 5.4 By Installation Site
- 5.4.1 Home
- 5.4.2 Destination/Retail
- 5.4.3 Highway/Transit
- 5.4.4 Fleet Depot
- 5.5 By Connector Standard
- 5.5.1 CCS
- 5.5.2 CHAdeMO
- 5.5.3 GB/T
- 5.5.4 Tesla NACS
- 5.5.5 Wireless
- 5.6 By Geography
- 5.6.1 North America
- 5.6.1.1 United States
- 5.6.1.2 Canada
- 5.6.1.3 Rest of North America
- 5.6.2 South America
- 5.6.2.1 Brazil
- 5.6.2.2 Chile
- 5.6.2.3 Rest of South America
- 5.6.3 Europe
- 5.6.3.1 Germany
- 5.6.3.2 United Kingdom
- 5.6.3.3 France
- 5.6.3.4 Norway
- 5.6.3.5 Italy
- 5.6.3.6 Spain
- 5.6.3.7 Netherlands
- 5.6.3.8 Poland
- 5.6.3.9 Austria
- 5.6.3.10 Russia
- 5.6.3.11 Rest of Europe
- 5.6.4 Asia-Pacific
- 5.6.4.1 China
- 5.6.4.2 Japan
- 5.6.4.3 India
- 5.6.4.4 South Korea
- 5.6.4.5 Indonesia
- 5.6.4.6 Vietnam
- 5.6.4.7 Philippines
- 5.6.4.8 Australia
- 5.6.4.9 New Zealand
- 5.6.4.10 Rest of Asia-Pacific
- 5.6.5 Middle East and Africa
- 5.6.5.1 Saudi Arabia
- 5.6.5.2 United Arab Emirates
- 5.6.5.3 Egypt
- 5.6.5.4 Turkey
- 5.6.5.5 South Africa
- 5.6.5.7 Rest of Middle East and Africa
- 5.6.1 North America
6 Competitive Landscape
- 6.1 Market Concentration
- 6.2 Strategic Moves
- 6.3 Market Share Analysis
- 6.4 Company Profiles (includes Global level Overview, Market level overview, Core Segments, Financials as available, Strategic Information, Market Rank/Share, Products and Services, and Recent Developments)
- 6.4.1 ABB Ltd.
- 6.4.2 ChargePoint Inc.
- 6.4.3 Tesla Inc.
- 6.4.4 Siemens AG
- 6.4.5 Schneider Electric Corporation
- 6.4.6 Shell Plc.
- 6.4.7 ENGIE SA (EVBox)
- 6.4.8 BYD Motors Inc.
- 6.4.9 Tritium Charging Inc.
- 6.4.10 Blink Charging o.
- 6.4.11 Delta Electronics Inc.
- 6.4.12 Kempower Oyj
- 6.4.13 Electrify America, LLC
- 6.4.14 IONITY GmbH
- 6.4.15 Leviton Manufacturing Co. Inc.
7 Market Opportunities and Future Outlook
- 7.1 White-space and Unmet-Need Assessment
 2032 年超快速電動車充電市場預測:按充電標準、部署模式、安裝類型、技術、應用、最終用戶和地區進行的全球分析2032 年電動車充電站設備市場預測:按充電站類型、功率輸出、組件、安裝類型、供應商類型、連接器類型、最終用戶和地區進行的全球分析
 電動車充電站市場(按充電類型、連接器類型、營運、經營模式和最終用途)—2025-2030 年全球預測電動車充電站軟體市場(按軟體類型、部署類型、充電站類型、最終用戶和應用)—2025 年至 2030 年全球預測
 全球商用車充電樁市場全球直流電動車快速充電站市場全球交流電電動車充電站市場
 全球電動車充電站市場研究報告 - 產業分析、規模、佔有率、成長、趨勢及 2025 年至 2033 年預測全球電動車防水充電樁市場
 全球電動車充電站市場按應用、充電點營運商、充電基礎設施類型、充電點類型、充電服務類型、連接階段、直流快速充電類型、電動公車充電類型、安裝類型、充電等級、模式和地區分類 - 預測至 2032 年