


 |
市場調查報告書
商品編碼
1851352
光伏發電(PV):市場佔有率分析、行業趨勢、統計數據和成長預測(2025-2030 年)Solar Photovoltaic (PV) - Market Share Analysis, Industry Trends & Statistics, Growth Forecasts (2025 - 2030) |
||||||
※ 本網頁內容可能與最新版本有所差異。詳細情況請與我們聯繫。
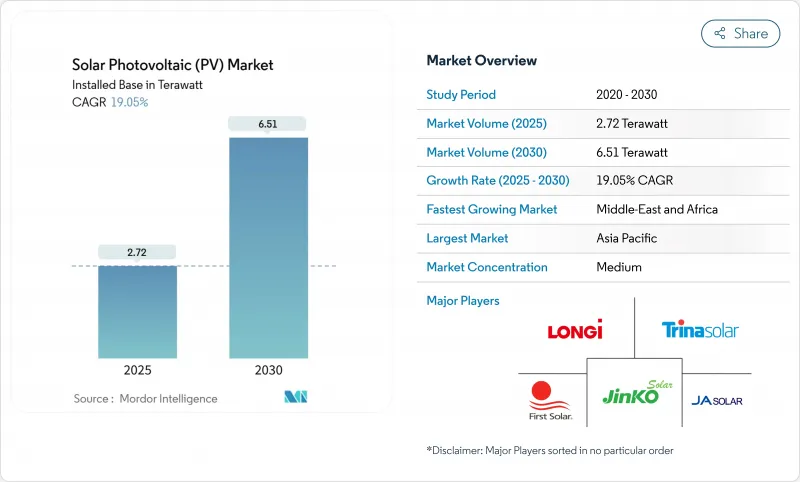
預計太陽能發電市場的裝置容量將從 2025 年的 2.72兆瓦成長到 2030 年的 6.51兆瓦,在預測期(2025-2030 年)內複合年成長率為 19.05%。
組件成本下降、電池效率創歷史新高以及相關政策的支持,正推動太陽能技術在多個地區超越傳統發電方式。產能已提升至1.8太瓦,在需求加速成長的情況下,確保了穩定的供應。儘管疊層和鈣鈦礦技術的創新可能顛覆現狀,但單晶矽電池仍然是產業標竿。受美國《通膨控制法案》、歐盟《淨零排放產業法案》及類似措施的推動,策略性供應鏈資源配置將降低對單一地區生產的依賴,同時引入新的區域成長點。儘管電網整合障礙、多晶矽價格波動和貿易體制的變化構成短期風險,但企業全天候清潔能源合約的增加以及對綠色氫能的需求將支撐長期需求。雖然公用事業規模的太陽能發電目前佔據市場主導地位,但隨著土地資源日益緊張和能源獨立需求的加劇,住宅和浮體式系統的市場佔有率正在不斷成長。
全球光電市場趨勢與洞察
模組平均售價下降擴大市電平價區
2024年,組件價格年減51.8%,導致多家中國製造商跌破損益平衡點,並促使供應商削減供應,穩定了價格進一步下跌的趨勢。目前,全球70%的電力市場已市電平價,使得先前被認為不具備經濟效益的地區也能滲透太陽能市場。沙烏地阿拉伯的平準化電力成本為10.4美元/兆瓦時,在高太陽輻射條件下展現出成本領先優勢。隨著成本降低與微電網需求成長的共同作用,撒哈拉以南非洲地區預計將獲得顯著收益。儘管貿易措施和區域性含量法規可能會造成區域價格差異,但到2026年,全球平均價格可能會隨著能源效率的提高而下降。
IRA主導的美國光伏製造回流
目前已宣布超過1000億美元的投資承諾,將使美國電池和組件產量翻兩番,並重塑全球供應鏈。韓華Qcells正在建造一座從矽錠到組件的一體化生產基地,而First Solar正在阿拉巴馬州建設一條新的薄膜生產線,這將使美國國內產能提升至11吉瓦。國內產能補貼將使計劃成本降低10%至20%,進而抵銷亞洲歷來在成本上的優勢。這項舉措可以降低地緣政治風險,但前提是政策能夠持續穩定,並且需要逐步擴大規模,主導一個學習曲線。
高滲透率區域的電網擁塞和抑制
加州2024年輸電中斷量將達到340萬兆瓦時,較上年同期成長29%,凸顯了發電成長與輸電擴建之間的不匹配。在德克薩斯州,如果不進行大規模電網升級,到2035年太陽能棄電率可能上升至19%。到2040年,歐洲的電力調度量可能會成長六倍,這將為電力公司和消費者都帶來成本。諸如西部能源不平衡市場(WEIM)之類的區域協調機制為減少棄電提供了可能,但新建輸電線路的典型前置作業時間為七到十年,這是投資者必須考慮的限制因素。
細分市場分析
2024年,單晶矽組件將貢獻87%的發電容量,並透過系統級學習曲線的進步鞏固其成本領先地位。這項技術是太陽能光電市場規模的核心,預計到2030年,該技術領域的複合年成長率將達到19.05%。由於TOPCon太陽能電池能夠在無需大量資本投入的情況下提高效率,因此佔了新生產線的70%。 CdTe和CIGS等薄膜解決方案在空間受限和高溫應用領域保持其獨特的優勢。串聯和鈣鈦礦結構正吸引創業投資資金,以加速中試生產線的建設並突破理論產量的上限,其中隆基的實驗室規模效率達到了30.1%,Qcells的組件效率達到了28.6%。異質結電池具有較高的開路電壓,但面臨金屬化成本的挑戰,而背接觸電池則著眼於建築一體化太陽能發電的美觀性。因此,技術競賽圍繞著提高效率、材料可用性和生產擴充性展開,這些因素正在推動整個太陽能光電市場的採購決策。
持續的研發將確保效能提升轉化為更低的系統成本,從而暫時鞏固單晶矽的優勢。然而,效率每提高1%,有效面積就會減少約2%,這在都市區和農業太陽能環境中可節省大量成本。對疊層太陽能電池的投資動能顯示其具有顛覆性潛力,預計首批商業產品將於2027年前交付。最終的普及速度將取決於其耐久性和資本投入強度。在此之前,諸如高銀含量金屬化漿料和增強型雙面電池等漸進式升級將使現有產品保持競爭力。
光伏(PV)市場報告按技術(單晶矽、多晶、薄膜、串聯/鈣鈦礦)、最終用戶(住宅、商業/工業、公用事業規模的獨立發電廠)、部署類型(地面安裝、屋頂/建築整合、浮體式光伏)和地區(北美、亞太、歐洲、南美、中東/非洲)進行細分。
區域分析
到2024年,亞太地區將佔全球光伏裝機量的64%,這主要得益於中國一體化的供應鏈和持續的政策支持。中國國內產能的擴張,加上東南亞組裝中心的出口,確保了全球光伏組件供應充足。印度的生產連結獎勵計畫計畫正在吸引吉瓦級晶圓廠,以規避美國和歐盟的貿易壁壘。日本正在試驗在灌溉池塘上安裝浮體式光電陣列,而澳洲則致力於屋頂光電部署並增加分散式發電容量。這些發展凸顯了亞太地區作為全球太陽能市場核心的歷史地位和持續影響力。
在「2030願景」框架和綠氫能策略的推動下,中東和非洲地區到2030年將以22%的複合年成長率成長。沙烏地阿拉伯的58吉瓦目標、阿拉伯聯合大公國的14吉瓦雄心以及阿曼的綠色氨計劃,都體現了從試點項目向吉瓦級建設的過渡。非洲在2023年累積裝置容量超過16吉瓦。至2030年,投資項目規模將超過100吉瓦,並可獲得優惠融資。在地化的組件組裝線以及與礦業公司簽訂的雙邊購電協議,有助於降低外匯風險敞口,並增強融資可行性。
北美正利用IRA獎勵恢復國內生產並吸引下游投資。超大規模資料中心的成長正在推動對基本負載可再生能源的需求。在歐洲,日益重視能源安全和減少對中國的依賴,正透過協調競標加速屋頂電站和光伏儲能混合電站的部署。在智利阿塔卡馬沙漠,容量係數超過30%,實現了創紀錄的低評級。在各個地區,政策制定、資源供應和資金籌措生態系統正在塑造太陽能市場的發展軌跡。
其他福利:
- Excel格式的市場預測(ME)表
- 3個月的分析師支持
目錄
第1章 引言
- 研究假設和市場定義
- 調查範圍
第2章調查方法
第3章執行摘要
第4章 市場情勢
- 市場概覽
- 市場促進因素
- 模組平均售價下降擴大市電平價區
- 美國光伏製造正在向國內轉移。
- 人工智慧驅動的太陽能發電預測可降低平衡成本
- 來自綠色氫電解槽計劃的需求
- 企業全天候清潔能源購電協議承諾
- 農光互補技術釋放土地雙重用途的效益
- 市場限制
- 高滲透率地區電網擁塞和限電風險
- 多晶矽價格的快速波動正在擠壓生產商的利潤空間。
- 反傾銷貿易措施擾亂供應鏈
- 日益嚴格的屋頂消防安全法規推高了系統平衡(BOS)成本。
- 供應鏈分析
- 監管環境
- 技術展望
- 波特五力模型
- 供應商的議價能力
- 消費者議價能力
- 新進入者的威脅
- 替代品的威脅
- 競爭對手之間的競爭
- 裝置容量和出貨趨勢
- 價格和LCOE趨勢
- 重大計劃儲備
第5章 市場規模與成長預測
- 透過技術
- 單晶矽
- 多晶
- 薄膜(CdTe、CIGS、a-Si)
- 串聯/鈣鈦礦
- 最終用戶
- 住宅
- 商業和工業
- 公用事業規模的獨立發電廠
- 依部署類型
- 地面安裝
- 屋頂/建築一體化光伏(BIPV)
- 浮體式式光電
- 按地區
- 北美洲
- 美國
- 加拿大
- 墨西哥
- 歐洲
- 德國
- 英國
- 法國
- 義大利
- 俄羅斯
- 其他歐洲地區
- 亞太地區
- 中國
- 印度
- 日本
- 韓國
- 東南亞國協
- 澳洲
- 其他亞太地區
- 南美洲
- 巴西
- 阿根廷
- 其他南美洲
- 中東和非洲
- 沙烏地阿拉伯
- 阿拉伯聯合大公國
- 南非
- 奈及利亞
- 其他中東和非洲地區
- 北美洲
第6章 競爭情勢
- 市場集中度
- 策略性舉措(併購、夥伴關係、購電協議)
- 市場佔有率分析(主要企業的市場排名/佔有率)
- 公司簡介
- LONGi Green Energy Technology Co. Ltd.
- Trina Solar Co. Ltd.
- JinkoSolar Holding Co. Ltd.
- JA Solar Technology Co. Ltd.
- First Solar Inc.
- Canadian Solar Inc.
- Hanwha Q Cells Co. Ltd.
- SunPower Corporation
- Risen Energy Co. Ltd.
- Sharp Corporation
- Suntech Power Co. Ltd.
- REC Solar Holdings AS
- GCL System Integration Technology
- Maxeon Solar Technologies
- Yingli Solar
- Adani Solar
- Axitec Energy GmbH
- FuturaSun Srl
- Waaree Energies Ltd.
- Meyer Burger Technology AG
第7章 市場機會與未來展望
The Solar Photovoltaic Market size in terms of installed base is expected to grow from 2.72 Terawatt in 2025 to 6.51 Terawatt by 2030, at a CAGR of 19.05% during the forecast period (2025-2030).
Module cost declines, record-high cell efficiencies, and supportive policies have enabled the technology to undercut conventional generation across diverse geographies. Manufacturing capacity has climbed to 1.8 TW, underpinning robust supply even as demand accelerates. Monocrystalline cells remain the benchmark, though tandem and perovskite innovations are poised to disrupt the status quo. Strategic supply-chain reshoring-driven by the US Inflation Reduction Act, the EU Net-Zero Industry Act, and similar initiatives-introduces new regional growth vectors while tempering dependence on single-region production. Grid-integration hurdles, price volatility in polysilicon, and shifting trade regimes pose near-term risks, yet rising corporate 24/7 clean-power contracts and green-hydrogen ambitions anchor long-term demand. Across segments, utility-scale assets dominate today's solar photovoltaic market, but residential and floating systems capture an expanding share as land constraints and energy-autonomy preferences intensify.
Global Solar Photovoltaic (PV) Market Trends and Insights
Falling Module ASPs Widen Grid-Parity Zones
Module prices fell 51.8% year-over-year in 2024, pushing several Chinese producers below break-even and prompting supply reductions that stabilize the trajectory of further declines. Grid parity is now achieved in 70% of global electricity markets, unlocking solar photovoltaic market penetration in regions once considered uneconomic. Saudi Arabia recorded a levelized cost of electricity of USD 10.4/MWh, illustrating cost leadership under strong irradiance. Sub-Saharan Africa stands to gain as cost reductions converge with rising mini-grid demand. Trade actions and localized content rules may introduce regional price spreads, yet global median prices trend lower through 2026 as efficiencies climb.
IRA-Driven On-Shoring of PV Manufacturing in the US
Announced commitments exceeding USD 100 billion will quadruple US cell and module output and realign global supply networks. Hanwha Qcells is building an integrated ingot-to-module complex, and First Solar's new thin-film line in Alabama boosts domestic capacity to 11 GW. Domestic content bonuses shave 10-20% from project costs, neutralizing historic Asian cost advantages. The initiative mitigates geopolitical risk but hinges on sustained policy continuity and incremental scale-driven learning curves.
Grid Congestion and Curtailment in High-Penetration Regions
California curtailed 3.4 million MWh in 2024, a 29% jump that spotlights the mismatch between generation growth and transmission expansion. Texas could see solar curtailment rates rise to 19% by 2035 without major grid upgrades. Europe's redispatch volumes may increase sixfold by 2040, costing operators and consumers alike. Regional coordination frameworks-such as the Western Energy Imbalance Market-demonstrate curtailment-reduction potential, yet typical lead times of seven to ten years for new lines keep the constraint front-of-mind for investors.
Other drivers and restraints analyzed in the detailed report include:
- AI-Enabled Solar Forecasting Cuts Balancing Costs
- Demand from Green-Hydrogen Electrolyzer Projects
- Rapid Polysilicon Price Swings Squeeze Producer Margins
For complete list of drivers and restraints, kindly check the Table Of Contents.
Segment Analysis
Monocrystalline-Si modules supplied 87% of 2024 capacity and delivered system-level learning-curve gains that reinforce their cost leadership. This technology sits at the heart of the solar photovoltaic market size for the technology segment, which is projected to grow at a 19.05% CAGR to 2030. TOPCon cells captured 70% of new production lines because they raise efficiency without large capital retooling. Thin-film solutions like CdTe and CIGS retain niches in space-constrained or high-temperature applications. Tandem and perovskite architectures, with LONGi's 30.1% lab-scale efficiency and Qcells' 28.6% module milestone, attract venture funding that accelerates pilot lines and pushes theoretical yield ceilings higher. Heterojunction offers high open-circuit voltages but encounters metallization cost hurdles, while back-contact cells target aesthetics for building-integrated photovoltaics. Technology competition thus pivots on efficiency advancements, material availability, and production scalability-factors that collectively steer procurement decisions across the solar photovoltaic market.
Continued R&D ensures performance gains translate to lower balance-of-system costs, reinforcing monocrystalline leadership in the near term. Yet every 1 percentage-point efficiency jump trims active area by roughly 2%, a saving critical in urban or agrivoltaic settings. Investment momentum behind tandem cells indicates disruption potential, and first commercial shipments are plausible before 2027. The eventual diffusion pace will hinge on durability proofs and capex intensity. Until then, incremental upgrades-such as metallization pastes with higher silver fraction efficiency or bifacial enhancements-keep current lines competitive.
The Solar Photovoltaic (PV) Market Report is Segmented by Technology (Monocrystalline-Si, Multicrystalline-Si, Thin-Film, and Tandem/Perovskite), End-User (Residential, Commercial and Industrial, and Utility-Scale IPPs), Deployment Type (Ground-Mounted, Rooftop/Building-Integrated, and Floating PV), and Geography (North America, Asia-Pacific, Europe, South America, and Middle East and Africa).
Geography Analysis
Asia-Pacific contributed 64% of global installations in 2024, driven by China's integrated supply chain and sustained policy support. Domestic Chinese additions, plus exports into Southeast Asian assembly hubs, kept the global module supply abundant. India's production-linked incentive program draws gigawatt-scale fabs as firms hedge against US and EU trade barriers. Japan pilots floating PV arrays atop irrigation ponds, while Australia intensifies rooftop adoption, boosting distributed capacity. These developments anchor Asia-Pacific's role as the historical and ongoing nucleus of the solar photovoltaic market.
The Middle East and Africa region is growing at a 22% CAGR through 2030, propelled by Vision 2030 frameworks and green-hydrogen strategies. Saudi Arabia's 58 GW target, the UAE's 14 GW ambition, and Omani green-ammonia projects illustrate the shift from pilot programs to gigawatt build-outs. Africa exceeded 16 GW cumulative capacity in 2023; investment pipelines exceed 100 GW for 2030, contingent on concessional finance. Local module-assembly lines and bilateral power-purchase contracts with mining firms mitigate currency-risk exposure and strengthen bankability.
North America leverages IRA incentives to restore domestic production and attract downstream investment. Corporate procurement remains the region's prime demand driver, with hyperscaler data-center growth elevating baseload renewable requirements. Europe intensifies focus on energy security and de-risking Chinese dependency; coordinated tenders accelerate rooftop adoption and hybrid plants that blend storage with PV. South America capitalizes on stellar irradiation; Chile's Atacama Desert records capacity factors above 30%, enabling record-low tariffs. Across regions, policymaking, resource endowments, and financing ecosystems collectively sculpt uptake trajectories in the solar photovoltaic market.
- LONGi Green Energy Technology Co. Ltd.
- Trina Solar Co. Ltd.
- JinkoSolar Holding Co. Ltd.
- JA Solar Technology Co. Ltd.
- First Solar Inc.
- Canadian Solar Inc.
- Hanwha Q Cells Co. Ltd.
- SunPower Corporation
- Risen Energy Co. Ltd.
- Sharp Corporation
- Suntech Power Co. Ltd.
- REC Solar Holdings AS
- GCL System Integration Technology
- Maxeon Solar Technologies
- Yingli Solar
- Adani Solar
- Axitec Energy GmbH
- FuturaSun Srl
- Waaree Energies Ltd.
- Meyer Burger Technology AG
Additional Benefits:
- The market estimate (ME) sheet in Excel format
- 3 months of analyst support
TABLE OF CONTENTS
1 Introduction
- 1.1 Study Assumptions & Market Definition
- 1.2 Scope of the Study
2 Research Methodology
3 Executive Summary
4 Market Landscape
- 4.1 Market Overview
- 4.2 Market Drivers
- 4.2.1 Falling module ASPs widen grid-parity zones
- 4.2.2 IRA-driven on-shoring of PV manufacturing in the U.S.
- 4.2.3 AI-enabled solar forecasting cuts balancing costs
- 4.2.4 Demand from green-hydrogen electrolyzer projects
- 4.2.5 Corporate 24/7 clean-power PPA commitments
- 4.2.6 Agrivoltaics unlocks dual-land use revenues
- 4.3 Market Restraints
- 4.3.1 Grid-congestion & curtailment risks in high-penetration regions
- 4.3.2 Rapid polysilicon price swings squeeze producer margins
- 4.3.3 Anti-dumping trade actions fragment supply chains
- 4.3.4 Rising rooftop-fire regulations add balance-of-system (BOS) cost
- 4.4 Supply-Chain Analysis
- 4.5 Regulatory Landscape
- 4.6 Technological Outlook
- 4.7 Porter's Five Forces
- 4.7.1 Bargaining Power of Suppliers
- 4.7.2 Bargaining Power of Consumers
- 4.7.3 Threat of New Entrants
- 4.7.4 Threat of Substitutes
- 4.7.5 Intensity of Competitive Rivalry
- 4.8 Installed-Capacity and Shipment Trends
- 4.9 Pricing and LCOE Trends
- 4.10 Key Projects Pipeline
5 Market Size & Growth Forecasts
- 5.1 By Technology
- 5.1.1 Monocrystalline-Si
- 5.1.2 Multicrystalline-Si
- 5.1.3 Thin-film (CdTe, CIGS, a-Si)
- 5.1.4 Tandem/Perovskite
- 5.2 By End-User
- 5.2.1 Residential
- 5.2.2 Commercial and Industrial
- 5.2.3 Utility-scale IPPs
- 5.3 By Deployment Type
- 5.3.1 Ground-mounted
- 5.3.2 Rooftop/Building-Integrated (BIPV)
- 5.3.3 Floating PV
- 5.4 By Geography
- 5.4.1 North America
- 5.4.1.1 United States
- 5.4.1.2 Canada
- 5.4.1.3 Mexico
- 5.4.2 Europe
- 5.4.2.1 Germany
- 5.4.2.2 United Kingdom
- 5.4.2.3 France
- 5.4.2.4 Italy
- 5.4.2.5 Russia
- 5.4.2.6 Rest of Europe
- 5.4.3 Asia-Pacifc
- 5.4.3.1 China
- 5.4.3.2 India
- 5.4.3.3 Japan
- 5.4.3.4 South Korea
- 5.4.3.5 ASEAN Countries
- 5.4.3.6 Australia
- 5.4.3.7 Rest of Asia-Pacifc
- 5.4.4 South America
- 5.4.4.1 Brazil
- 5.4.4.2 Argentina
- 5.4.4.3 Rest of South America
- 5.4.5 Middle East and Africa
- 5.4.5.1 Saudi Arabia
- 5.4.5.2 United Arab Emirates
- 5.4.5.3 South Africa
- 5.4.5.4 Nigeria
- 5.4.5.5 Rest of Middle East and Africa
- 5.4.1 North America
6 Competitive Landscape
- 6.1 Market Concentration
- 6.2 Strategic Moves (M&A, Partnerships, PPAs)
- 6.3 Market Share Analysis (Market Rank/Share for key companies)
- 6.4 Company Profiles (includes Global level Overview, Market level overview, Core Segments, Financials as available, Strategic Information, Products & Services, and Recent Developments)
- 6.4.1 LONGi Green Energy Technology Co. Ltd.
- 6.4.2 Trina Solar Co. Ltd.
- 6.4.3 JinkoSolar Holding Co. Ltd.
- 6.4.4 JA Solar Technology Co. Ltd.
- 6.4.5 First Solar Inc.
- 6.4.6 Canadian Solar Inc.
- 6.4.7 Hanwha Q Cells Co. Ltd.
- 6.4.8 SunPower Corporation
- 6.4.9 Risen Energy Co. Ltd.
- 6.4.10 Sharp Corporation
- 6.4.11 Suntech Power Co. Ltd.
- 6.4.12 REC Solar Holdings AS
- 6.4.13 GCL System Integration Technology
- 6.4.14 Maxeon Solar Technologies
- 6.4.15 Yingli Solar
- 6.4.16 Adani Solar
- 6.4.17 Axitec Energy GmbH
- 6.4.18 FuturaSun Srl
- 6.4.19 Waaree Energies Ltd.
- 6.4.20 Meyer Burger Technology AG
7 Market Opportunities & Future Outlook
- 7.1 White-space & Unmet-need Assessment
 光電模組快速關斷裝置市場預測至2034年-按類型、技術、最終用戶和地區分類的全球分析全球太陽能光電模組市場預測至2034年:按組件、封裝類型、技術、應用和地區分類
 住宅太陽能市場:依安裝類型、併網方式、組件、技術類型、銷售管道和應用分類-2026-2032年全球市場預測太陽能市場:2026-2032年全球市場預測(按面板類型、技術類型、組件、輸出容量、系統類型、安裝類型、應用和所有權狀態分類)
 2026年全球並聯型網光電系統市場報告2026年全球分散式太陽能並聯型系統市場報告
 電源調節器市場機會、成長要素、產業趨勢分析及2026-2035年預測2026年全球空間太陽能發電陣列市場報告
 全球太陽能板市場規模、佔有率、趨勢和成長分析報告(2026-2034年)全球太陽能樹市場規模、佔有率、趨勢和成長分析報告(2026-2034年)