


 |
市場調查報告書
商品編碼
1851332
起重機:市場佔有率分析、行業趨勢、統計數據和成長預測(2025-2030 年)Crane - Market Share Analysis, Industry Trends & Statistics, Growth Forecasts (2025 - 2030) |
||||||
※ 本網頁內容可能與最新版本有所差異。詳細情況請與我們聯繫。
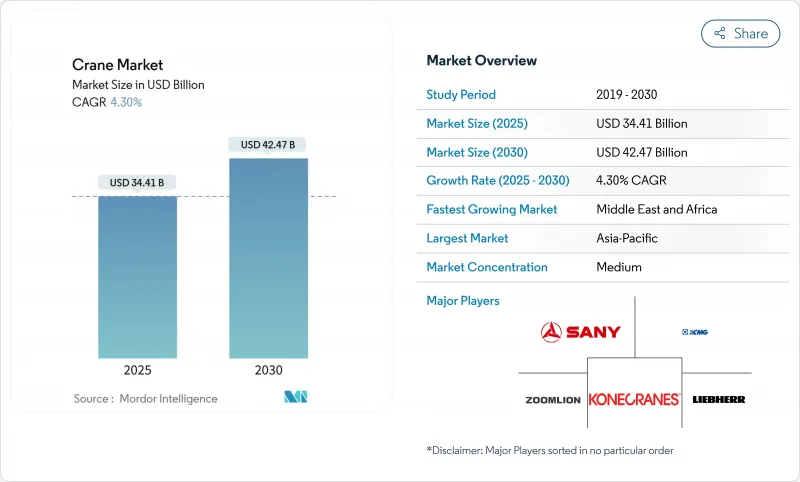
預計到 2025 年,起重機市場規模將達到 344.1 億美元,到 2030 年將擴大到 424.7 億美元,複合年成長率為 4.30%。
穩定的公共支出、大型私人大型企劃以及全球向可再生能源的轉型構成了起重機市場的核心需求引擎。政府基礎設施計劃,例如美國的《基礎設施投資與就業法案》,正在創造多年期的訂單,以保護承包商免受短期經濟波動的影響。離岸風力發電、太陽能發電園區和電網升級進一步強化了這一積極前景,尤其對專用重型起重和船舶設備而言更是如此。同時,電氣化強制令正在刺激對混合動力和純電動起重機的投資,而遠端資訊處理技術的應用則提高了車隊運轉率並減少了停機時間。隨著現有企業加速研發零排放平台並收購利基創新企業以拓展產品組合,市場競爭日益激烈。
全球起重機市場趨勢與洞察
基礎建設不斷加強
基礎設施現代化已成為起重機需求的主要催化劑,僅《基礎設施投資與就業法案》就計劃在交通、能源和數位基礎設施領域投資超過1.2兆美元。這項基礎設施建設熱潮不僅限於傳統的道路和橋樑計劃,還涵蓋資料中心、半導體工廠和清潔能源設施等,這些項目都需要專業的重型起重能力。預計建築支出將達到每年2.13兆美元,其中公共基礎建設的年增率接近8%。這項基礎設施復興為起重機營運商提供了多年的發展前景,計劃積壓將持續到2027年。基礎設施計劃中模組化施工技術的普及也推動了對能夠處理數百噸預製構件的精密起重設備的需求。聯邦基礎設施資金使各州能夠投資於勞動力發展計劃,從而解決起重機認證操作員嚴重短缺的問題,否則這一短缺可能會阻礙市場成長。
可再生能源採用率快速成長
可再生能源轉型正在從根本上改變起重機的市場動態,離岸風力發電安裝推動了對專用海洋起重機的需求,這些起重機能夠吊裝重達2500噸以上的渦輪機零件。風力發電機安裝船,例如凱德勒公司的「風峰號」(Wind Peak),配備了日益精密的起重系統,其中一些船舶能夠同時運輸七台完整的15兆瓦渦輪機。可再生能源部署規模空前,促使豪斯曼等公司開發專用離岸風電安裝起重機和運動補償平台,以便在超過150公尺的高度處理零件。太陽能光電發電裝置正在推動對移動式起重機的需求,尤其是在公用事業規模的計劃中,這些專案的面板和安裝系統需要在廣闊的區域內進行精確定位。可再生能源產業的成長正在催生新的起重機應用領域,從浮體式海上風電平台到聚光型太陽光電裝置,這些都需要專業的起重解決方案。預計這種能源轉型將使起重機的需求成長遠遠超出傳統的建設週期,因為可再生能源基礎設施需要持續的維護和零件更換。
高昂的資本和營業成本
新型重型起重機,例如馬尼托瓦克31000型起重機,售價可高達3000萬美元,且需要持續投入大量維護資金。材料通膨導致主要市場的建築材料價格平均上漲15%,直接影響了起重機的製造和租賃成本。高利率進一步加劇了這些挑戰,顯著提高了設備資金籌措成本,並影響了起重機的購買和租賃需求。中小型起重機業者尤其容易受到這些成本壓力的影響,因為它們缺乏規模來消化價格上漲,這可能迫使它們退出市場或與大型企業合併。現代起重機系統的複雜性需要專業技術人員和昂貴的更換零件,這會對營運商的預算造成壓力。認證操作員的培訓成本不斷增加,儘管基於模擬的培訓計畫能夠縮短培訓時間並提高安全性,但前期仍需大量前期投資。
細分市場分析
2024年,移動式起重機將維持45.25%的最大市場佔有率,這反映了其在建築、基礎設施和工業應用領域的廣泛適用性。移動式起重機受益於其對不同場地環境的適應性以及在多個計劃中快速部署的能力,使其成為管理多樣化工作量的承包商的首選。受離岸風電場建設空前擴張以及對船舶專用起重解決方案的需求推動,預計2025年至2030年間,海洋和近海起重機將呈現最強勁的成長勢頭,年複合成長率將達到7.45%。
固定式起重機,包括塔式起重機和架空起重機,在高層建築和工業設施建設中發揮著至關重要的作用,尤其在中東和亞太地區的大型城市大型企劃中需求強勁。海洋和近海領域的快速成長反映了離岸風力發電機安裝的特殊性,起重機必須在惡劣的海洋環境中運作,同時還要搬運重達數千噸的零件。像凱德勒(Cadeler)這樣的公司正在大力投資建造配備2200噸起重機的風力發電機安裝船,以服務不斷成長的離岸風力發電市場。隨著離岸風力發電機的不斷增大,對能夠在惡劣天氣條件下進行精準吊裝的日益精密的海洋起重機系統的需求也在不斷成長。
2024年,51-150噸級起重機將佔據最大的市場佔有率,達到33.90%,是通用建築和工業應用的理想選擇。 300噸及以上級起重機將在2025-2030年間以8.25%的複合年成長率實現最快成長,這反映出行業正向需要前所未有的起重能力的大型企劃轉型。這款中階起重機兼具起重能力和操作靈活性,因此非常適合各種類型的建築計劃,從商業建築到基礎設施建設。
重型起重應用主要由核子反應爐建設、石化設施和海上能源計劃推動,這些項目需要能夠吊裝反應器部件、製程模組和渦輪組件的起重機。 Mammoet 的 6000 噸 SK6000 起重機體現了該行業向超重型起重能力發展的核能發電廠。 50 噸級起重機適用於較小的建設計劃和維護應用,而 151-300 噸級起重機則符合中型工業和基礎設施的需求。中聯重科的 3,600 噸履帶起重機創造了單次起吊重量的世界紀錄,展現了重型起重能力的科技進步。模組化建築的趨勢正在推動所有噸位範圍的起重機需求,因為預製部件需要精確的起吊和定位能力。
區域分析
2024年,亞太地區將佔全球起重機市場收入的42.10%,主要得益於中國持續高額的公共工程支出以及印度加快工廠建設。中國港口自動化的成功——單台橋式起重機平均每小時可搬運60.9個貨櫃——彰顯了其在吞吐量方面的區域領先地位。印度2025年聯邦預算維持了較高的基礎設施撥款,這支撐了履帶和塔式起重機的持續需求,儘管正值選舉期間市場較為謹慎。日本和韓國預計將實現個位數低成長,主要受設施維護和現代化改造的推動。
預計中東和非洲地區將以6.65%的複合年成長率(CAGR)在2025年至2030年間實現最快成長。光是沙烏地阿拉伯就計畫為NEOM新城及相關大型計劃部署約2萬台塔式起重機。沃爾夫克蘭和扎米爾集團的新工廠等本地合資企業將縮短進口前置作業時間,並建立在地化的供應鏈。原油價格上漲將為依賴重型履帶起重機的下游石化企業帶來收入,並拓展其應用範圍。
北美將受益於1.2兆美元的《基礎設施投資和就業法案》,該法案將為超過6萬個計劃提供資金,並維持多年的工作。預計到2025年,美國設備租賃產業規模將達到773億美元,其中起重機租賃將佔據相當大的佔有率。歐洲的情況則是喜憂參半:離岸風力發電專案加速了設備需求,而利率上升則抑制了商業房地產的開工。拉丁美洲的復甦取決於大宗商品價格,但巴西能源競標的重新開放提振了該地區的重型起重設備訂單。
其他福利:
- Excel格式的市場預測(ME)表
- 3個月的分析師支持
目錄
第1章 引言
- 研究假設和市場定義
- 調查範圍
第2章調查方法
第3章執行摘要
第4章 市場情勢
- 市場概覽
- 市場促進因素
- 基礎建設發展進展
- 可再生能源(風力發電廠)裝置容量快速成長
- 新興國家的工業成長
- 都市化加速和一系列計劃正在籌備中
- 透過遠端資訊處理技術進行車輛最佳化(低調進行)
- 採用混合動力/電動起重機以滿足現場排放法規(目前尚未引起重視)
- 市場限制
- 高昂的資本和營運成本
- 建築支出的周期性特徵
- 起重機操作人員短缺(鮮為人知)
- 碳足跡審查和從搖籃到墳墓的報告(悄悄進行)
- 價值/供應鏈分析
- 監管環境
- 技術展望
- 波特五力模型
- 新進入者的威脅
- 買方的議價能力
- 供應商的議價能力
- 替代品的威脅
- 競爭對手之間的競爭
第5章 市場規模與成長預測
- 按類型
- 移動式起重機
- 全地形起重機
- 越野起重機
- 履帶起重機
- 車載起重機
- 其他移動式起重機
- 固定起重機
- 單軌列車和懸臂結構
- 卡車頂架
- 塔式起重機
- 海洋及近海起重機
- 移動式港口起重機
- 固定式港口起重機
- 海上起重機
- 船舶起重機
- 移動式起重機
- 按產能
- 高達50噸
- 51~150 T
- 151~300 T
- 超過300噸
- 透過電源
- 柴油引擎
- 混合
- 純電動
- 按吊臂類型
- 格子佈姆
- 伸縮臂
- 透過使用
- 建築和採礦
- 能源與公共產業
- 造船和港口
- 工業生產
- 物流/倉儲
- 按地區
- 北美洲
- 美國
- 加拿大
- 北美其他地區
- 南美洲
- 巴西
- 阿根廷
- 其他南美洲
- 歐洲
- 德國
- 英國
- 法國
- 義大利
- 西班牙
- 其他歐洲地區
- 亞太地區
- 中國
- 日本
- 印度
- 韓國
- 亞太其他地區
- 中東和非洲
- 沙烏地阿拉伯
- 阿拉伯聯合大公國
- 南非
- 其他中東和非洲地區
- 北美洲
第6章 競爭情勢
- 市場集中度
- 策略趨勢
- 市佔率分析
- 公司簡介
- Liebherr-International AG
- Tadano Ltd.
- Konecranes Plc
- Manitowoc Co.
- XCMG Group
- Terex Corporation
- SANY Group
- Zoomlion Heavy Industry Sci and Tech
- Kobelco Construction Machinery
- Palfinger AG
- Hitachi Sumitomo Cranes
- Favelle Favco Group
- Cargotec Oyj(Hiab)
- Sarens NV
- Mammoet
- Link-Belt Cranes
- Altec Inc.
- Effer SpA
- Bocker Maschinenwerke
第7章 市場機會與未來展望
The crane market reached USD 34.41 billion in 2025 and is projected to advance to USD 42.47 billion by 2030, translating into a 4.30% CAGR.
Stable public spending, large-scale private megaprojects, and the global shift to renewable energy form the core demand engine for the crane market. Government infrastructure programs, led by the U.S. Infrastructure Investment and Jobs Act, have created multi-year backlogs that shield contractors from short-term economic swings. Offshore wind, solar parks, and grid upgrades reinforce this positive outlook, especially for specialized heavy-lift and marine equipment. Concurrently, electrification mandates spur investment in hybrid and fully electric cranes, while telematics adoption raises fleet utilization and curbs downtime. Competition intensifies as incumbents accelerate R&D on zero-emission platforms and acquire niche innovators to broaden portfolios.
Global Crane Market Trends and Insights
Growing Infrastructure Development
Infrastructure modernization has emerged as the primary catalyst for crane demand, with the Infrastructure Investment and Jobs Act alone generating over USD 1.2 trillion in planned investments across transportation, energy, and digital infrastructure. The scale of this infrastructure push extends beyond traditional road and bridge projects to encompass data centers, semiconductor fabs, and clean energy facilities that require specialized heavy-lifting capabilities. Construction spending is projected to reach USD 2.13 trillion annually, with public infrastructure accounting for nearly 8% year-over-year growth. This infrastructure renaissance creates multi-year visibility for crane operators, extending project backlogs well into 2027. The shift toward modular construction techniques in infrastructure projects also drives demand for precision lifting equipment capable of handling prefabricated components weighing hundreds of tons. Federal infrastructure funding has enabled states to invest in workforce development programs, addressing the critical shortage of certified crane operators that could otherwise constrain market growth.
Surge in Renewable Energy Installations
The renewable energy transition fundamentally reshapes crane market dynamics, with offshore wind installations driving demand for specialized marine cranes capable of lifting turbine components exceeding 2,500 tons. Wind turbine installation vessels are being delivered with increasingly sophisticated crane systems, including Cadeler's Wind Peak vessel, capable of transporting seven complete 15 MW turbine sets per load. The scale of renewable energy deployment is unprecedented, with companies like Huisman developing specialized offshore wind installation cranes and motion-compensated platforms to handle components at heights exceeding 150 meters. Solar installations drive demand for mobile cranes, particularly in utility-scale projects where panels and mounting systems require precise positioning across vast areas. The growth of the renewable energy sector is creating new crane application categories, from floating offshore wind platforms to concentrated solar power installations requiring specialized lifting solutions. This energy transition is expected to sustain crane demand growth well beyond traditional construction cycles, as renewable energy infrastructure requires ongoing maintenance and component replacement.
High Capital and Operating Costs
The crane industry faces mounting cost pressures constraining market expansion, with new heavy-lift cranes like Manitowoc's Model 31000 commanding prices of USD 30 million while requiring substantial ongoing maintenance investments. Material cost inflation has increased construction input prices by an average of 15% across major markets, directly impacting crane manufacturing costs and rental rates. High interest rates compound these challenges, with equipment financing costs rising significantly and affecting crane purchases and rental demand. Smaller crane operators are particularly vulnerable to these cost pressures, as they lack the scale to absorb price increases and may be forced to exit the market or consolidate with larger players. The complexity of modern crane systems is also driving up maintenance costs, requiring specialized technicians and expensive replacement parts that can strain operator budgets. Training costs for certified operators are increasing, with simulation-based programs requiring substantial upfront investments despite their long-term benefits in reducing training time and improving safety outcomes.
Other drivers and restraints analyzed in the detailed report include:
- Industrial Growth Across Emerging Economies
- Accelerated Urbanization & Megaproject Pipelines
- Economic Cyclicality of Construction Spending
For complete list of drivers and restraints, kindly check the Table Of Contents.
Segment Analysis
Mobile cranes maintain the largest market share at 45.25% in 2024, reflecting their versatility across construction, infrastructure, and industrial applications. The mobile crane segment benefits from its adaptability to diverse job sites and the ability to be rapidly deployed across multiple projects, making it the preferred choice for contractors managing varied workloads. Marine and offshore cranes are experiencing the strongest growth trajectory at 7.45% CAGR 2025-2030, driven by the unprecedented expansion of offshore wind installations and the need for specialized vessel-mounted lifting solutions.
Fixed cranes, encompassing tower cranes and overhead systems, serve critical roles in high-rise construction and industrial facilities, with the demand particularly strong in urban megaprojects across the Middle East and Asia Pacific. The marine and offshore segment's rapid growth reflects the specialized nature of offshore wind turbine installation, where cranes must operate in challenging maritime environments while handling components weighing thousands of tons. Companies like Cadeler invest heavily in wind turbine installation vessels equipped with 2,200-ton capacity cranes to serve the growing offshore wind market. The evolution toward larger offshore wind turbines drives demand for increasingly sophisticated marine crane systems capable of lifting precision in harsh weather conditions.
The 51-150 ton segment commands the largest market share at 33.90% in 2024, representing the sweet spot for general construction and industrial applications. The above 300-ton capacity segment is experiencing the fastest growth at 8.25% CAGR 2025-2030, reflecting the industry's shift toward megaprojects requiring unprecedented lifting capabilities. This mid-range capacity segment benefits from its balance of lifting capability and operational flexibility, making it suitable for various construction projects from commercial buildings to infrastructure development.
Heavy-lift applications are being driven by nuclear power plant construction, petrochemical facilities, and offshore energy projects that require cranes capable of lifting reactor components, process modules, and turbine assemblies weighing hundreds of tons. Mammoet's 6,000-ton capacity SK6000 crane development exemplifies the industry's push toward ultra-heavy lifting capabilities. The up to 50-ton segment serves smaller construction projects and maintenance applications, while the 151-300 ton range addresses mid-scale industrial and infrastructure needs. Zoomlion's 3,600-ton crawler crane, setting world records for single lifting weight, demonstrates the technological advancement in heavy-lift capabilities. Modular construction trends drive demand across all capacity ranges, as prefabricated components require precise lifting and positioning capabilities.
The Crane Market Report is Segmented by Type (Mobile Crane, Fixed Crane, and Marine and Offshore Crane), Capacity (Up To 50 T, 51 To 150 T, 151 To 300 T, and Above 300 T), Power Source (Diesel, Hybrid, and Fully Electric), Boom Type (Lattice Boom and Telescopic Boom), Application (Construction and Mining and More), and Geography. The Market Forecasts are Provided in Terms of Value (USD) and Volume (Units).
Geography Analysis
Asia-Pacific accounted for 42.10% of crane market revenue in 2024 as China sustained high public works spending and India accelerated factory construction. Chinese port automation success stories, with single bridge cranes averaging 60.9 container moves an hour, illustrate regional leadership in throughput performance. India's Union Budget 2025 maintained elevated infrastructure allocations, underpinning continued demand for crawlers and tower cranes despite election-year caution. Japan and South Korea post low-single-digit growth, driven by facility maintenance and modernization.
The Middle East and Africa region is projected to post the fastest 6.65% CAGR between 2025-2030. Saudi Arabia alone intends to deploy about 20,000 tower cranes for NEOM and associated giga-projects. Local joint ventures, such as Wolffkran and Zamil Group's new factory, reduce import lead times and create a localized supply chain. High oil prices funnel revenue into downstream petrochemical complexes that rely on heavy-lift crawler cranes, broadening application diversity.
North America benefits from the USD 1.2 trillion Infrastructure Investment and Jobs Act, which funds over 60,000 projects and sustains multi-year workloads. The U.S. equipment rental sector is forecast to reach USD 77.3 billion in 2025, with cranes forming a sizable share. Europe faces mixed signals: offshore wind accelerates equipment demand, yet elevated interest rates suppress commercial real estate starts. Latin America's recovery hinges on commodity pricing, while renewed Brazilian energy auctions boost regional heavy-lift orders.
- Liebherr-International AG
- Tadano Ltd.
- Konecranes Plc
- Manitowoc Co.
- XCMG Group
- Terex Corporation
- SANY Group
- Zoomlion Heavy Industry Sci and Tech
- Kobelco Construction Machinery
- Palfinger AG
- Hitachi Sumitomo Cranes
- Favelle Favco Group
- Cargotec Oyj (Hiab)
- Sarens NV
- Mammoet
- Link-Belt Cranes
- Altec Inc.
- Effer SpA
- Bocker Maschinenwerke
Additional Benefits:
- The market estimate (ME) sheet in Excel format
- 3 months of analyst support
TABLE OF CONTENTS
1 Introduction
- 1.1 Study Assumptions and Market Definition
- 1.2 Scope of the Study
2 Research Methodology
3 Executive Summary
4 Market Landscape
- 4.1 Market Overview
- 4.2 Market Drivers
- 4.2.1 Growing infrastructure development
- 4.2.2 Surge in renewable-energy (wind-farm) installations
- 4.2.3 Industrial growth across emerging economies
- 4.2.4 Accelerated urbanisation and megaproject pipelines
- 4.2.5 Telematics-driven fleet optimisation (under-radar)
- 4.2.6 Adoption of hybrid/e-cranes to meet site-emission rules (under-radar)
- 4.3 Market Restraints
- 4.3.1 High capital and operating costs
- 4.3.2 Economic cyclicality of construction spending
- 4.3.3 Shortage of certified crane operators (under-radar)
- 4.3.4 Carbon-footprint scrutiny and cradle-to-grave reporting (under-radar)
- 4.4 Value / Supply-Chain Analysis
- 4.5 Regulatory Landscape
- 4.6 Technological Outlook
- 4.7 Porter's Five Forces
- 4.7.1 Threat of New Entrants
- 4.7.2 Bargaining Power of Buyers
- 4.7.3 Bargaining Power of Suppliers
- 4.7.4 Threat of Substitute Products
- 4.7.5 Intensity of Competitive Rivalry
5 Market Size and Growth Forecasts
- 5.1 By Type
- 5.1.1 Mobile Crane
- 5.1.1.1 All-terrain Crane
- 5.1.1.2 Rough-terrain Crane
- 5.1.1.3 Crawler Crane
- 5.1.1.4 Truck-mounted Crane
- 5.1.1.5 Other Mobile Cranes
- 5.1.2 Fixed Crane
- 5.1.2.1 Monorail and Under-hung
- 5.1.2.2 Overhead Track-mounted
- 5.1.2.3 Tower Crane
- 5.1.3 Marine and Offshore Crane
- 5.1.3.1 Mobile Harbor Crane
- 5.1.3.2 Fixed Harbor Crane
- 5.1.3.3 Offshore Crane
- 5.1.3.4 Ship Crane
- 5.1.1 Mobile Crane
- 5.2 By Capacity
- 5.2.1 Up to 50 T
- 5.2.2 51 to 150 T
- 5.2.3 151 to 300 T
- 5.2.4 Above 300 T
- 5.3 By Power Source
- 5.3.1 Diesel
- 5.3.2 Hybrid
- 5.3.3 Fully Electric
- 5.4 By Boom Type
- 5.4.1 Lattice Boom
- 5.4.2 Telescopic Boom
- 5.5 By Application
- 5.5.1 Construction and Mining
- 5.5.2 Energy and Utilities
- 5.5.3 Shipbuilding and Ports
- 5.5.4 Industrial Manufacturing
- 5.5.5 Logistics and Warehousing
- 5.6 By Geography
- 5.6.1 North America
- 5.6.1.1 United States
- 5.6.1.2 Canada
- 5.6.1.3 Rest of North America
- 5.6.2 South America
- 5.6.2.1 Brazil
- 5.6.2.2 Argentina
- 5.6.2.3 Rest of South America
- 5.6.3 Europe
- 5.6.3.1 Germany
- 5.6.3.2 United Kingdom
- 5.6.3.3 France
- 5.6.3.4 Italy
- 5.6.3.5 Spain
- 5.6.3.6 Rest of Europe
- 5.6.4 Asia-Pacific
- 5.6.4.1 China
- 5.6.4.2 Japan
- 5.6.4.3 India
- 5.6.4.4 South Korea
- 5.6.4.5 Rest of Asia-Pacific
- 5.6.5 Middle East and Africa
- 5.6.5.1 Saudi Arabia
- 5.6.5.2 United Arab Emirates
- 5.6.5.3 South Africa
- 5.6.5.4 Rest of Middle East and Africa
- 5.6.1 North America
6 Competitive Landscape
- 6.1 Market Concentration
- 6.2 Strategic Moves
- 6.3 Market Share Analysis
- 6.4 Company Profiles (includes Global level Overview, Market level overview, Core Segments, Financials as available, Strategic Information, Market Rank/Share for key companies, Products and Services, and Recent Developments)
- 6.4.1 Liebherr-International AG
- 6.4.2 Tadano Ltd.
- 6.4.3 Konecranes Plc
- 6.4.4 Manitowoc Co.
- 6.4.5 XCMG Group
- 6.4.6 Terex Corporation
- 6.4.7 SANY Group
- 6.4.8 Zoomlion Heavy Industry Sci and Tech
- 6.4.9 Kobelco Construction Machinery
- 6.4.10 Palfinger AG
- 6.4.11 Hitachi Sumitomo Cranes
- 6.4.12 Favelle Favco Group
- 6.4.13 Cargotec Oyj (Hiab)
- 6.4.14 Sarens NV
- 6.4.15 Mammoet
- 6.4.16 Link-Belt Cranes
- 6.4.17 Altec Inc.
- 6.4.18 Effer SpA
- 6.4.19 Bocker Maschinenwerke
7 Market Opportunities and Future Outlook
- 7.1 White-space and Unmet-Need Assessment
 全地形起重機市場:2026-2032年全球市場預測(依起重能力、技術、燃料類型、應用和經營模式)
 全球固定式起重機市場規模、佔有率、趨勢和成長分析報告(2026-2034年)全球折臂起重機市場規模、佔有率、趨勢和成長分析報告(2026-2034)港口起重機變頻器市場:按起重機類型、驅動類型、控制技術、電壓、輸出、分銷管道、應用分類,全球預測(2026-2032年)單極導線系統市場(按額定電壓、導線材料、絕緣類型、安裝位置和最終用戶產業分類),全球預測,2026-2032年多極導線市場(依導線材料、額定電流、絕緣類型、應用和分銷管道分類),全球預測(2026-2032年)起重機導纜器系統市場按安裝方式、材料、額定電流、導體、應用、最終用途產業和分銷管道分類,全球預測,2026-2032年全球起重機卡車市場規模、佔有率、趨勢和成長分析報告(2026-2034年)
 日本起重機市場報告:按產品類型、應用和地區分類(2026-2034年)起重機市場規模、佔有率、趨勢及預測(按產品類型、應用和地區分類,2026-2034年)