


 |
市場調查報告書
商品編碼
1851306
物聯網 (IoT):市場佔有率分析、產業趨勢、統計數據和成長預測 (2025-2030)Internet Of Things (IoT) - Market Share Analysis, Industry Trends & Statistics, Growth Forecasts (2025 - 2030) |
||||||
※ 本網頁內容可能與最新版本有所差異。詳細情況請與我們聯繫。
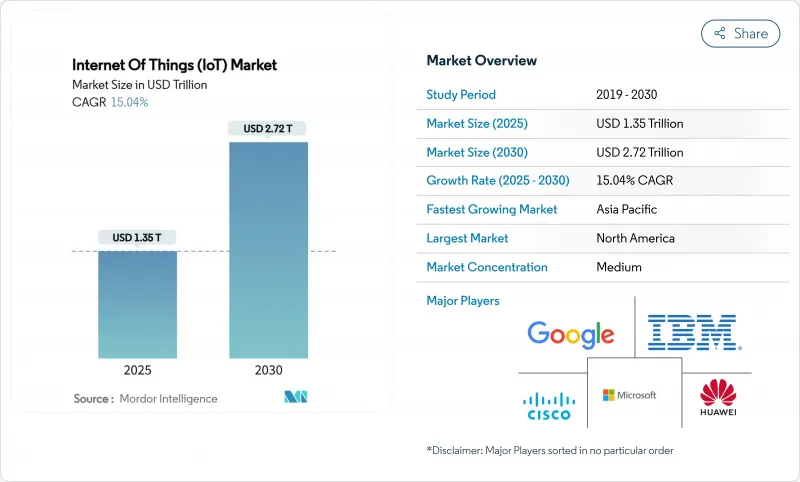
預計到 2025 年,物聯網 (IoT) 市場規模將達到 1.35 兆美元,到 2030 年將達到 2.72 兆美元,年複合成長率為 15.04%。
對即時分析、預測性維護和自主決策系統的強勁需求正在加速其在工廠、農場和物流中心的部署。 5G的快速普及、低功率廣域網路的成長以及感測器成本的下降,正在擴大互聯資產的覆蓋範圍。企業也越來越重視邊緣人工智慧,它既能保護資料主權,也能確保毫秒的反應速度。因此,各主要產業的投資正不斷從先導計畫轉向全面生產。物聯網市場在堅實的技術獎勵上持續成長,這得益於穩健的資本投資以及旨在提高效率和永續性的監管激勵措施。
全球物聯網 (IoT) 市場趨勢與洞察
互聯設備的激增和感測器成本的下降
基礎環境感測器的單位成本已從 20 美元降至 5 美元以下,使得在工廠和農場進行高密度測量在經濟上可行。用於預測性維護的工業振動感測器現在的售價為 50 至 100 美元,而五年前的價格為 200 至 500 美元。硬體門檻的降低正在吸引新的軟體整合商,並擴大物聯網市場的人才庫。 BMW的專用 5G 生產網路已將數千個感測器連接到邊緣控制器,從而即時最佳化吞吐量。半導體暫時短缺造成了成本壓力,但減少元件數量的設計創新將維持價格下降的勢頭。隨著企業連結越來越小的資產,數據量將爆炸性成長,使分析服務成為成長最快的收入來源。
5G 和 LPWAN 的部署擴大了覆蓋範圍
目前,私有5G網路已成為超低延遲工業控制的基礎,約翰迪爾位於滑鐵盧的工廠就充分證明了這一點,該工廠的彈性生產線依賴無線重配置。 LoRaWAN和NB-IoT網路與5G網路相輔相成,連接了蜂窩網路經濟性仍落後的偏遠地區、礦場和管線。 Kineis和其他微型衛星營運商透過實現對牲畜群和海上資產的持續可視性,填補了剩餘的通訊空白。電訊營運商正在調整其頻譜和回程傳輸投資,以使設備密度與可實現的回報相匹配。這種接入方式的整合將使物聯網市場能夠全面覆蓋人口密集的城市園區和人口稀少的偏遠地區。
日益嚴重的網路安全和隱私侵犯事件
互聯資產擴大了攻擊面,勒索軟體已導致工廠生產線停工,並暴露出其獨特的攻擊手段。歐盟網路安全法規強制規定了最低加密和修補程式要求,迫使供應商承擔更高的合規成本。工業買家對安全啟動晶片組和零信任架構的需求日益成長,提高了低成本供應商的進入門檻。雖然資料外洩事件可能會暫時減緩物聯網技術的普及,但在物聯網市場,長期安全投入通常會轉化為更高的合約價值。
細分市場分析
到2024年,服務收入將佔總收入的34%,這凸顯了將設備和數據轉化為可衡量成果的複雜性。諮詢團隊負責繪製工作流程圖、建立安全架構並最佳化儀錶板,從而將感測器資料流轉化為營運價值。儘管硬體價格持續下降,但整合需求推高了專業人員的人事費用,鞏固了服務在物聯網市場中佔據最大佔有率的地位。邊緣平台結合了容器編配和OTA修補功能,其複合年成長率將達到17.51%,因為買家堅持將延遲和資料管治保留在本地。連接模組能夠吸收成本通貨緊縮,並提高解決方案組裝商的利潤率,這些組裝商可以將容量轉售到數千個終端。
對靈活基礎設施的需求推動了混合拓撲結構的出現,其中閘道器代理決定哪些資料保留在本地,哪些資料遷移到雲端。這種編配促使人們對超大規模雲端和工廠車間控制器之間的 API 協調性提出更高要求。軟體供應商正在整合自動化機器學習引擎,以持續微調模型,並強化訂閱模式,將客戶鎖定在其生態系統中。同時,衛星通訊業者正與地面通訊業者合作,捆綁備用連接,擴大物聯網市場的地理覆蓋範圍。那些將硬體、整合和生命週期管理打包到基於結果的合約中的供應商,正在從以組件為中心的競爭對手手中奪取市場佔有率。
預計到2024年,製造業支出將佔總支出的29.5%,因為工廠依靠預測性維護、機器人協同和供應鏈透明度來確保運作。西門子報告稱,與改造棕地工廠以連接傳統機器相關的數位維修產業訂單創下歷史新高。隨著監管機構加強排放審核,環境、健康和安全儀錶板將受到更多關注。因此,儘管面臨宏觀經濟逆風,工業工廠的物聯網市場規模預計仍將強勁成長。
相較之下,農業將以19.2%的複合年成長率實現最快成長。土壤探測器、無人機影像和衛星鏈路使農民能夠近乎即時地調整施肥和灌溉,從而降低每公頃的投入成本。新興企業正在將感測器、分析和信貸服務打包成訂閱模式,使中型農戶也能負擔得起。畜牧養殖戶正在為牲畜佩戴項圈,以監測體溫、反芻率和位置,從而減少疾病爆發和被捕食造成的損失。隨著公共機構大力推動糧食安全,津貼正在加速互聯農場的普及,並將物聯網產業的基本客群。
區域分析
2024年,北美將佔全球收入的32.3%,這得益於成熟的5G部署、廣泛的專用蜂窩網路牌照發放以及強大的數位原民勞動力。從汽車到食品加工等各行各業的工業設施都在定期試點頻譜共用網路,將高保真數據傳輸到邊緣AI控制器。因此,儘管宏觀環境波動,物聯網市場仍保持穩定的資本配置。
預計到2030年,亞太地區將以15.1%的複合年成長率成長,主要得益於各國政府將物聯網納入製造業補貼和智慧城市規劃。到2030年,印度、中國和東南亞的授權行動電話連接數將達到2.7億。中國將加快對國內晶片代工廠的投資,以降低出口管制的不確定性;印度將利用與生產掛鉤的獎勵來吸引感測器組裝廠。越南和印尼的新興企業將整合低功耗廣域網路(LPWAN)閘道器和雲端平台,以低成本幫助中型工廠上線。總而言之,這些趨勢將共同擴大物聯網在全部區域的市場規模。
在歐洲,環境合規是重中之重,基於感測器的排放追蹤已成為企業報告的必要組成部分。隱私法規鼓勵現場處理,從而推動了邊緣運算的普及。公私合作聯盟正在資助智慧港口物流和跨境貨物透明系統。中東和非洲仍處於應用初期,但有望在基於衛星的牲畜監測和太陽能水資源管理方面取得突破。國際發展機構正在資助能夠快速見效的先導計畫,以培養本地專業技術並擴大物聯網市場基礎。
其他福利:
- Excel格式的市場預測(ME)表
- 3個月的分析師支持
目錄
第1章 引言
- 研究假設和市場定義
- 調查範圍
第2章調查方法
第3章執行摘要
第4章 市場情勢
- 市場概覽
- 市場促進因素
- 連網型設備的激增和感測器成本的下降
- 透過部署 5G 和 LPWAN 擴大覆蓋範圍。
- 邊緣人工智慧分析提供即時價值
- 低地球軌道衛星物聯網釋放遠端監控潛力
- 與環境、社會及治理 (ESG) 相關的供應鏈報告義務
- 基於物聯網遠端檢測的使用量為基礎的保險
- 市場限制
- 日益嚴重的網路安全和隱私侵犯事件
- 通訊協定碎片化和低互通性
- 出口限制對晶片/模組供應帶來壓力
- 邊緣人工智慧的功耗會對設備電池帶來壓力。
- 價值鏈分析
- 監管環境
- 技術展望
- 波特五力分析
- 供應商的議價能力
- 買方的議價能力
- 新進入者的威脅
- 替代品的威脅
- 競爭對手之間的競爭
- 定價分析
- 主要用例和案例研究
- 宏觀經濟與疫情影響分析
第5章 市場規模與成長預測
- 按組件
- 硬體(感測器、處理器、連接模組、閘道器)
- 軟體/平台(設備管理、資料管理、分析、安全)
- 連線類型(蜂窩網路(2G-5G)、LPWAN(NB-IoT、LoRaWAN、Sigfox)、衛星、近距離通訊(Wi-Fi、BLE、Zigbee))
- 服務(專業服務、託管服務、整合服務)
- 按最終用戶行業分類
- 製造業和工業
- 運輸與物流
- 醫療保健和生命科學
- 零售與電子商務
- 能源與公共產業
- 住宅和智慧建築
- 農業
- 政府與智慧城市
- 透過使用
- 資產追蹤和車隊管理
- 預測性維護
- 智慧電錶
- 遠端患者監護
- 智慧家庭和家電
- 聯網汽車和V2X
- 環境與氣候監測
- 按部署模式
- 雲
- 本地部署
- 邊緣/混合
- 按地區
- 北美洲
- 美國
- 加拿大
- 墨西哥
- 南美洲
- 巴西
- 阿根廷
- 歐洲
- 德國
- 英國
- 法國
- 西班牙
- 義大利
- 俄羅斯
- 亞太地區
- 中國
- 印度
- 日本
- 韓國
- ASEAN
- 亞太其他地區
- 中東和非洲
- 中東
- 沙烏地阿拉伯
- 阿拉伯聯合大公國
- 土耳其
- 非洲
- 南非
- 奈及利亞
- 埃及
- 北美洲
第6章 競爭情勢
- 市場集中度
- 策略舉措和夥伴關係
- 市佔率分析
- 公司簡介
- Amazon Web Services
- Microsoft Corporation
- Google LLC
- Cisco Systems
- Huawei Technologies
- Siemens AG
- IBM Corporation
- PTC Inc.
- Robert Bosch GmbH
- Honeywell International
- Oracle Corporation
- SAP SE
- AT&T
- Aeris Communications
- Fujitsu
- Wipro
- Intel Corporation
- Ericsson
- Qualcomm
- Advantech
- Sierra Wireless(Semtech)
- Quectel Wireless
- Telit Cinterion
- u-blox
第7章 市場機會與未來展望
The internet of things market stands at USD 1,350 billion in 2025 and is forecast to reach USD 2,720 billion by 2030, advancing at a 15.04% CAGR.
Strong demand for real-time analytics, predictive maintenance, and autonomous decision systems is accelerating deployments across factories, farms, and logistics hubs. Rapid 5G roll-outs, growth of low-power wide-area networks, and falling sensor costs expand the addressable base of connected assets. Enterprises also value edge AI because it protects data sovereignty while guaranteeing millisecond response times. As a result, investment continues to shift from pilot projects to full-scale production across every major vertical. The Internet of Things market, therefore, continues to compound on a solid technology foundation supported by resilient capital spending and regulatory incentives aimed at efficiency and sustainability.
Global Internet Of Things (IoT) Market Trends and Insights
Connected-device proliferation and falling sensor costs
Unit prices for basic environmental sensors have declined from USD 20 to below USD 5, making dense instrumentation economically viable across factories and farms. Industrial-grade vibration sensors used in predictive maintenance now retail for USD 50-100 compared with USD 200-500 only five years ago. Lower hardware barriers attract new software integrators, broadening the Internet of Things market talent pool. BMW's private 5G production network already links thousands of sensors to edge controllers that optimize throughput in real time. Temporary semiconductor shortages create cost pressure, yet design innovations that reduce component counts preserve downward price momentum. As firms connect ever-smaller assets, data volumes rise sharply, cementing analytics services as the fastest-growing revenue pool.
5G and LPWAN roll-outs widen coverage
Private 5G now underpins ultra-low-latency industrial control, demonstrated by John Deere's Waterloo Works where flexible manufacturing lines rely on wire-free reconfiguration. LoRaWAN and NB-IoT networks complement 5G by linking remote fields, mines, and pipelines where cellular economics still lag. Kineis and other nanosatellite operators bridge remaining gaps, enabling continuous visibility of livestock herds and maritime assets. Telecom operators coordinate spectrum and backhaul investments to match device density with viable returns. These converging access options keep the internet of things market on an inclusive path that spans both dense urban campuses and sparsely populated frontiers.
Escalating cybersecurity and privacy breaches
Connected assets expand the attack surface, with ransomware already halting factory lines and exposing proprietary recipes. The EU Cyber Resilience Act sets minimum encryption and patching obligations, forcing vendors to absorb higher compliance costs. Industrial buyers increasingly request secure-boot chipsets and zero-trust architectures, raising barriers for low-cost suppliers. Breach headlines could momentarily slow adoption, yet long-term security spending often translates into higher total contract values within the internet of things market.
Other drivers and restraints analyzed in the detailed report include:
- Edge-AI analytics enable real-time value
- LEO-satellite IoT unlocks remote monitoring
- Protocol fragmentation and poor interoperability
For complete list of drivers and restraints, kindly check the Table Of Contents.
Segment Analysis
Services contributed 34% of 2024 revenue, underscoring the complexity of turning devices and data into measurable outcomes. Consulting teams map workflows, build secure architectures, and optimize dashboards that convert sensor streams into operational value. Hardware prices keep falling, yet integration demands elevate specialist labor rates, cementing services as the largest slice of the internet of things market. Edge platforms that blend container orchestration with OTA patching expand at 17.51% CAGR as buyers insist latency and data governance stay onsite. Connectivity modules absorb cost deflation, widening profit margins for solution assemblers who resell capacity across thousands of endpoints.
The push toward flexible infrastructure drives hybrid topologies where gateway agents decide what stays local and what travels to the cloud. Such orchestration intensifies demand for API harmonization between hyperscale clouds and factory floor controllers. Software vendors embed auto-ML engines that fine-tune models continuously, reinforcing subscriptions that lock customers into ecosystems. Meanwhile, satellite operators partner with terrestrial carriers to bundle fallback connectivity, broadening geographic applicability of the internet of things market. Vendors that package hardware, integration, and lifecycle management under outcome-based contracts are capturing share from component-centric rivals.
Manufacturing held 29.5% of 2024 spending as factories rely on predictive maintenance, robot coordination, and supply-chain transparency to safeguard uptime. Siemens reports record digital industries orders tied to brown-field retrofits that network legacy machines.Automotive plants deploy thousands of torque and vibration sensors, feeding edge AI that quarantines anomalies before they trigger costly downtime. Environmental, health, and safety dashboards gain prominence as regulators tighten emission audits. Consequently, the Internet of Things market size for industrial plants is expected to expand steadily despite macro headwinds.
Agriculture, by contrast, grows fastest at a 19.2% CAGR. Soil probes, drone imagery, and satellite links allow farmers to adjust fertilizer and irrigation in near real time, lowering input costs per hectare. Start-ups bundle sensors, analytics, and credit services into subscription models affordable to mid-sized holdings. Livestock ranchers fit collars that monitor temperature, rumination, and location, trimming disease outbreaks and predation losses. As public agencies push food security, grant funding accelerates connected-farm adoption, broadening the Internet of Things industry customer base beyond early adopters.
The IoT Market Report is Segmented by Component (Hardware, Software, Services, and More), End-User Industry (Agriculture, Retail and E-Commerce, Energy and Utilities, and More), Application (Asset Tracking and Fleet Management, Predictive Maintenance, Smart Metering, and More), Deployment Model (Cloud, On-Premises, and More), and Geography
Geography Analysis
North America owned 32.3% of 2024 revenue, anchored by mature 5G roll-outs, wide adoption of private cellular licenses, and a robust digital-native workforce. Industrial facilities from automotive to food processing routinely pilot spectrum-sharing networks that stream high-fidelity data to edge AI controllers.Policy frameworks prioritize innovation yet codify minimum security standards, promoting trust without stifling experimentation. Consequently, the Internet of Things market continues to see steady capital allocations even when macro conditions fluctuate.
Asia-Pacific is projected to grow at 15.1% CAGR through 2030 as governments embed IoT into manufacturing subsidies and smart-city blueprints. Licensed cellular connections are set to reach 270 million by 2030 across India, China, and Southeast Asia. China accelerates domestic chip foundry investments to buffer export control uncertainties, while India leverages production-linked incentives to attract sensor assembly plants. Start-ups in Vietnam and Indonesia integrate LPWAN gateways with cloud dashboards, bringing mid-tier factories online at low cost. Together, these trends expand the Internet of Things market size across a demographically diverse region.
Europe emphasizes environmental compliance, making sensor-driven emissions tracking integral to corporate reporting. Edge deployments rise because privacy regulations encourage onsite processing. Public-private consortia finance smart port logistics and cross-border freight transparency systems. Middle East and Africa remain earlier in the adoption curve but leapfrog with satellite-enabled livestock monitoring and solar-powered water management. International development agencies fund pilot projects that demonstrate quick payback, nurturing localized expertise and widening the internet of things market footprint.
- Amazon Web Services
- Microsoft Corporation
- Google LLC
- Cisco Systems
- Huawei Technologies
- Siemens AG
- IBM Corporation
- PTC Inc.
- Robert Bosch GmbH
- Honeywell International
- Oracle Corporation
- SAP SE
- AT&T
- Aeris Communications
- Fujitsu
- Wipro
- Intel Corporation
- Ericsson
- Qualcomm
- Advantech
- Sierra Wireless (Semtech)
- Quectel Wireless
- Telit Cinterion
- u-blox
Additional Benefits:
- The market estimate (ME) sheet in Excel format
- 3 months of analyst support
TABLE OF CONTENTS
1 INTRODUCTION
- 1.1 Study Assumptions and Market Definition
- 1.2 Scope of the Study
2 RESEARCH METHODOLOGY
3 EXECUTIVE SUMMARY
4 MARKET LANDSCAPE
- 4.1 Market Overview
- 4.2 Market Drivers
- 4.2.1 Connected-device proliferation and falling sensor costs
- 4.2.2 5G and LPWAN roll-outs widen coverage
- 4.2.3 Edge-AI analytics enable real-time value
- 4.2.4 LEO-satellite IoT unlocks remote monitoring
- 4.2.5 ESG-linked supply-chain reporting mandates
- 4.2.6 Usage-based insurance powered by IoT telemetry
- 4.3 Market Restraints
- 4.3.1 Escalating cybersecurity and privacy breaches
- 4.3.2 Protocol fragmentation and poor interoperability
- 4.3.3 Export controls squeezing chip/module supply
- 4.3.4 Edge-AI power draw strains device batteries
- 4.4 Value Chain Analysis
- 4.5 Regulatory Landscape
- 4.6 Technological Outlook
- 4.7 Porter's Five Forces Analysis
- 4.7.1 Bargaining Power of Suppliers
- 4.7.2 Bargaining Power of Buyers
- 4.7.3 Threat of New Entrants
- 4.7.4 Threat of Substitutes
- 4.7.5 Intensity of Competitive Rivalry
- 4.8 Pricing Analysis
- 4.9 Key Use-Cases and Case Studies
- 4.10 Macroeconomic and Pandemic Impact Analysis
5 MARKET SIZE AND GROWTH FORECASTS (VALUE)
- 5.1 By Component
- 5.1.1 Hardware (Sensors, Processors, Connectivity Modules, Gateways)
- 5.1.2 Software / Platforms (Device Management, Data Management, Analytics, Security)
- 5.1.3 Connectivity Type (Cellular (2G-5G), LPWAN (NB-IoT, LoRaWAN, Sigfox), Satellite, Short-Range (Wi-Fi, BLE, Zigbee))
- 5.1.4 Services (Professional, Managed, Integration)
- 5.2 By End-user Industry
- 5.2.1 Manufacturing and Industrial
- 5.2.2 Transportation and Logistics
- 5.2.3 Healthcare and Life Sciences
- 5.2.4 Retail and E-commerce
- 5.2.5 Energy and Utilities
- 5.2.6 Residential and Smart Buildings
- 5.2.7 Agriculture
- 5.2.8 Government and Smart Cities
- 5.3 By Application
- 5.3.1 Asset Tracking and Fleet Management
- 5.3.2 Predictive Maintenance
- 5.3.3 Smart Metering
- 5.3.4 Remote Patient Monitoring
- 5.3.5 Smart Home and Appliances
- 5.3.6 Connected Vehicles and V2X
- 5.3.7 Environmental and Climate Monitoring
- 5.4 By Deployment Model
- 5.4.1 Cloud
- 5.4.2 On-premises
- 5.4.3 Edge / Hybrid
- 5.5 By Geography
- 5.5.1 North America
- 5.5.1.1 United States
- 5.5.1.2 Canada
- 5.5.1.3 Mexico
- 5.5.2 South America
- 5.5.2.1 Brazil
- 5.5.2.2 Argentina
- 5.5.3 Europe
- 5.5.3.1 Germany
- 5.5.3.2 United Kingdom
- 5.5.3.3 France
- 5.5.3.4 Spain
- 5.5.3.5 Italy
- 5.5.3.6 Russia
- 5.5.4 Asia Pacific
- 5.5.4.1 China
- 5.5.4.2 India
- 5.5.4.3 Japan
- 5.5.4.4 South Korea
- 5.5.4.5 ASEAN
- 5.5.4.6 Rest of Asia Pacific
- 5.5.5 Middle East and Africa
- 5.5.5.1 Middle East
- 5.5.5.1.1 Saudi Arabia
- 5.5.5.1.2 UAE
- 5.5.5.1.3 Turkey
- 5.5.5.2 Africa
- 5.5.5.2.1 South Africa
- 5.5.5.2.2 Nigeria
- 5.5.5.2.3 Egypt
- 5.5.1 North America
6 COMPETITIVE LANDSCAPE
- 6.1 Market Concentration
- 6.2 Strategic Moves and Partnerships
- 6.3 Market Share Analysis
- 6.4 Company Profiles (includes Global level Overview, Market level overview, Core Segments, Financials as available, Strategic Information, Market Rank/Share, Products and Services, Recent Developments)
- 6.4.1 Amazon Web Services
- 6.4.2 Microsoft Corporation
- 6.4.3 Google LLC
- 6.4.4 Cisco Systems
- 6.4.5 Huawei Technologies
- 6.4.6 Siemens AG
- 6.4.7 IBM Corporation
- 6.4.8 PTC Inc.
- 6.4.9 Robert Bosch GmbH
- 6.4.10 Honeywell International
- 6.4.11 Oracle Corporation
- 6.4.12 SAP SE
- 6.4.13 AT&T
- 6.4.14 Aeris Communications
- 6.4.15 Fujitsu
- 6.4.16 Wipro
- 6.4.17 Intel Corporation
- 6.4.18 Ericsson
- 6.4.19 Qualcomm
- 6.4.20 Advantech
- 6.4.21 Sierra Wireless (Semtech)
- 6.4.22 Quectel Wireless
- 6.4.23 Telit Cinterion
- 6.4.24 u-blox
7 MARKET OPPORTUNITIES AND FUTURE OUTLOOK
- 7.1 White-space and Unmet-need Assessment


