


 |
市場調查報告書
商品編碼
1906886
機器人技術:市場佔有率分析、產業趨勢與統計、成長預測(2026-2031)Robotics - Market Share Analysis, Industry Trends & Statistics, Growth Forecasts (2026 - 2031) |
||||||
※ 本網頁內容可能與最新版本有所差異。詳細情況請與我們聯繫。
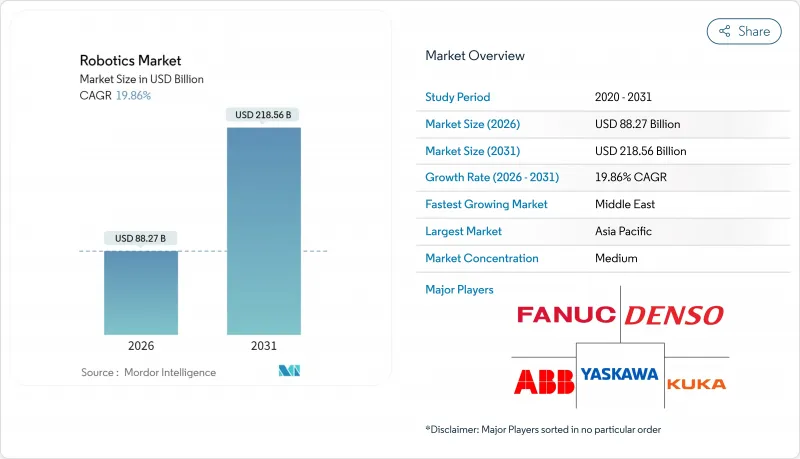
預計到2026年,機器人市場規模將達到882.7億美元,高於2025年的736.4億美元。預計到2031年,該市場規模將達到2,185.6億美元,2026年至2031年的複合年成長率為19.86%。
這種成長軌跡反映了已開發國家結構性勞動力短缺、自動化硬體成本持續下降,以及政府主導的將機器人定位為戰略基礎設施而非可自由支配的資本財的回流政策。大型企業正在加速採用機器人以在薪資壓力下穩定生產,而中小企業則透過協作機器人系統和機器人即服務合約獲得機器人的使用權。區域發展趨勢正在改變。亞太地區在銷售方面保持領先地位,中東地區由於主權財富基金的技術主導多元化舉措,正經歷著最快的成長。在供應方面,零件成本的下降和低程式碼程式設計平台正在重塑價值鏈,使其朝著軟體智慧方向發展,從而為掌握人工智慧控制技術的供應商提供永續的收入來源。網路安全漏洞、出口管制摩擦以及小規模用戶技能不足仍然是限制因素,但同時也為專業服務開闢了新的市場,尤其是在安全部署和生命週期支援方面。
全球機器人市場趨勢與洞察
勞動力短缺日益嚴重,推動了對自動化的需求。
日本、美國和西歐的人口結構逆風正促使自動化從降低成本轉向保障產能。到2024年,七國集團(G7)製造業將面臨超過200萬個工廠職位空缺,而日本的機器人密度已達到創紀錄的每萬名員工399台機器人。像Stellantis這樣的汽車製造商正在悄悄推進協同部署,採用人性化的機器人單元,既能留住員工,又能減少重複性勞損。全球機器人市場受益於這些結構性缺口,這些缺口貫穿整個經濟週期,為供應商提供了一個不受GDP波動影響的可預測需求基礎。
每功能小時機器人平均價格下降
由於零件的商品化和大規模生產,協作機器人的價格將從2024年起每年下降約15%,而軟體升級已使其性價比加倍。中國製造商正在以19.9萬元人民幣(約27,512美元)的價格銷售入門級人形機器人,使機器人技術進入了中小型工廠的資本預算範圍。硬體成本的下降將使中小型製造商和新興市場製造商更快地接受機器人技術,從而擴大全球機器人市場的潛在客戶群。
中小企業持續整合技能短缺
68%的中小企業仍缺乏部署機器人所需的技術人才,導致投資回收期長、運轉率率低。系統整合商集中在都市區,農村企業服務不足。如果缺乏加速技能培養和承包服務模式,全球機器人市場仍將是巨大的未開發潛力。
細分市場分析
到2025年,工業機器人將佔據全球機器人市場71.04%的佔有率,這主要得益於高生產率的汽車和電子產品組裝的持續需求。然而,協作機器人將在2031年之前繼續以25.64%的複合年成長率成長,這主要得益於安全認證的力感應技術以及低於3萬美元的價格,使其進入中小企業的預算範圍。這種轉變表明,靈活的、由人工監督的單元,而非封閉的圍欄,將推動全球機器人市場下一波應用浪潮。
中國協作機器人製造商的快速成長預計將使中國國內市場佔有率在2017年至2024年間從35%提升至73%,加劇價格競爭並加速全球機器人銷售成長。服務型機器人領域也持續成長,預計到2025年,手術系統市場規模將超過41.8億美元,再次印證醫療產業是成長最快的終端用戶領域。這種多元化發展將有助於緩解全球機器人市場的周期性波動,並使硬體供應商免受單一產業衰退的影響。
儘管到2025年硬體支出仍將佔總支出的63.12%,但隨著人工智慧成為關鍵價值促進因素,軟體收入預計將以22.91%的年成長率成長。更高等級的控制堆疊融合了雲端分析和強化學習技術,而ABB的OmniCore平台可將循環時間縮短25%,電力消耗量降低20%。隨著客戶從資本支出模式轉向營運支出模式,預計到2031年,全球基於訂閱的「機器人即服務」(Robot-as-a-Service)市場規模將成長兩倍。
涵蓋整合、遠端監控和預測性維護的業務收益進一步強化了供應商鎖定。因此,軟體和服務之間的界限變得模糊,續訂權和網路安全補丁被捆綁在多年期合約中。這一趨勢正在重塑利潤結構,並提高了全球機器人市場中純粹以硬體為中心的廠商的准入門檻。
區域分析
到2025年,亞太地區將佔據全球機器人市場37.72%的佔有率,主要得益於中國每年部署43萬台工業機器人以及全球整體三分之二的機器人專利核准數量。中國工廠正在將機器人整合到鋰離子電池和消費性電子產品生產線中,本土品牌也正在擴大出口,充分利用該地區在全球機器人市場的成本競爭力。在日本,FANUC)累計2024年利潤將達到1,802億日圓(約16.4億美元),主要得益於中國市場需求的復甦和國內人口結構變化所帶來的壓力。在韓國,一項耗資26億美元的公私合作計畫正在利用人形機器人技術實現電池工廠的自動化,這反映了韓國對該技術的戰略重視。
預計到2031年,中東地區的複合年成長率將達到21.31%,位居全球之首。這主要得益於主權財富基金將過剩的石油和天然氣資本重新投入工業數位化、物流和醫療機器人領域。阿拉伯聯合大公國自由貿易區正在試點將自主移動機器人(AMR)應用於倉庫,以支援區域電子商務物流並減少對移民工人的過度依賴。此外,各國政府也正在資助先進製造地建設,並吸引全球系統整合商,從而擴大全球機器人市場的潛在基本客群。
北美市場需求仍然強勁,主要得益於國防契約,例如《晶片製造和整合法案》(CHIPS Act)下的半導體代工廠契約,以及授予安杜里爾公司(Anduril)的價值6.422億美元的海軍無人機合約。歐洲則專注於安全的人機協作標準和永續性目標,德國每年撥款6,900萬歐元(約7,500萬美元)用於人工智慧整合,為其發展提供了有力支撐。這兩個地區都在增加對高價值軟體和整合技術的投資,而將通用子組件生產外包給亞洲的趨勢,則反映了全球機器人市場正在採取的「槓鈴式」策略。
其他福利:
- Excel格式的市場預測(ME)表
- 3個月的分析師支持
目錄
第1章 引言
- 研究假設和市場定義
- 調查範圍
第2章調查方法
第3章執行摘要
第4章 市場情勢
- 市場概覽
- 市場促進因素
- 勞動力短缺加劇,導致自動化需求不斷成長
- 每功能小時機器人平均價格下降
- 低程式碼機器人程式設計平台的興起
- 七國集團國家製造業回流的財政獎勵措施
- 電子商務第三方物流業者在倉庫中採用自主移動機器人(AMR)的現狀
- 國家級人形機器人研發任務(例如,中國2025)
- 市場限制
- 中小企業永續融入的技能差距
- 對先進伺服電機的地緣政治出口管制
- 稀土元素磁鐵價格波動
- ROS部署中的網路安全漏洞
- 價值鏈分析
- 監管環境
- 技術展望
- 波特五力分析
- 新進入者的威脅
- 供應商的議價能力
- 買方的議價能力
- 替代品的威脅
- 競爭對手之間的競爭
- 對宏觀經濟趨勢的市場評估
第5章 市場規模與成長預測
- 按機器人類型
- 工業機器人
- 服務機器人
- 協作機器人(cobots)
- 移動/AMR
- 按組件
- 硬體
- 軟體
- 服務(整合、RaaS)
- 透過使用
- 製造和組裝
- 物流/倉儲業
- 醫學與外科
- 國防與安全
- 檢查和維護
- 清潔和衛生管理
- 按最終用戶行業分類
- 車
- 電子和半導體
- 食品/飲料
- 醫療保健提供者
- 軍事/國防
- 其他終端用戶產業
- 按地區
- 北美洲
- 美國
- 加拿大
- 墨西哥
- 歐洲
- 德國
- 英國
- 法國
- 其他歐洲地區
- 亞太地區
- 中國
- 印度
- 日本
- 亞太其他地區
- 南美洲
- 巴西
- 阿根廷
- 其他南美洲
- 中東
- 阿拉伯聯合大公國
- 沙烏地阿拉伯
- 其他中東地區
- 非洲
- 南非
- 奈及利亞
- 其他非洲地區
- 北美洲
第6章 競爭情勢
- 市場集中度
- 策略趨勢
- 市佔率分析
- 公司簡介
- ABB Ltd.
- Fanuc Corporation
- Yaskawa Electric Corporation
- KUKA AG
- Kawasaki Heavy Industries Ltd
- Universal Robots A/S(Teradyne)
- Denso Corporation
- Mitsubishi Electric Corporation
- Omron Corporation
- Staubli International AG
- Epson Robots(Seiko Epson)
- Comau SpA
- Nachi-Fujikoshi Corp.
- Toshiba Corporation
- Intuitive Surgical Inc.
- Stryker Corporation
- iRobot Corporation
- Boston Dynamics Inc.
- Locus Robotics Corp.
- DJI Technology Co. Ltd
第7章 市場機會與未來展望
Robotics market size in 2026 is estimated at USD 88.27 billion, growing from 2025 value of USD 73.64 billion with 2031 projections showing USD 218.56 billion, growing at 19.86% CAGR over 2026-2031.
This growth trajectory reflects structural labor shortages in advanced economies, systematic cost deflation in automation hardware, and government-backed reshoring programs that treat robots as strategic infrastructure rather than optional capital goods. Large enterprises accelerate adoption to stabilise production amid wage pressure, while small and medium firms now gain access through collaborative systems and Robot-as-a-Service contracts. Regional momentum is shifting: Asia-Pacific retains volume leadership, but the Middle East shows the quickest pace as sovereign funds pursue technology-driven diversification. On the supply side, declining component costs and low-code programming platforms reshape the value chain toward software intelligence, setting up recurring revenue streams for vendors that master artificial-intelligence-based control. Cyber-security weaknesses, export-control friction, and skill gaps among smaller users remain braking forces, yet they also open specialist service niches, especially around secure deployment and lifecycle support.
Global Robotics Market Trends and Insights
Rising Labour-Shortage Led Automation Demand
Demographic headwinds in Japan, the United States, and much of Western Europe have shifted automation from cost-saving to capacity-assurance mode. Unfilled factory vacancies topped 2 million roles across G-7 manufacturing in 2024, while Japan's robot density reached 399 units per 10,000 employees, the highest on record. Automakers such as Stellantis adopted human-centric robotic cells that trim repetitive strain injuries yet safeguard headcount, signalling a nuanced push toward collaborative deployment. The global robotics market benefits because these structural gaps persist through economic cycles, giving vendors a predictable demand base that decouples from GDP volatility.
Declining Average Robot Price Per Functional Hour
Component commoditisation and scale production cut collaborative robot prices by roughly 15% a year post-2024, while software upgrades doubled performance relative to price. Chinese suppliers even marketed entry-level humanoids at CNY 199,000 (USD 27,512), placing robots within small-factory capital budgets. As hardware costs slide, adoption curves steepen among small and emerging-market manufacturers, thereby widening the addressable pool for the global robotics market.
Persistent SME Integration Skill-Gap
Sixty-eight percent of SMEs still lack engineering talent for robotics deployment, prolonging payback periods and dampening utilisation rates. Integrators cluster in urban hubs, leaving regional firms underserved. Without accelerated skills development or turnkey service models, the global robotics market leaves considerable latent demand untapped.
Other drivers and restraints analyzed in the detailed report include:
- Proliferation of Low-Code Robot-Programming Platforms
- Fiscal Incentives for Reshoring Manufacturing in G-7
- Geopolitical Export-Control on Advanced Servos
For complete list of drivers and restraints, kindly check the Table Of Contents.
Segment Analysis
Industrial robots accounted for 71.04% of the global robotics market in 2025, riding sustained demand from high-throughput automotive and electronics assembly lines. Yet collaborative robots expand at a 25.64% CAGR to 2031, underpinned by safety-certified force-sensing and sub-USD 30,000 price tags that place them within SME budgets. This pivot signals that flexible, human-supervised cells, rather than fenced-off lines, will drive the next deployment wave of the global robotics market.
A surge in Chinese cobot makers lifted their domestic share from 35% to 73% between 2017 and 2024, heightening price competition and accelerating worldwide unit growth. Service-robot niches also flourish: surgical systems surpassed USD 4.18 billion in 2025, reaffirming healthcare as the fastest-rising end-use. This diversification reduces cyclicality for the global robotics market and cushions hardware vendors against single-sector downturns.
Hardware still represented 63.12% of 2025 spending, but software revenue is set to grow 22.91% annually as artificial intelligence becomes the primary value driver. Higher-level control stacks now incorporate cloud analytics and reinforcement learning that deliver 25% faster cycle times with 20% lower electricity use on ABB's OmniCore platform. The global robotics market size for subscription-based Robot-as-a-Service is projected to treble by 2031 as customers migrate from capital expenditure toward operating expenditure models.
Service revenues, covering integration, remote monitoring, and predictive maintenance, further solidify vendor lock-in. As a result, software and services blur, embedding update rights and cyber-security patches into multi-year contracts. This trend rewires profit pools and raises entry barriers for purely hardware-centric challengers within the global robotics market.
The Robotics Market Report is Segmented by Robot Type (Industrial Robots, Service Robots, and More), Component (Hardware, Software, and Services), Application (Manufacturing and Assembly, Logistics and Warehousing, Medical and Surgical, and More), End-User Industry (Automotive, Electronics and Semiconductor, Food and Beverage, and More), and Geography. The Market Forecasts are Provided in Terms of Value (USD).
Geography Analysis
Asia-Pacific secured 37.72% of global robotics market share in 2025, anchored by China's 430,000 annual industrial-robot installations and two-thirds of worldwide robotics patent grants. Chinese factories integrate robots into lithium-ion battery and consumer-electronics lines, while domestic brands escalate exports, embedding regional cost competitiveness into the global robotics market. Japan posted JPY 180.2 billion (USD 1.64 billion) profit at Fanuc in 2024 on revived Chinese demand and domestic demographic pressure. South Korea's USD 2.6 billion public-private programme channels humanoid expertise toward battery-plant automation, underscoring strategic prioritisation.
The Middle East registers the highest 21.31% CAGR to 2031 as sovereign wealth vehicles divert hydrocarbons surplus into industrial digitalisation, logistics, and healthcare robotics. Free-trade zones in the United Arab Emirates trial warehouse AMRs to service regional e-commerce flows, reducing over-reliance on seasonal migrant labour. National programmes additionally fund advanced manufacturing hubs that attract global integrators, amplifying the addressable base for the global robotics market.
North American demand remains resilient, propelled by CHIPS-Act-backed fabs and defence contracts such as the USD 642.2 million Navy counter-drone award to Anduril. Europe focuses on safe human-robot collaboration standards and sustainability targets, helped by EUR 69 million (USD 75 million) in annual German funding for artificial-intelligence integration. Both regions increasingly outsource commodity sub-assemblies to Asia while investing in high-value software and integration, reflecting a barbell strategy within the global robotics market.
- ABB Ltd.
- Fanuc Corporation
- Yaskawa Electric Corporation
- KUKA AG
- Kawasaki Heavy Industries Ltd
- Universal Robots A/S (Teradyne)
- Denso Corporation
- Mitsubishi Electric Corporation
- Omron Corporation
- Staubli International AG
- Epson Robots (Seiko Epson)
- Comau SpA
- Nachi-Fujikoshi Corp.
- Toshiba Corporation
- Intuitive Surgical Inc.
- Stryker Corporation
- iRobot Corporation
- Boston Dynamics Inc.
- Locus Robotics Corp.
- DJI Technology Co. Ltd
Additional Benefits:
- The market estimate (ME) sheet in Excel format
- 3 months of analyst support
TABLE OF CONTENTS
1 INTRODUCTION
- 1.1 Study Assumptions and Market Definition
- 1.2 Scope of the Study
2 RESEARCH METHODOLOGY
3 EXECUTIVE SUMMARY
4 MARKET LANDSCAPE
- 4.1 Market Overview
- 4.2 Market Drivers
- 4.2.1 Rising labour-shortage led automation demand
- 4.2.2 Declining average robot price per functional hour
- 4.2.3 Proliferation of low-code robot-programming platforms
- 4.2.4 Fiscal incentives for reshoring manufacturing in G-7
- 4.2.5 Warehouse AMR roll-outs by e-commerce 3PLs
- 4.2.6 Nation-level humanoid RandD missions (e.g., China 2025)
- 4.3 Market Restraints
- 4.3.1 Persistent SME integration skill-gap
- 4.3.2 Geopolitical export-control on advanced servos
- 4.3.3 Rare-earth magnet price volatility
- 4.3.4 Cyber-security vulnerabilities in ROS deployments
- 4.4 Value Chain Analysis
- 4.5 Regulatory Landscape
- 4.6 Technological Outlook
- 4.7 Porter's Five Forces Analysis
- 4.7.1 Threat of New Entrants
- 4.7.2 Bargaining Power of Suppliers
- 4.7.3 Bargaining Power of Buyers
- 4.7.4 Threat of Substitutes
- 4.7.5 Intensity of Competitive Rivalry
- 4.8 Assessment of Macro Economic Trends on the Market
5 MARKET SIZE AND GROWTH FORECASTS (VALUES)
- 5.1 By Robot Type
- 5.1.1 Industrial Robots
- 5.1.2 Service Robots
- 5.1.3 Collaborative (Cobots)
- 5.1.4 Mobile/AMR
- 5.2 By Component
- 5.2.1 Hardware
- 5.2.2 Software
- 5.2.3 Services (Integration, RaaS)
- 5.3 By Application
- 5.3.1 Manufacturing and Assembly
- 5.3.2 Logistics and Warehousing
- 5.3.3 Medical and Surgical
- 5.3.4 Defense and Security
- 5.3.5 Inspection and Maintenance
- 5.3.6 Cleaning and Sanitation
- 5.4 By End-User Industry
- 5.4.1 Automotive
- 5.4.2 Electronics and Semiconductor
- 5.4.3 Food and Beverage
- 5.4.4 Healthcare Providers
- 5.4.5 Military and Defense
- 5.4.6 Other End-user Industries
- 5.5 By Geography
- 5.5.1 North America
- 5.5.1.1 United States
- 5.5.1.2 Canada
- 5.5.1.3 Mexico
- 5.5.2 Europe
- 5.5.2.1 Germany
- 5.5.2.2 United Kingdom
- 5.5.2.3 France
- 5.5.2.4 Rest of Europe
- 5.5.3 Asia-Pacific
- 5.5.3.1 China
- 5.5.3.2 India
- 5.5.3.3 Japan
- 5.5.3.4 Rest of Asia-Pacific
- 5.5.4 South America
- 5.5.4.1 Brazil
- 5.5.4.2 Argentina
- 5.5.4.3 Rest of South America
- 5.5.5 Middle East
- 5.5.5.1 United Arab Emirates
- 5.5.5.2 Saudi Arabia
- 5.5.5.3 Rest of Middle East
- 5.5.6 Africa
- 5.5.6.1 South Africa
- 5.5.6.2 Nigeria
- 5.5.6.3 Rest of Africa
- 5.5.1 North America
6 COMPETITIVE LANDSCAPE
- 6.1 Market Concentration
- 6.2 Strategic Moves
- 6.3 Market Share Analysis
- 6.4 Company Profiles (includes Global level Overview, Market level overview, Core Segments, Financials as available, Strategic Information, Market Rank/Share for key companies, Products and Services, and Recent Developments)
- 6.4.1 ABB Ltd.
- 6.4.2 Fanuc Corporation
- 6.4.3 Yaskawa Electric Corporation
- 6.4.4 KUKA AG
- 6.4.5 Kawasaki Heavy Industries Ltd
- 6.4.6 Universal Robots A/S (Teradyne)
- 6.4.7 Denso Corporation
- 6.4.8 Mitsubishi Electric Corporation
- 6.4.9 Omron Corporation
- 6.4.10 Staubli International AG
- 6.4.11 Epson Robots (Seiko Epson)
- 6.4.12 Comau SpA
- 6.4.13 Nachi-Fujikoshi Corp.
- 6.4.14 Toshiba Corporation
- 6.4.15 Intuitive Surgical Inc.
- 6.4.16 Stryker Corporation
- 6.4.17 iRobot Corporation
- 6.4.18 Boston Dynamics Inc.
- 6.4.19 Locus Robotics Corp.
- 6.4.20 DJI Technology Co. Ltd
7 MARKET OPPORTUNITIES AND FUTURE OUTLOOK
- 7.1 White-Space and Unmet-Need Assessment
 2026年全球機器人技術市場報告
 機器人俱樂部保險市場分析及預測(至2035年):按類型、產品、服務、技術、組件、應用、部署、最終用戶、功能和解決方案分類
 無線影像傳輸設備市場:按傳輸技術、設備類型、應用和最終用戶產業分類,全球預測(2026-2032年)機器人市場分析及預測(至2035年):類型、產品類型、服務、技術、組件、應用、最終用戶、功能、部署類型、設備
 全球烹飪機器人市場規模、佔有率、趨勢和成長分析報告(2026-2034)
 日本製造機器人市場規模、佔有率、趨勢及預測(按組件、類型、最終用戶和地區分類),2026-2034年2026年全球烹飪機器人市場報告機器人產業塗料及應用技術全球市場報告(2026)
 2025-2029年全球個人與居家照護機器人市場
 機器人導盲犬市場-全球產業規模、佔有率、趨勢、機會、預測:按應用、分銷、地區和競爭格局分類,2021-2031年