


 |
市場調查報告書
商品編碼
1851221
英國可再生能源:市場佔有率分析、行業趨勢、統計數據和成長預測(2025-2030 年)United Kingdom Renewable Energy - Market Share Analysis, Industry Trends & Statistics, Growth Forecasts (2025 - 2030) |
||||||
※ 本網頁內容可能與最新版本有所差異。詳細情況請與我們聯繫。
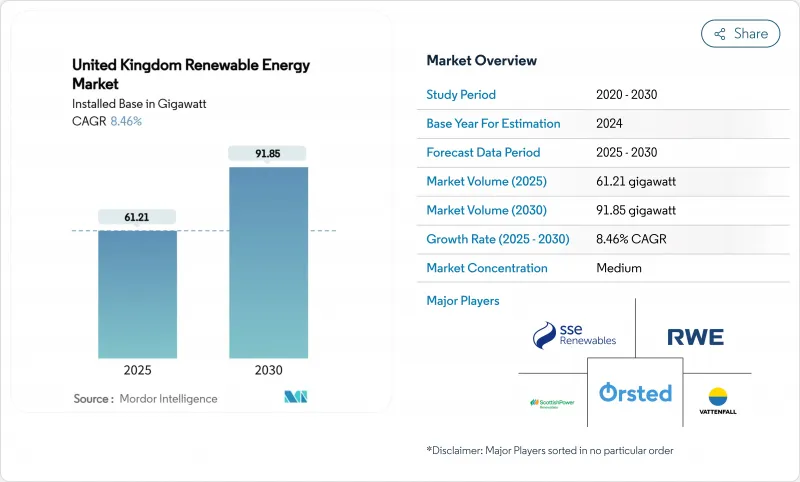
英國可再生能源裝置容量預計將從 2025 年的 61.21 吉瓦成長到 2030 年的 91.85 吉瓦,預測期(2025-2030 年)複合年成長率為 8.46%。
快速部署符合《2030年清潔電力行動計畫》,該計畫旨在加強能源安全目標,同時減少石化燃料進口,並爭取實現95%的清潔電力生產。到2024年,可再生能源將佔全國電力供應的46.4%,首次超過天然氣,凸顯了對低碳電力的結構性需求。推動因素包括離岸風力發電的主導、光伏發電資本投資的下降以及透過差價合約(CfD)機制實現的長期收益保障。政策的明朗化、企業購電協議的簽署以及加強輸電網路的承諾提高了計劃的融資可行性,投資意願仍然強勁。
英國可再生能源市場趨勢與洞察
北海管線建設加速,離岸風電差價合約執行價格重置
在前一次零競標之後,政府在第六輪分配中提高了成交價,恢復了商業性可行性,並簽訂了 5.3 吉瓦的新產能契約,其中包括 Hornsea 3 和 4 號項目。每年 6-8 吉瓦的可預測競標有助於擴大供應鏈規模,並將北海開發平臺提升至 37 吉瓦以上,從而支持到 2030 年實現 50 吉瓦的目標。
差價合約計畫可提供確定的利潤
自啟動以來,雙邊差價合約機制目前已支持該國超過40%的可再生能源發電,並調動了超過1000億英鎊的私人資本。該機制擴展至潮汐能和浮動式風力發電,拓寬了其適用範圍,並持續降低大型計劃的加權平均資本成本。
國家電網連接排隊導致五年連線延遲
連接隊列已膨脹至 739 吉瓦,多個計劃的截止日期定於 2035 年。英國天然氣和電力市場管理局 (Ofgem) 的 TMO4+「先準備就緒,先連接」改革和耗資 310 億英鎊的「大電網升級」計畫旨在釋放 500 吉瓦的容量,但真正的緩解可能只有在短期加固措施(例如耗資 43 億英鎊的東部綠色連接 2 號電纜)實施後才能實現。
細分市場分析
到2024年,風能將佔英國發電量的53%,這主要得益於高容量係數的離岸風電場,例如3.6兆瓦的道格灘(Dogger Bank)風電場。同時,太陽能光電發電在2025年至2030年間將以11.2%的複合年成長率(CAGR)成為成長最快的能源。先進的15兆瓦風力渦輪機以及固定式和浮體式基礎將進一步鞏固風能的主導地位,而從2025年起實施的簡化規劃和強制性屋頂光伏部署將有助於太陽能發電迎頭趕上。水力發電和生質能源能將繼續做出穩健貢獻,其中生質能源的普及需要等到2030年後才能實現捕碳封存的商業性。對潮汐能和波浪能技術的創新融資正在推動英國可再生能源市場實現多元化的長期成長。
太陽能光電發電和經濟實惠的屋頂光伏系統的激增將推動住宅和商業用戶的採用,而潮汐能示範項目和浮動式風力發電原型項目將開闢新的能源領域。這些轉變將使英國可再生能源市場繼續平衡其發電貢獻,不再僅以風能主導。
英國可再生能源市場報告按發電來源(風能、太陽能、水力、生質能源及其他)、裝置容量(超過10兆瓦、超過100千瓦但小於10兆瓦、小於100千瓦)和終端用戶產業(公共產業、商業/工業、住宅)進行細分。市場規模和預測以裝置容量(吉瓦)為單位。
其他福利:
- Excel格式的市場預測(ME)表
- 3個月的分析師支持
目錄
第1章 引言
- 研究假設和市場定義
- 調查範圍
第2章調查方法
第3章執行摘要
第4章 市場情勢
- 市場概覽
- 市場促進因素
- 離岸風電差價合約執行價格下跌加速北海管線建設
- 差價合約(CfD)系統提供收入確定性
- 英國資料中心與重工業購電方的企業購電協定(PPA)興起
- Ofgem的RIIO-ED2電網升級承諾將促進分散式太陽能發電
- 綠色氫能戰略將電解槽建設與可再生能源連結起來
- 降低蘇格蘭深水區浮體式海上風力渦輪機的成本。
- 市場限制
- 國家電網排隊瓶頸導致五年連線延遲
- 智慧出口保障:關稅削減衝擊屋頂太陽能投資報酬率
- 英國脫歐後,離岸風力發電單樁基礎的成本上升。
- 視覺影響問題阻礙了陸上風電授權
- 供應鏈分析
- 監理展望
- 技術展望
- 波特五力模型
- 新進入者的威脅
- 供應商的議價能力
- 買方的議價能力
- 替代品的威脅
- 產業間競爭
- PESTEL 分析
第5章 市場規模與成長預測
- 按能源來源
- 風力發電(陸域風力發電、離岸風力發電、浮體式海上風力發電)
- 太陽能發電(公共產業太陽能發電、商業/工業屋頂太陽能發電、住宅屋頂太陽能發電)
- 水力發電(小型、大型、抽水蓄能)
- 生質能源(生質能、沼氣)
- 其他(地熱、潮汐、波浪)
- 按安裝規模
- 超過10兆瓦
- 100 kW~10 MW
- 小於100千瓦
- 按最終用戶部門
- 公共產業
- 商業和工業
- 住房
第6章 競爭情勢
- 市場集中度
- 策略性舉措(併購、夥伴關係、購電協議)
- 市場佔有率分析(主要企業的市場排名/佔有率)
- 公司簡介
- SSE Renewables
- Orsted A/S
- ScottishPower Renewables(Iberdrola SA)
- RWE Renewables GmbH
- Vattenfall AB
- EDF Energy
- Statkraft AS
- RES Group Ltd.
- Brookfield Renewable Partners
- Greencoat UK Wind PLC
- Bluefield Solar Income Fund
- Octopus Renewables Infrastructure Trust
- NextEnergy Solar Fund
- Equinor ASA
- TotalEnergies SE
- Siemens Gamesa Renewable Energy SA
- Vestas Wind Systems A/S
- GE Vernova
- Lightsource BP
- Drax Group PLC
第7章 市場機會與未來展望
The United Kingdom Renewable Energy Market size in terms of installed base is expected to grow from 61.21 gigawatt in 2025 to 91.85 gigawatt by 2030, at a CAGR of 8.46% during the forecast period (2025-2030).
Rapid deployment aligns with the Clean Power 2030 Action Plan that targets 95% clean electricity generation, reinforcing energy-security ambitions while cutting fossil-fuel imports . Renewables supplied 46.4% of national electricity in 2024, overtaking gas for the first time and underscoring structural demand for low-carbon power. Drivers include offshore wind leadership, falling solar PV capex, and long-dated revenue certainty from the Contracts-for-Difference (CfD) scheme. Investment appetite remains strong as policy clarity, corporate power-purchase agreements, and grid-upgrade commitments improve project bankability.
United Kingdom Renewable Energy Market Trends and Insights
Offshore-wind CfD strike-price resets accelerating the North Sea pipeline
After the previous zero-bid outcome, the government raised strike prices in Allocation Round 6, restoring commercial viability and contracting 5.3 GW of new capacity, including Hornsea 3 and 4. Predictable annual auctions of 6-8 GW underpin supply-chain scaling and have lifted the North Sea development pipeline above 37 GW, supporting the 50 GW by 2030 target .
Contracts-for-Difference scheme providing revenue certainty
Since its inception, the two-way CfD mechanism now backs over 40% of national renewable generation and has mobilized over GBP 100 billion of private capital. Expanding eligibility to tidal streams and floating wind broadens technology coverage and continues to lower the weighted cost of capital for large projects.
National Grid queue bottlenecks causing five-year connection delays
The connection queue has ballooned to 739 GW, with some projects assigned 2035 dates. Ofgem's TMO4+ "first ready, first connected" reforms and the GBP 31 billion Great Grid Upgrade aim to free 500 GW of capacity, yet material relief will appear only after near-term reinforcements such as the GBP 4.3 billion Eastern Green Link 2 cable.
Other drivers and restraints analyzed in the detailed report include:
- Rise of corporate PPAs from UK data-centre and industrial off-takers
- Ofgem RIIO-ED2 grid-upgrade commitments boosting distributed solar
- Reduced Smart-Export-Guarantee tariff hitting rooftop solar ROI
For complete list of drivers and restraints, kindly check the Table Of Contents.
Segment Analysis
Wind contributed 53% of 2024 generation, anchored by high-capacity-factor offshore sites such as the 3.6 GW Dogger Bank complex, while solar posts the fastest 2025-2030 CAGR at 11.2% . Advanced 15 MW turbines and fixed-plus-floating foundations extend wind's edge, but streamlined planning and mandated rooftop deployment from 2025 propel solar's catch-up. Hydro and bioenergy remain steady contributors; the latter awaits commercial bioenergy with carbon capture and storage after 2030. Innovation funding for tidal stream and wave technologies positions the UK renewable energy market for diversified long-term growth.
The solar surge and cost-effective rooftop systems encourage residential and corporate uptake, while tidal stream demonstrators and floating wind prototypes open new resource areas. These shifts ensure the UK renewable energy market continues to rebalance source contributions beyond the current wind-led profile.
The United Kingdom Renewable Energy Market Report is Segmented by Source (Wind, Solar, Hydro, Bioenergy, and Other), Installation Scale (Above 10 MW, 100 KW To 10 MW, and Below 100 KW), and End-User Sector (Utilities, Commercial and Industrial, and Residential). The Market Sizes and Forecasts are Provided in Terms of Installed Capacity (GW).
List of Companies Covered in this Report:
- SSE Renewables
- Orsted A/S
- ScottishPower Renewables (Iberdrola SA)
- RWE Renewables GmbH
- Vattenfall AB
- EDF Energy
- Statkraft AS
- RES Group Ltd.
- Brookfield Renewable Partners
- Greencoat UK Wind PLC
- Bluefield Solar Income Fund
- Octopus Renewables Infrastructure Trust
- NextEnergy Solar Fund
- Equinor ASA
- TotalEnergies SE
- Siemens Gamesa Renewable Energy SA
- Vestas Wind Systems A/S
- GE Vernova
- Lightsource BP
- Drax Group PLC
Additional Benefits:
- The market estimate (ME) sheet in Excel format
- 3 months of analyst support
TABLE OF CONTENTS
1 Introduction
- 1.1 Study Assumptions & Market Definition
- 1.2 Scope of the Study
2 Research Methodology
3 Executive Summary
4 Market Landscape
- 4.1 Market Overview
- 4.2 Market Drivers
- 4.2.1 Offshore-wind CfD Strike-Price Declines Accelerating North-Sea Pipeline
- 4.2.2 Contracts-for-Difference (CfD) Scheme Providing Revenue Certainty
- 4.2.3 Rise of Corporate PPAs from UK Data-Centre & Heavy-Industry Off-takers
- 4.2.4 Ofgem RIIO-ED2 Grid-Upgrade Commitments Boosting Distributed Solar
- 4.2.5 Green-Hydrogen Strategy Linking Electrolyser Build-out to Renewables
- 4.2.6 Cost Drop in Floating Offshore Turbines for Deep-water Scottish Sites
- 4.3 Market Restraints
- 4.3.1 National-Grid Queue Bottlenecks Causing 5-year Connection Delays
- 4.3.2 Reduced Smart-Export-Guarantee Tariff Hitting Rooftop Solar ROI
- 4.3.3 Offshore-Wind Monopile Cost Inflation Post-Brexit Steel Tariffs
- 4.3.4 Visual-Impact Objections Stalling Onshore Wind Permitting
- 4.4 Supply-Chain Analysis
- 4.5 Regulatory Outlook
- 4.6 Technological Outlook
- 4.7 Porter's Five Forces
- 4.7.1 Threat of New Entrants
- 4.7.2 Bargaining Power of Suppliers
- 4.7.3 Bargaining Power of Buyers
- 4.7.4 Threat of Substitutes
- 4.7.5 Industry Rivalry
- 4.8 PESTLE Analysis
5 Market Size & Growth Forecasts
- 5.1 By Source
- 5.1.1 Wind (Onshore Wind, Offshore Wind, and Floating Offshore Wind)
- 5.1.2 Solar (Utility-scale PV, Commercial and Industrial Rooftop PV, and Residential Rooftop PV)
- 5.1.3 Hydro (Small, Large, Pumped Storage)
- 5.1.4 Bioenergy (Biomass, Biogas)
- 5.1.5 Other (Geothermal, Tidal-Stream, Wave)
- 5.2 By Installation Scale
- 5.2.1 Above 10 MW
- 5.2.2 100 kW to 10 MW
- 5.2.3 Below 100 kW
- 5.3 By End-User Sector
- 5.3.1 Utilities
- 5.3.2 Commercial and Industrial
- 5.3.3 Residential
6 Competitive Landscape
- 6.1 Market Concentration
- 6.2 Strategic Moves (M&A, Partnerships, PPAs)
- 6.3 Market Share Analysis (Market Rank/Share for key companies)
- 6.4 Company Profiles (includes Global level Overview, Market level overview, Core Segments, Financials as available, Strategic Information, Products & Services, and Recent Developments)
- 6.4.1 SSE Renewables
- 6.4.2 Orsted A/S
- 6.4.3 ScottishPower Renewables (Iberdrola SA)
- 6.4.4 RWE Renewables GmbH
- 6.4.5 Vattenfall AB
- 6.4.6 EDF Energy
- 6.4.7 Statkraft AS
- 6.4.8 RES Group Ltd.
- 6.4.9 Brookfield Renewable Partners
- 6.4.10 Greencoat UK Wind PLC
- 6.4.11 Bluefield Solar Income Fund
- 6.4.12 Octopus Renewables Infrastructure Trust
- 6.4.13 NextEnergy Solar Fund
- 6.4.14 Equinor ASA
- 6.4.15 TotalEnergies SE
- 6.4.16 Siemens Gamesa Renewable Energy SA
- 6.4.17 Vestas Wind Systems A/S
- 6.4.18 GE Vernova
- 6.4.19 Lightsource BP
- 6.4.20 Drax Group PLC
7 Market Opportunities & Future Outlook
- 7.1 White-space & Unmet-Need Assessment
- 7.2 10 GW Floating-Wind Pipeline Beyond 2030 Target
 2032 年可再生能源創新市場預測:按組件、技術、應用、最終用戶和地區進行的全球分析綠色/可再生能源市場預測至2032年:按能源來源、技術、應用、最終用戶和地區分類的全球分析
 全球綠色電力市場(按技術、產量、安裝類型和最終用戶分類)預測 2025-2032
 2025年全球節能設備市場報告2032年替代能源市場預測:按能源來源、最終用戶和地區分類的全球分析2025年全球能源諮詢市場報告2025年全球可再生能源保險市場報告再生能源市場:產業趨勢·全球預測 (~2035年):再生能源類型·用途·投資類型·企業類型·各地區2025年全球可再生能源綜合系統市場報告2025年全球可再生能源證書市場報告