


 |
市場調查報告書
商品編碼
1851186
排放監測系統:市場佔有率分析、產業趨勢、統計數據和成長預測(2025-2030 年)Emission Monitoring Systems - Market Share Analysis, Industry Trends & Statistics, Growth Forecasts (2025 - 2030) |
||||||
※ 本網頁內容可能與最新版本有所差異。詳細情況請與我們聯繫。
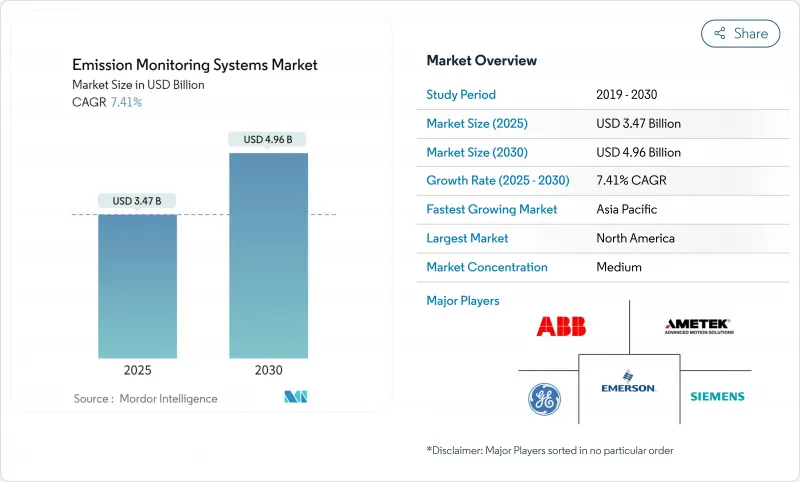
預計到 2025 年,排放監測系統市場價值將達到 34.7 億美元,到 2030 年將達到 49.6 億美元,年複合成長率為 7.41%。
更嚴格的空氣污染法規以及歐盟排放交易體系第四階段的直接碳貨幣化政策,推動了對更精確煙囪監測器的需求,同時,混合型、連續型和預測型架構的轉變正在重塑供應商的策略。儘管硬體仍然是最大的收入來源,佔2024年收入的46%,但服務業務的成長速度最快,複合年成長率達7.7%,因為用戶需要校準、認證和資料管理方面的支援。北美地區的裝機量領先,而亞太地區則以10%的最高成長率成長,這主要得益於中國和印度實施了新的工廠級限制措施。原位雷射分析儀,尤其是TDLS,正迅速取代垃圾焚化發電發電廠的抽吸系統,從而降低約30%的生命週期成本。同時,人工智慧軟體模組正在將合規資料轉化為預測性維護和流程最佳化工具,從而降低15-20%的營業成本。
全球排放監測系統市場趨勢與洞察
從資本支出密集型CEMS到混合型CEMS-PEMS架構過渡
混合配置將來自複合迴圈監測系統 (CEMS) 硬體的直接讀數與基於軟體的排放模型相結合,在將初始投資成本降低 25% 至 30% 的同時,實現了相對於參考設備低於 3% 的誤差率。在美國環保署 (EPA)核准後,美國煉油廠和聯合循環燃氣發電廠正將預測模組視為一種替代二次污染物排放合規方案。美國平台供應商整合了機器學習演算法,可即時自動校準模型,從而縮短檢驗週期。雲端託管消除了本地 IT 開銷,降低了軟體價格,並將混合配置方案擴展到中型設施。分析師預測,到 2027 年,這種配置將佔據新型排放監測系統市場約四分之一的佔有率。
歐盟排放交易體系第四階段碳價格強制令推動煙囪級監測
2025年碳排放權價格超過每噸80歐元的預期,並將排放數據轉換為金融變數。為了最大限度地減少碳權的過度購買,電力、水泥和廢棄物管理營運商正在增設高精度分析儀,與之前的型號相比,精度提高了2-3個百分點。隨著覆蓋範圍擴大到航運和小型工業場所,東歐地區訂單激增,自2023年以來,安裝量增加了35%。工廠現在將監測器直接整合到製程控制迴路中,以便根據實際碳成本調整產量。能夠將監測硬體與自動化交易儀表板結合的供應商正在佔據更大的排放監測系統市場佔有率。
歐洲因TUV和MCERTS認證技術人員短缺而導致試運行延誤
歐洲合規要求由經TUV或MCERTS認證的技術人員進行現場審核。勞動力短缺高達40%,導致計劃啟動平均延遲長達六個月,尤其是在波蘭、羅馬尼亞和保加利亞。預計從2023年起,服務費用將上漲25%至30%,這將促使用戶轉向擁有內部服務部門的供應商。原始設備製造商(OEM)正在透過遠端協助套件來應對這項挑戰,這些工具包利用排放擴增實境(AR)頭戴設備來指導現場工作人員進行校準程序。儘管採取了這些變通方法,但在培訓管道擴大之前,技術人員短缺仍將限制排放監測系統市場的短期成長。
細分市場分析
到2024年,CEMS將佔該細分市場收入的71%。然而,由於雲端運算費用下降以及監管機構對預測演算法的支持,PEMS將以8.4%的複合年成長率超越CEMS。預計到2027年,與混合部署相關的排放監測系統市場規模將超過10億美元。煉油廠、燃氣渦輪機和石化裂解裝置是主要目標應用場景,因為這些設施的溫度、氧氣和污染物排放量之間存在密切關聯。由於許多工廠工程師缺乏建模方面的專業知識,因此提供承包資料科學支援的供應商將成為寶貴的資源。此外,不斷成長的軟體訂閱收入為供應商提供了穩定的年金收入,並促使其擺脫一次性硬體銷售的模式。
對於二氧化硫和顆粒物等主要污染物,由於法規要求直接測量,連續排放監測系統(CEMS)仍不可取代。因此,將用於關鍵氣體的小型分析儀與用於二次流的預測排放監測系統(PEMS)相結合的混合配置方案在新競標中越來越普遍。這種方法使營運商能夠在滿足合規要求和預算之間取得平衡,既能節省PEMS的成本,還能保持CEMS的完整性。在這種模式下,到2030年,純粹的預測型排放監測系統市場佔有率將不超過10%,但隨著人工智慧工具的改進和現場數據可靠性的提高,混合型系統的價值將穩步成長。
2024年,氣體分析儀、流量感測器和探頭將佔全球收入的46%,其中以多組分傅立葉變換紅外光譜儀(FTIR)和熱擴散雷射光譜儀(TDLS)為主導,這些儀器在水泥、鋼鐵和廢棄物等行業享有高價。同時,定期服務合約(校準、認證和數據檢驗)目前正以7.7%的複合年成長率成長。加拿大和韓國等國家碳市場等新的交易機制提高了數據準確性的重要性,並鼓勵進行年度或半年度審核。沒有內部測量團隊的終端使用者正在將合規性保證外包,這使得服務專家在整個排放監測系統市場中至關重要。
雲端原生軟體模組是另一大成長驅動力。供應商正在將自動化合規報告打包,這些報告可直接對應到歐盟和美國環保署的模板,從而減輕行政負擔。訂閱收入正以每年 18% 的速度成長,並正在重塑財務模式。一些原始設備製造商 (OEM) 正在推出排放監測即服務 (EMaaS) 計劃,將硬體租賃與全方位維護相結合,從而簡化客戶的現金支出。這種循環模式應能逐步減少對一次性硬體付款的依賴,並使排放排放氣體系統產業的收入來源多元化。
區域分析
北美地區在2024年的排名中佔39%的收入,這主要得益於電力和煉油業安裝的約15,000套連續排放監測系統(CEMS)。 《通貨膨脹控制法案》的激勵措施鼓勵電力公司更新其分析設備,而加拿大基於產量的定價結構則促進了中型製造商訂單。由於許多在2015年之前安裝的設備已接近使用壽命終點,改裝計劃佔據了訂單的大部分。將合規數據與維護計劃關聯起來,並與雲端儀錶板整合,如今已成為標準做法,這種數位整合對大多數競標都產生了影響。
亞太地區是成長最快的地區,年複合成長率達10%。中國的「十四五」規劃要求在約8萬家工廠安裝排放監測設備,其中許多工廠直接採用原位雷射技術。印度的國家清潔空氣計畫要求到2026年,在200多個燃煤電廠安裝連續煙囪,從而縮短採購週期。先進的分析儀供應商正與當地系統整合合作,以彌補採購規則和服務覆蓋範圍的不足。日本和韓國已運作成熟的排放監測系統,但仍在不斷升級到TDLS和量子連鎖平台,尤其是在垃圾焚化發電排放監測系統市場的裝機安裝基礎。
由於歐盟排放交易體系(EU-ETS)下碳定價和資料品質要求的提高,歐洲佔全球整體的25%。東歐成員國的擴張推動了初始部署,而西歐用戶則專注於提高執行時間和降低擁有成本。強制性年度校準和並行採樣測試帶來了相應比例更高的服務收入。中東和非洲地區雖然處於發展階段,但前景廣闊:沙烏地阿拉伯的「2030願景」將排放目標與產業多元化掛鉤,南非的碳排放稅正在加速採礦和電力產業監測技術的應用。對於尋求這些前沿機會的供應商而言,能夠耐受惡劣環境(例如,灰塵、高溫、鹽鹼)是一項關鍵的技術優勢。
其他福利:
- Excel格式的市場預測(ME)表
- 3個月的分析師支持
目錄
第1章 引言
- 研究假設和市場定義
- 調查範圍
第2章調查方法
第3章執行摘要
第4章 市場情勢
- 市場概覽
- 市場促進因素
- 歐洲從資本支出密集型CEMS轉型為混合CEMS-PEMS架構
- 歐盟碳排放交易體系第四階段碳定價強制令促進煙囪級監測(歐洲)
- 檢驗《通貨膨脹削減法案》稅額扣抵如何推動美國發電廠CEMS改裝激增
- 原位雷射感測器可將亞太地區垃圾焚化發電發電廠的生命週期成本降低30%。
- 印度國家清潔空氣計畫旨在加速燃煤連續排放管理系統(CEMS)。
- 國際海事組織2023年EEXI和CII法規促進船舶安全管理系統(SEMS)的採用(全球海事部門)
- 市場限制
- 歐洲因TUV和MCERTS認證技術人員短缺而導致試運行延誤
- 熱帶地區高濕度偏差會增加違規的風險
- 美國公共產業傳統DCS-DAQ互通性差距導致改裝成本上升
- 長期CEMS租賃模式(MEA)中的資本鎖定阻礙了PEMS的引進。
- 產業生態系分析
- 技術展望
- 波特五力分析
- 供應商的議價能力
- 買方的議價能力
- 新進入者的威脅
- 替代品的威脅
- 競爭對手之間的競爭
第5章 市場規模與成長預測
- 依系統類型
- 連續排放監測系統(CEMS)
- 預測性排放監測系統(PEMS)
- 按組件
- 硬體
- 氣體分析儀
- 流量不透明度監測儀
- 數據採集系統(DAS)
- 軟體
- 獨立的
- 雲端託管
- 服務
- 安裝與部署
- 校準和認證
- 支援與維護
- 硬體
- 透過監測技術
- 提煉
- 濕熱
- 冷乾
- 稀釋
- In-situ
- 可調諧二極體雷射光譜(TDLS)
- 提煉
- 按最終用戶行業分類
- 發電
- 燃煤發電
- 複合迴圈燃氣渦輪機
- 石油和天然氣
- 上游
- 中產階級
- 下游煉油廠
- 金屬和採礦
- 化工/石油化工
- 製藥
- 水泥和骨材
- 紙漿
- 垃圾焚化發電和焚燒
- 海事(船舶)
- 發電
- 按地區
- 北美洲
- 美國
- 加拿大
- 墨西哥
- 歐洲
- 德國
- 英國
- 法國
- 義大利
- 西班牙
- 其他歐洲地區
- 亞太地區
- 中國
- 日本
- 韓國
- 印度
- 東南亞
- 亞太其他地區
- 南美洲
- 巴西
- 其他南美洲
- 中東和非洲
- 中東
- 阿拉伯聯合大公國
- 沙烏地阿拉伯
- 其他中東地區
- 非洲
- 南非
- 其他非洲地區
- 北美洲
第6章 競爭情勢
- 市場集中度
- 策略趨勢
- 市佔率分析
- 公司簡介
- ABB Ltd.
- Siemens AG
- Emerson Electric Co.
- Thermo Fisher Scientific Inc.
- AMETEK Inc.
- Honeywell International Inc.
- Teledyne Technologies Inc.
- HORIBA Ltd.
- SICK AG
- Rockwell Automation Inc.
- General Electric Company
- Fuji Electric Co. Ltd.
- Advanced Emissions Solutions Inc.
- ENVEA Global SAS
- Parker Hannifin Corp.
- Baker Hughes Co.
- Cemtrex Inc.
- Babcock and Wilcox Enterprises Inc.
- Opsis AB
- Altech Environment USA
第7章 市場機會與未來展望
The emission monitoring systems market is valued at USD 3.47 billion in 2025 and is forecast to reach USD 4.96 billion by 2030, advancing at a 7.41% CAGR.
Stricter air-pollution rules and the direct monetization of carbon under the EU Emissions Trading System Phase IV are raising demand for higher-accuracy stack monitors, while the shift toward hybrid continuous-predictive architectures is redefining vendor strategies. Hardware still generates the largest revenue stream, holding 46% of 2024 sales, yet services are expanding fastest at a 7.7% CAGR as users seek calibration, certification, and data-management support. North America leads in installed base, but Asia Pacific records the highest 10% regional growth as China and India impose new plant-level limits. In-situ laser analyzers, particularly TDLS, are rapidly displacing extractive systems in waste-to-energy plants, lowering lifecycle outlays by roughly 30%. Simultaneously, AI-enabled software modules are turning compliance data into predictive-maintenance and process-optimization tools that trim operating costs by 15-20%.
Global Emission Monitoring Systems Market Trends and Insights
Transition from CAPEX-heavy CEMS to Hybrid CEMS-PEMS Architectures
Hybrid configurations blend direct readings from CEMS hardware with software-based emission models, lowering upfront expenditure by 25-30% while keeping error rates below 3% against reference instruments. Early adopters in U.S. refineries and combined-cycle gas plants now treat predictive modules as a compliance-accepted alternative for secondary pollutants after U.S. EPA approval. Global platform vendors embed machine-learning algorithms that auto-calibrate models in real time, shrinking validation cycles. As cloud hosting removes local IT overhead, software pricing is falling, opening the hybrid option to mid-sized facilities. Analysts expect this configuration to represent roughly one-quarter of all new emission monitoring systems market installations by 2027.
Mandatory EU-ETS Phase IV Carbon Pricing Driving Stack-Level Monitoring
Allowance prices above EUR 80 per tonne in 2025 have turned emissions data into a line-item financial variable. Operators in power, cement, and waste management have added high-precision analyzers that improve accuracy by 2-3 percentage points versus prior models, minimizing over-purchasing of carbon credits. Expansion of scope to maritime and small industrial sites has boosted new system orders across Eastern Europe, where installations jumped 35% since 2023. Plants now integrate monitors directly with process-control loops to throttle output against live carbon costs. Vendors able to pair monitoring hardware with automated trading dashboards have gained share in the emission monitoring systems market.
Scarcity of TUV & MCERTS-Certified Technicians Delaying European Commissioning
Compliance in Europe obliges on-site audits by technicians accredited under TUV or MCERTS frameworks. A 40% workforce shortfall has extended average project start-ups by up to six months, particularly in Poland, Romania, and Bulgaria. Hourly service rates have escalated 25-30% since 2023, pushing users toward vendors with in-house service arms. OEMs respond with remote-assistance toolkits that guide local staff through calibration sequences via augmented-reality headsets. Despite these work-arounds, the technician bottleneck trims near-term growth for the emission monitoring systems market until training pipelines expand.
Other drivers and restraints analyzed in the detailed report include:
- Inflation Reduction Act Tax-Credit Verification Creating Surge in U.S. Power-Plant CEMS Retrofits
- In-situ Laser-Based Sensors Cutting Lifecycle Cost by 30% in APAC Waste-to-Energy Plants
- Legacy DCS-DAQ Inter-operability Gaps Inflating Retrofit Costs in U.S. Utilities
For complete list of drivers and restraints, kindly check the Table Of Contents.
Segment Analysis
The segment opened 2024 with CEMS owning 71% of revenue thanks to universal regulatory acceptance. However, PEMS is outpacing at an 8.4% CAGR as cloud compute charges fall and regulators endorse predictive algorithms. The emission monitoring systems market size linked to hybrid deployments is projected to cross USD 1 billion by 2027, reflecting steadily rising adoption where processes run under steady-state conditions. Oil refineries, gas turbines, and petrochemical crackers see tight correlations between temperature, O2, and pollutant outputs, making them prime candidates. Vendors that package turnkey data-science support gain leverage, because many plant engineers lack modeling expertise. Incremental software subscriptions also give suppliers annuity revenue, shifting away from lumpy hardware sales.
CEMS remains irreplaceable for primary pollutants such as SO2 and particulate matter where laws demand direct readings. As a result, hybrid configurations that pair a compact analyzer for critical gases with PEMS for secondary streams dominate new bids. The approach lets operators balance compliance rigor and budget, preserving CEMS integrity while harvesting PEMS cost savings. Within this model, the emission monitoring systems market share of pure predictive installations is unlikely to top 10% by 2030, yet hybrid value will mount steadily as AI tools improve and field data builds confidence.
Gas analyzers, flow sensors, and probes generated 46% of global turnover in 2024, led by multi-component FTIR and TDLS instruments that command premium pricing in cement, steel, and waste-to-energy. Nevertheless, recurring service contracts-calibration, certification, and data validation-now advance at a 7.7% CAGR. New trading schemes such as national carbon markets in Canada and South Korea raise the stakes for data accuracy, prompting annual or semi-annual audits. End-users lacking internal metrology teams outsource compliance assurance, making service specialists pivotal across the emission monitoring systems market.
Cloud-native software modules add another growth lever. Suppliers bundle automated compliance reports that map directly to EU or EPA templates, cutting administrative workload. Subscription revenue is rising 18% annually, reshaping financial models. Some OEMs have introduced emissions-monitoring-as-a-service plans that combine hardware leases with full-scope maintenance, smoothing customer cash out-flows. This recurring model should gradually dilute lump-sum hardware dependence and diversify income streams in the emission monitoring systems industry.
The Emission Monitoring Market Report is Segmented by System Type (Continuous Emission Monitoring Systems (CEMS), and Predictive Emission Monitoring Systems (PEMS)), Component (Hardware, Software, and Services), Monitoring Technology (Extractive, Dilution, and In-Situ), End-User Industry (Power Generation, Oil and Gas, Metals and Mining, and More), and Geography. The Market Forecasts are Provided in Terms of Value (USD).
Geography Analysis
North America headed the 2024 rankings with 39% revenue, anchored by roughly 15,000 installed CEMS units across power and refining. Inflation Reduction Act incentives prompt utilities to modernize analyzers, while Canada's output-based pricing system spreads monitoring into mid-size manufacturing. Retrofit projects dominate order books because many units installed before 2015 reach end-of-life. Integration with cloud dashboards that link compliance data to maintenance planning is now standard practice, and this digital overlay influences most competitive bids.
Asia Pacific is the fastest-growing region at a 10% CAGR. China's 14th Five-Year Plan compels around 80,000 plants to install monitors, often leapfrogging directly to in-situ lasers. India's National Clean Air Programme mandates continuous stacks at more than 200 coal stations by 2026, compressing buying cycles. Advanced analyzer vendors partner with local system integrators to navigate procurement rules and service coverage gaps. Japan and South Korea already operate mature fleets but continue to upgrade to TDLS and quantum-cascade platforms, especially in waste-to-energy. Southeast Asia mirrors Chinese standards; Vietnam and Indonesia published guidelines modeled on GB standards in 2024, widening the install base for the emission monitoring systems market.
Europe represents 25% of global value, uniquely shaped by carbon-price exposure under the EU-ETS, which elevates data-quality requirements. Eastern-member expansion drives first-install volumes, while Western-EU users focus on uptime and cost-of-ownership gains. Service revenue is proportionally higher because annual calibrations and parallel-sampling tests are mandatory. The Middle East and Africa are nascent but promising: Saudi Arabia's Vision 2030 ties emissions targets to industrial diversification, and South Africa's carbon tax accelerates monitoring adoption in mining and power. Harsh-environment resilience-high dust, heat, and salinity-forms a technical differentiator for vendors chasing these frontier opportunities
- ABB Ltd.
- Siemens AG
- Emerson Electric Co.
- Thermo Fisher Scientific Inc.
- AMETEK Inc.
- Honeywell International Inc.
- Teledyne Technologies Inc.
- HORIBA Ltd.
- SICK AG
- Rockwell Automation Inc.
- General Electric Company
- Fuji Electric Co. Ltd.
- Advanced Emissions Solutions Inc.
- ENVEA Global SAS
- Parker Hannifin Corp.
- Baker Hughes Co.
- Cemtrex Inc.
- Babcock and Wilcox Enterprises Inc.
- Opsis AB
- Altech Environment U.S.A.
Additional Benefits:
- The market estimate (ME) sheet in Excel format
- 3 months of analyst support
TABLE OF CONTENTS
1 INTRODUCTION
- 1.1 Study Assumptions and Market Definition
- 1.2 Scope of the Study
2 RESEARCH METHODOLOGY
3 EXECUTIVE SUMMARY
4 MARKET LANDSCAPE
- 4.1 Market Overview
- 4.2 Market Drivers
- 4.2.1 Transition from CAPEX-heavy CEMS to Hybrid CEMS-PEMS Architectures in Europe
- 4.2.2 Mandatory EU-ETS Phase-IV Carbon Pricing Driving Stack-Level Monitoring (Europe)
- 4.2.3 Inflation Reduction Act Tax-Credit Verification Creating Surge in United States Power-Plant CEMS Retrofits
- 4.2.4 In-situ Laser-Based Sensors Cutting Lifecycle Cost by 30 % in Asia-Pacific Waste-to-Energy Plants
- 4.2.5 National Clean Air Programme Accelerating Coal-Fired CEMS Roll-outs (India)
- 4.2.6 IMO 2023 EEXI and CII Rules Triggering Ship-board SEMS Installations (Global Maritime)
- 4.3 Market Restraints
- 4.3.1 Scarcity of TUV and MCERTS-Certified Technicians Delaying European Commissioning
- 4.3.2 High Humidity Bias in Tropical Regions Raising False-Compliance Risk
- 4.3.3 Legacy DCS-DAQ Inter-operability Gaps Inflating Retrofit Costs in United States Utilities
- 4.3.4 Capital Lock-In from Long-Term CEMS Leasing Models Hindering PEMS Adoption (MEA)
- 4.4 Industry Ecosystem Analysis
- 4.5 Technological Outlook
- 4.6 Porter's Five Forces Analysis
- 4.6.1 Bargaining Power of Suppliers
- 4.6.2 Bargaining Power of Buyers
- 4.6.3 Threat of New Entrants
- 4.6.4 Threat of Substitutes
- 4.6.5 Intensity of Competitive Rivalry
5 MARKET SIZE AND GROWTH FORECASTS (VALUES)
- 5.1 By System Type
- 5.1.1 Continuous Emission Monitoring Systems (CEMS)
- 5.1.2 Predictive Emission Monitoring Systems (PEMS)
- 5.2 By Component
- 5.2.1 Hardware
- 5.2.1.1 Gas Analyzers
- 5.2.1.2 Flow and Opacity Monitors
- 5.2.1.3 Data Acquisition Systems (DAS)
- 5.2.2 Software
- 5.2.2.1 Stand-alone
- 5.2.2.2 Cloud-Hosted
- 5.2.3 Services
- 5.2.3.1 Installation and Deployment
- 5.2.3.2 Calibration and Certification
- 5.2.3.3 Support and Maintenance
- 5.2.1 Hardware
- 5.3 By Monitoring Technology
- 5.3.1 Extractive
- 5.3.1.1 Hot-Wet
- 5.3.1.2 Cold-Dry
- 5.3.2 Dilution
- 5.3.3 In-situ
- 5.3.3.1 Tunable Diode Laser Spectroscopy (TDLS)
- 5.3.1 Extractive
- 5.4 By End-User Industry
- 5.4.1 Power Generation
- 5.4.1.1 Coal-Fired
- 5.4.1.2 Combined-cycle Gas Turbines
- 5.4.2 Oil and Gas
- 5.4.2.1 Upstream
- 5.4.2.2 Midstream
- 5.4.2.3 Downstream and Refineries
- 5.4.3 Metals and Mining
- 5.4.4 Chemicals and Petrochemicals
- 5.4.5 Pharmaceuticals
- 5.4.6 Cement and Aggregates
- 5.4.7 Pulp and Paper
- 5.4.8 Waste-to-Energy and Incineration
- 5.4.9 Maritime (Ship-board)
- 5.4.1 Power Generation
- 5.5 By Geography
- 5.5.1 North America
- 5.5.1.1 United States
- 5.5.1.2 Canada
- 5.5.1.3 Mexico
- 5.5.2 Europe
- 5.5.2.1 Germany
- 5.5.2.2 United Kingdom
- 5.5.2.3 France
- 5.5.2.4 Italy
- 5.5.2.5 Spain
- 5.5.2.6 Rest of Europe
- 5.5.3 Asia-Pacific
- 5.5.3.1 China
- 5.5.3.2 Japan
- 5.5.3.3 South Korea
- 5.5.3.4 India
- 5.5.3.5 South East Asia
- 5.5.3.6 Rest of Asia-Pacific
- 5.5.4 South America
- 5.5.4.1 Brazil
- 5.5.4.2 Rest of South America
- 5.5.5 Middle East and Africa
- 5.5.5.1 Middle East
- 5.5.5.1.1 United Arab Emirates
- 5.5.5.1.2 Saudi Arabia
- 5.5.5.1.3 Rest of Middle East
- 5.5.5.2 Africa
- 5.5.5.2.1 South Africa
- 5.5.5.2.2 Rest of Africa
- 5.5.1 North America
6 COMPETITIVE LANDSCAPE
- 6.1 Market Concentration
- 6.2 Strategic Moves
- 6.3 Market Share Analysis
- 6.4 Company Profiles (includes Global level Overview, Market level overview, Core Segments, Financials as available, Strategic Information, Market Rank/Share for key companies, Products and Services, and Recent Developments)
- 6.4.1 ABB Ltd.
- 6.4.2 Siemens AG
- 6.4.3 Emerson Electric Co.
- 6.4.4 Thermo Fisher Scientific Inc.
- 6.4.5 AMETEK Inc.
- 6.4.6 Honeywell International Inc.
- 6.4.7 Teledyne Technologies Inc.
- 6.4.8 HORIBA Ltd.
- 6.4.9 SICK AG
- 6.4.10 Rockwell Automation Inc.
- 6.4.11 General Electric Company
- 6.4.12 Fuji Electric Co. Ltd.
- 6.4.13 Advanced Emissions Solutions Inc.
- 6.4.14 ENVEA Global SAS
- 6.4.15 Parker Hannifin Corp.
- 6.4.16 Baker Hughes Co.
- 6.4.17 Cemtrex Inc.
- 6.4.18 Babcock and Wilcox Enterprises Inc.
- 6.4.19 Opsis AB
- 6.4.20 Altech Environment U.S.A.
7 MARKET OPPORTUNITIES AND FUTURE OUTLOOK
- 7.1 White-space and Unmet-Need Assessment
 排放氣體監測系統市場(按類型、組件、部署模式和最終用戶分類)—全球預測,2025-2032
 2025年全球排放氣體監測系統市場報告2025年全球連續排放監測系統市場報告
 排放氣體監測系統市場規模、佔有率和成長分析(按產品、排放類型、系統類型、垂直和地區)- 產業預測 2025-2032
 排放監測系統市場規模和預測、全球和區域佔有率、趨勢和成長機會分析報告範圍:按功能、技術、類型、最終用戶和地理位置
 排放監測系統市場 - 按排放類型、監測技術、最終用戶產業、地區和競爭細分的全球產業規模、佔有率、趨勢、機會和預測,2019-2029F預測排放監測系統市場 - 全球產業規模、佔有率、趨勢、機會和預測,按行業、組件、部署、地區、競爭細分,2019-2029F排放監測系統市場(技術:預測排放監測系統和連續排放監測系統)- 2024-2034 年全球產業分析、規模、佔有率、成長、趨勢和預測
 到 2030 年排放監測系統的全球市場預測:按系統類型、排放類型、組件、應用、最終用戶和地區進行的全球分析
 排放監測系統市場 - 按組件、按系統類型、按技術、垂直領域和預測 2024 - 2032 年