


 |
市場調查報告書
商品編碼
1851166
智慧插座:市場佔有率分析、產業趨勢、統計數據和成長預測(2025-2030 年)Smart Plug - Market Share Analysis, Industry Trends & Statistics, Growth Forecasts (2025 - 2030) |
||||||
※ 本網頁內容可能與最新版本有所差異。詳細情況請與我們聯繫。
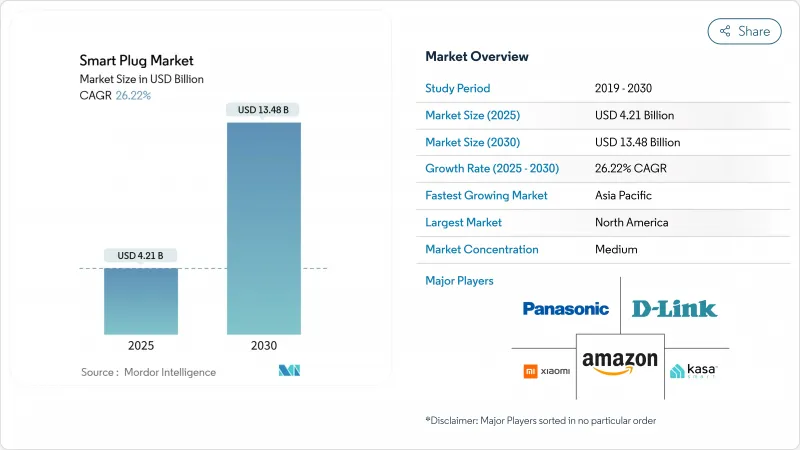
預計到 2025 年,智慧插座市場規模將達到 42.1 億美元,到 2030 年將達到 134.8 億美元,複合年成長率為 26.22%。
這項加速發展得益於以下因素:強制性能效法規將插座負載控制納入建築規範標準;Wi-Fi晶片組價格迅速下降,使得零售標籤價格低於10美元;以及Matter 1.3互通性標準打破了長期存在的生態系統壁壘。超低功耗的Wi-Fi 6微控制器(MCU)也將待機功耗降低至微安培級,從而實現了長達數年的電池壽命。審核顯示,每個設施每年浪費的插座負載高達36.8千瓦,這進一步激發了業界對智慧插座的興趣,使其成為領先的節能維修。亞太地區在印度的Alexa設備連接數量增加了三倍,而本地晶片組供應商正在降低本土品牌的材料成本。
全球智慧插座市場趨勢與洞察
語音助理生態系統正在迅速擴展
亞馬遜報告稱,未來三年內,印度的智慧家居設備銷售將成長200%。其將於2025年推出的Alexa+人工智慧服務,每月收費19.99美元,並與亞馬遜Prime會員捆綁銷售,這將重新定義智慧家庭的價值提案,使其不再局限於簡單的開關功能,而是能夠實現多設備場景的編配。訂閱模式鼓勵用戶更深入參與,並將智慧插座定位為基礎節點,從而將語音助理的功能擴展到傳統家電。 Alexa產品目錄中擁有超過14萬種相容設備,其網路效應降低了用戶接受智慧家庭的門檻,並提高了各個收入階層的用戶使用率。谷歌和蘋果也採取了類似的策略,它們越來越意識到,語音控制已成為所有新型插電設備的基本功能。
Wi-Fi晶片組ASP下降
Silicon Labs 的 SiWx917 MCU 將連接睡眠電流降低至 22 微安培,Synaptics降低了物料成本,並使其零售價低於 15 美元,同時又不犧牲能耗報告功能。 Synaptics 和中國新晉廠商 AIC Micro 正在進入價值 32 億美元的超低功耗物聯網 SoC 市場,加劇了價格競爭,並擴大了供應商選擇。大規模生產使得 ODM 廠商能夠在緊湊的機殼中整合雙 Wi-Fi/BLE 模組,同時保留支援 Matter 的韌體。新興市場將從中受益最多,因為該產品的經濟性使其更符合中等收入家庭的需求,從而擴大了裝置量,使其不再局限於早期用戶。
持久性設備網路安全漏洞
預計到2024年,針對智慧型裝置的網路攻擊將增加一倍以上,各大品牌都面臨嚴重的安全漏洞,損害了消費者的信任。 TP-Link揭露的本地通訊漏洞以及Mars Hydro事件(該事件導致27億個物聯網記錄外洩)凸顯了系統性風險。美國通訊委員會(FCC)在亞馬遜和谷歌的支持下,計劃設立「網路信任標誌」(Cybertrust Mark),並承諾提供更清晰的標籤,但最終規則尚未實施。產品召回事件,例如Emporia Energy因觸電危險召回8萬個智慧插頭,顯示了安全管理不善造成的經濟損失。在認證成為強制性要求之前,揮之不去的疑慮可能會推遲消費者的首次購買,尤其是在擁有嚴格IT政策的專業管理機構中。
細分市場分析
儘管藍牙在2024年仍將以31.7%的市佔率保持智慧插座市場最大佔有率,但受Matter認證的推動,Zigbee/Thread通訊協定正以26.8%的複合年成長率加速成長。隨著Thread 1.4增強的憑證共用支援企業級部署,支援Thread的智慧插座市場規模預計將呈指數級成長。塗鴉智慧的15天承包模組專案展示了標準化如何加快產品上市速度並降低工程難度。 Wi-Fi主導優勢實現了普及,並在頻寬密集型應用場景(例如高解析度電能計量)中表現出色,而Z-Wave在美國的傳統安防系統中仍然佔據重要地位。隨著消費者尋求跨平台購買,專有協定堆疊面臨被淘汰的風險。
Thread 的即時能源彙報為公用事業公司在需量反應方面提供了明顯的優勢。透過 Matter 1.3,智慧插座現在可以將即時能耗數據傳輸到更廣泛的家庭能源管理儀表板中。因此,公用事業公司的補貼開始傾向於支持 Thread 的硬體,這促使安裝商放棄僅支援 Wi-Fi 的產品。在 Thread 的低延遲網狀網路之上疊加能源分析功能的供應商可以收取更高的平均售價,從而緩解同質化產品類別中利潤率下降的困境。
到2024年,住宅建築仍將佔據智慧插座市場56.2%的佔有率,這主要得益於語音助理和DIY便利性的普及。然而,隨著設施管理人員追求量化收益,工業和商業建築預計將以27.7%的複合年成長率成長。實地研究表明,應用物聯網調度技術後,每個場所每年可節省36.8千瓦的插座負載。Honeywell面向企業建築管理系統的插座負載模組體現了向數據主導能源合規的轉變。
在工廠和倉庫中,工業級智慧插座具備住宅設備所不具備的熱過載保護和過電流分析功能。醫院和養老機構也開始部署智慧插座,用於監測醫療設備的運作,防止意外斷電,這得益於政府針對老齡化社會遠端監控的補貼計畫。商業性對具備服務等級協定(SLA)保障的硬體的需求推高了價格分佈,並擴大了專業OEM廠商可觸及的智慧插座市場。
智慧插座市場按技術(藍牙、Wi-Fi、其他)、應用(住宅、商業、其他)、銷售管道(線上、線下)、插頭外形(牆壁插座適配器、牆內插座、其他)和地區進行細分。市場預測以美元計價。
區域分析
北美地區將在2024年繼續維持32.1%的領先地位,這主要得益於能源之星安全、健康、環境和管理系統(SHEMS)法規以及寬頻的廣泛普及。該地區語音助理的成熟應用將增強生態系統的穩定性,降低客戶流失率,並促進全屋維修。加拿大能源效率法規的更新與美國標準接軌,為製造商提供了統一的北美認證藍圖。
亞太地區預計將以28.3%的複合年成長率成長,成為智慧插座市場成長最快的地區。自2022年以來,在地化的語音助理方言支援和具有競爭力的價格,使得印度Alexa設備的數量增加了兩倍。中國自主研發的晶片組降低了物料清單的差異性,並促進了白牌產品的普及。日本和韓國政府資助的智慧城市試點項目,正在將插座級能源監測整合到區域碳排放儀錶板中,推動了機構對Thread Mesh部署的需求。
在歐洲,情況則是喜憂參半。 WEEE指令2024/884規定了淘汰舊設備的成本,擠壓了製造商的毛利率。另一方面,英國2025年智慧家電法規要求設備具備電網感知能力,擴大了可受惠於加裝Matter智慧插頭的設備範圍。塗鴉智慧倫敦改裝論壇強調了低成本插頭在老舊住宅存量實現淨零排放目標方面所能發揮的作用。
南美洲、中東和非洲的5G裝機量雖然落後,但隨著5G網路部署改善延遲和覆蓋範圍,這些地區的成長率已達兩位數。高額進口關稅仍然是一大障礙,促使當地企業組裝合資企業,利用該地區的自由貿易區。開發商正與波灣合作理事會的連鎖飯店合作,試驗集中式能源控制面板,展示智慧插座如何作為更廣泛的物聯網基礎設施的閘道產品。
其他福利:
- Excel格式的市場預測(ME)表
- 3個月的分析師支持
目錄
第1章 引言
- 研究假設和市場定義
- 調查範圍
第2章調查方法
第3章執行摘要
第4章 市場情勢
- 市場概覽
- 市場促進因素
- 語音助理生態系統採用率激增
- Wi-Fi晶片組ASP下降
- 政府強制推行插電式負載控制能效
- 事項 1.3 促進互通性
- 老年人護理遠端監測補助計劃
- 對戶外防風雨插頭的需求不斷成長
- 市場限制
- 持久性設備網路安全漏洞
- 新興市場射頻頻譜碎片化
- 歐盟廢棄電子電氣設備回收成本對利潤率造成壓力。
- 不準確的能量測量讀數會引發回憶
- 供應鏈分析
- 監管環境
- 技術展望
- 波特五力分析
- 供應商的議價能力
- 買方的議價能力
- 新進入者的威脅
- 替代品的威脅
- 競爭對手之間的競爭
- 評估市場宏觀經濟趨勢
第5章 市場規模與成長預測
- 透過技術
- Wi-Fi
- Bluetooth
- Zigbee/Thread
- Z-Wave
- 其他
- 透過使用
- 住房
- 商業的
- 工業
- 其他(旅館業、醫療保健業)
- 按銷售管道
- 線上
- 離線
- 按插頭外形規格
- 牆插轉接器
- 壁掛式插座
- 電源分接頭
- 其他
- 按地區
- 北美洲
- 美國
- 加拿大
- 墨西哥
- 南美洲
- 巴西
- 阿根廷
- 其他南美洲
- 歐洲
- 德國
- 英國
- 法國
- 義大利
- 其他歐洲地區
- 亞太地區
- 中國
- 日本
- 韓國
- 印度
- 亞太其他地區
- 中東和非洲
- GCC
- 土耳其
- 南非
- 其他中東和非洲地區
- 北美洲
第6章 競爭情勢
- 市場集中度
- 策略趨勢
- 市佔率分析
- 公司簡介
- TP-Link Technologies
- Belkin(WeMo)
- Xiaomi
- D-Link
- Panasonic
- Amazon(First-Party)
- Broadlink
- Ankuoo
- EDIMAX
- Vesync(Etekcity, Levoit, Cosori)
- Lenovo
- Leviton
- Wipro
- Sariana(Satechi)
- Sonoff(ITEAD)
- Shelly
- Gosund/Nooie
- Eve Systems
- Aeotec
- Sengled
- Wyze Labs
第7章 市場機會與未來展望
The smart plug market stands at USD 4.21 billion in 2025 and is on course to reach USD 13.48 billion in 2030, charting a 26.22% CAGR.
This acceleration stems from mandatory energy-efficiency rules that make plug-load controls a building-code staple, the rapid decline of Wi-Fi chipset prices that brings sub-USD 10 retail tags into play, and the Matter 1.3 interoperability standard that dissolves long-standing ecosystem silos. Voice-assistant ecosystems now anchor purchasing decisions, while ultra-low-power Wi-Fi 6 MCUs shrink standby draw to micro-amp levels and enable multi-year battery use. Rising industrial interest, driven by audits showing up to 36.8 kW in annual plug-load waste per facility, positions smart plugs as a frontline efficiency retrofit. Regional momentum tilts toward Asia Pacific, where Alexa device connections have tripled in India and local chipset suppliers cut bill-of-materials costs for domestic brands.
Global Smart Plug Market Trends and Insights
Soaring Adoption of Voice-Assistant Ecosystems
Voice control has shifted from novelty to necessity as Amazon reports a 200% jump in connected smart-home devices in India within three years. The 2025 debut of the USD 19.99-per-month Alexa+ generative-AI service, bundled into Prime, redefines the value proposition from simple on/off switching to multi-device scene orchestration. Subscription economics incentivize deeper engagement, positioning smart plugs as foundational nodes that extend voice-assistant reach to legacy appliances. With more than 140,000 compatible devices in the Alexa catalogue, network effects reduce adoption friction and lift attach rates across income bands. Comparable strategies from Google and Apple reinforce the perception that voice-ready control is now the baseline expectation for every new plug-in device.
Falling ASPs of Wi-Fi Chipsets
Silicon Labs' SiWx917 MCU trims connected-sleep current to 22 micro amp, slicing component costs and enabling sub-USD 15 retail pricing without sacrificing energy reporting features. Synaptics and Chinese newcomer AIC Micro have entered the USD 3.2 billion ultra-low-power IoT SoC arena, intensifying price competition and widening vendor choice. Mass-market volumes allow ODMs to package dual Wi-Fi/BLE modules inside compact casings while retaining Matter-ready firmware. Emerging economies benefit most, as unit economics now align with middle-income household budgets, expanding the install base beyond early adopters.
Persistent Device Cybersecurity Breaches
Smart-device cyberattacks more than doubled in 2024, eroding consumer trust as high-profile flaws surfaced in major brands. TP-Link's exposure of local-communication vulnerabilities and the Mars Hydro incident that leaked 2.7 billion IoT records underscore systemic risk. The U.S. FCC's upcoming Cyber Trust Mark, backed by Amazon and Google, promises clearer labeling but final rules are not yet in force. Product recalls such as Emporia Energy's withdrawal of 80,000 smart plugs due to shock hazards illustrate the financial toll of insufficient security controls. Until certification regimes become mandatory, lingering doubts may slow first-time purchases, especially in professionally managed facilities with stricter IT policies.
Other drivers and restraints analyzed in the detailed report include:
- Government Energy-Efficiency Mandates for Plug-Load Control
- Matter 1.3 Interoperability Push
- Fragmented RF Spectrum in Emerging Markets
For complete list of drivers and restraints, kindly check the Table Of Contents.
Segment Analysis
Bluetooth retained the largest 31.7% slice of smart plug market share in 2024, but Zigbee/Thread protocols are accelerating at a 26.8% CAGR on the back of Matter certification momentum. The smart plug market size for Thread-enabled models is projected to swell sharply as enhanced credential-sharing in Thread 1.4 unlocks enterprise-grade deployments. Tuya's 15-day turnkey module program signals how standardization compresses time-to-market and lowers engineering hurdles. Wi-Fi enjoys cost-led ubiquity and excels in bandwidth-heavy use-cases such as high-resolution energy metering, while Z-Wave remains entrenched in legacy US security systems. Proprietary stacks risk obsolescence as consumers align around cross-platform purchase assurance.
Thread's real-time energy-reporting offers clear advantages in utility demand-response. Matter 1.3 now lets smart plugs feed instantaneous consumption data to broader home-energy-management dashboards. Consequently, utility rebates are beginning to single out Thread-capable hardware, incentivizing installers to pivot away from Wi-Fi-only SKUs. Vendors that overlay energy analytics atop Thread's low-latency mesh can charge premium ASPs, cushioning margin erosion in a commoditizing category.
Residential premises still represent 56.2% of the 2024 smart plug market size, buoyed by voice-assistant bundling and DIY convenience. Yet industrial and commercial buildings are set to expand at a 27.7% CAGR as facility managers chase quantified returns; field studies show 36.8 kW of annual plug-load savings per site when IoT scheduling is applied. Honeywell's plug-load module for enterprise building-management systems exemplifies the pivot to data-driven energy compliance.
In factories and warehouses, skinned industrial-grade smart plugs add thermal-overload protection and over-current analytics that residential units lack. Hospitals and elder-care facilities deploy smart plugs to verify medical-device uptime and prevent unplanned disconnection, aided by subsidy programs for remote monitoring in aging societies. The commercial appetite for SLA-backed hardware supports higher price points, widening the total addressable smart plug market for specialist OEMs.
Smart Plug Market is Segmented by Technology (Bluetooth, Wi-Fi, and More), Application (Residential, Commercial, and More), Sales Channel (Online and Offline), Plug Form Factor (Wall-Plug Adapter, In-Wall Outlet, and More), and by Geography. The Market Forecasts are Provided in Terms of Value (USD).
Geography Analysis
North America retained 32.1% leadership in 2024 on the strength of Energy Star SHEMS rules and broadband ubiquity, with utilities offering rebates for demand-response-certified plugs. The region's mature voice-assistant penetration fosters ecosystem lock-in that reduces churn and encourages whole-home retrofits. Canada's updated Energy Efficiency Regulations mirror U.S. standards, giving manufacturers a unified North American certification roadmap.
Asia Pacific is projected to clock a 28.3% CAGR, making it the fastest-expanding territory of the smart plug market. Localized voice-assistant dialect support and competitive pricing have tripled the Alexa device count in India since 2022. China's domestic chipset output curbs BOM volatility and allows white-label brands to proliferate. Government-funded smart-city pilots in Japan and South Korea integrate plug-level energy monitoring into district-wide carbon dashboards, seeding institutional demand for Thread-mesh deployments.
Europe presents a mixed picture. WEEE Directive 2024/884 places full end-of-life costs on manufacturers, pressuring gross margins. Conversely, the UK's 2025 smart-appliance rules require grid-aware functionality, widening the pool of devices that can benefit from retrofitting with Matter-ready smart plugs. Tuya's London retrofit forum underscored the role that low-cost plugs play in hitting net-zero targets for aging housing stock.
South America and the Middle East-Africa trail in installed base but register double-digit growth as 5G rollouts improve latency and coverage. High import duties remain a hurdle, prompting local assembly joint ventures that leverage regional free-trade zones. Developers tapped into hotel chains in the Gulf Cooperation Council to trial centralized energy dashboards, illustrating how smart plugs serve as a gateway product for broader IoT infrastructure.
- TP-Link Technologies
- Belkin (WeMo)
- Xiaomi
- D-Link
- Panasonic
- Amazon (First-Party)
- Broadlink
- Ankuoo
- EDIMAX
- Vesync (Etekcity, Levoit, Cosori)
- Lenovo
- Leviton
- Wipro
- Sariana (Satechi)
- Sonoff (ITEAD)
- Shelly
- Gosund / Nooie
- Eve Systems
- Aeotec
- Sengled
- Wyze Labs
Additional Benefits:
- The market estimate (ME) sheet in Excel format
- 3 months of analyst support
TABLE OF CONTENTS
1 INTRODUCTION
- 1.1 Study Assumptions and Market Definition
- 1.2 Scope of the Study
2 RESEARCH METHODOLOGY
3 EXECUTIVE SUMMARY
4 MARKET LANDSCAPE
- 4.1 Market Overview
- 4.2 Market Drivers
- 4.2.1 Soaring adoption of voice-assistant ecosystems
- 4.2.2 Falling ASPs of Wi-Fi chipsets
- 4.2.3 Government energy-efficiency mandates for plug-load control
- 4.2.4 Matter 1.3 interoperability push
- 4.2.5 Subsidy programs for senior-care tele-monitoring
- 4.2.6 Rising demand for outdoor weather-proof plugs
- 4.3 Market Restraints
- 4.3.1 Persistent device cybersecurity breaches
- 4.3.2 Fragmented RF spectrum in emerging markets
- 4.3.3 EU WEEE recycling costs hitting margins
- 4.3.4 Inaccurate energy-metering claims triggering recalls
- 4.4 Supply-Chain Analysis
- 4.5 Regulatory Landscape
- 4.6 Technological Outlook
- 4.7 Porter's Five Force Analysis
- 4.7.1 Bargaining Power of Suppliers
- 4.7.2 Bargaining Power of Buyers
- 4.7.3 Threat of New Entrants
- 4.7.4 Threat of Substitutes
- 4.7.5 Intensity of Competitive Rivalry
- 4.8 Assesment of Macroeconomic Trends on Market
5 MARKET SIZE AND GROWTH FORECASTS
- 5.1 By Technology
- 5.1.1 Wi-Fi
- 5.1.2 Bluetooth
- 5.1.3 Zigbee / Thread
- 5.1.4 Z-Wave
- 5.1.5 Others
- 5.2 By Application
- 5.2.1 Residential
- 5.2.2 Commercial
- 5.2.3 Industrial
- 5.2.4 Others (Hospitality, Healthcare)
- 5.3 By Sales Channel
- 5.3.1 Online
- 5.3.2 Offline
- 5.4 By Plug Form Factor
- 5.4.1 Wall-Plug Adapter
- 5.4.2 In-Wall Outlet
- 5.4.3 Power Strip
- 5.4.4 Others
- 5.5 By Geography
- 5.5.1 North America
- 5.5.1.1 United States
- 5.5.1.2 Canada
- 5.5.1.3 Mexico
- 5.5.2 South America
- 5.5.2.1 Brazil
- 5.5.2.2 Argentina
- 5.5.2.3 Rest of South America
- 5.5.3 Europe
- 5.5.3.1 Germany
- 5.5.3.2 United Kingdom
- 5.5.3.3 France
- 5.5.3.4 Italy
- 5.5.3.5 Rest of Europe
- 5.5.4 Asia-Pacific
- 5.5.4.1 China
- 5.5.4.2 Japan
- 5.5.4.3 South Korea
- 5.5.4.4 India
- 5.5.4.5 Rest of Asia-Pacific
- 5.5.5 Middle East and Africa
- 5.5.5.1 GCC
- 5.5.5.2 Turkey
- 5.5.5.3 South Africa
- 5.5.5.4 Rest of Middle East and Africa
- 5.5.1 North America
6 COMPETITIVE LANDSCAPE
- 6.1 Market Concentration
- 6.2 Strategic Moves
- 6.3 Market Share Analysis
- 6.4 Company Profiles (includes Global level Overview, Market level overview, Core Segments, Financials as available, Strategic Information, Market Rank/Share for key companies, Products and Services, and Recent Developments)
- 6.4.1 TP-Link Technologies
- 6.4.2 Belkin (WeMo)
- 6.4.3 Xiaomi
- 6.4.4 D-Link
- 6.4.5 Panasonic
- 6.4.6 Amazon (First-Party)
- 6.4.7 Broadlink
- 6.4.8 Ankuoo
- 6.4.9 EDIMAX
- 6.4.10 Vesync (Etekcity, Levoit, Cosori)
- 6.4.11 Lenovo
- 6.4.12 Leviton
- 6.4.13 Wipro
- 6.4.14 Sariana (Satechi)
- 6.4.15 Sonoff (ITEAD)
- 6.4.16 Shelly
- 6.4.17 Gosund / Nooie
- 6.4.18 Eve Systems
- 6.4.19 Aeotec
- 6.4.20 Sengled
- 6.4.21 Wyze Labs
7 MARKET OPPORTUNITIES AND FUTURE OUTLOOK
- 7.1 White-space and Unmet-Need Assessment


