


 |
市場調查報告書
商品編碼
1851159
折疊式智慧型手機:市場佔有率分析、產業趨勢、統計數據和成長預測(2025-2030 年)Foldable Smartphone - Market Share Analysis, Industry Trends & Statistics, Growth Forecasts (2025 - 2030) |
||||||
※ 本網頁內容可能與最新版本有所差異。詳細情況請與我們聯繫。
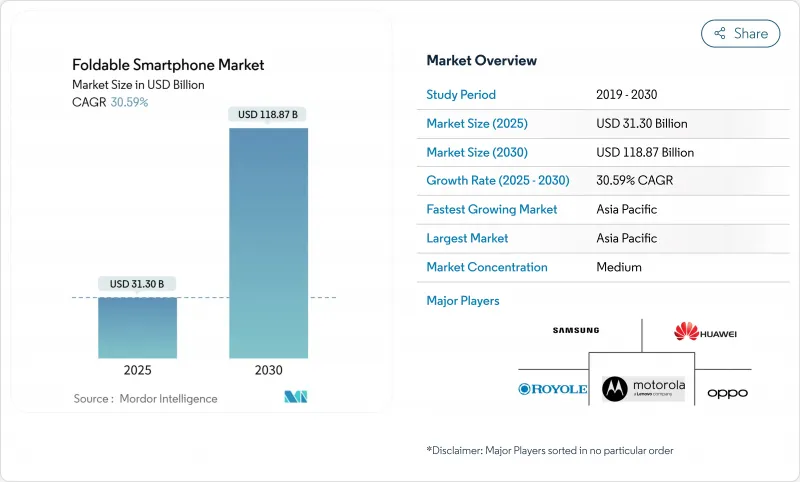
預計到 2025 年,折疊式智慧型手機市場規模將達到 313 億美元,到 2030 年將達到 1,188.7 億美元,預測期內(2025-2030 年)複合年成長率為 30.59%。
超薄玻璃 (UTG) 製造、鉸鏈工程和麵板產量比率的進步正在降低單位成本並提高耐用性。亞太地區是供需的主要驅動力,中國 OEM 廠商正在擴大多代生產線產能,而韓國顯示器製造商則在保護其製程技術。儘管傳統智慧型手機的成長速度已放緩至個位數,但營運商主導的設備補貼和高階 5G 套餐、企業對以生產力為中心的應用場景日益成長的興趣以及不斷擴大的內容串流夥伴關係,都在推動 5G 的普及。製造商們正在為注重時尚的消費者改進泡殼設計,為注重生產力的消費者推出書本式旗艦機型,並投資研發三折屏原型機,以確保下一波外形規格創新浪潮的到來。
全球折疊式智慧型手機市場趨勢與洞察
快速提高UTG產量比率
持續的製程改進提高了UTG(超薄玻璃)的產量比率,從而創造出更堅固的保護層。三星最新一代Galaxy Z系列採用可承受超過20萬次折疊的強化玻璃,而摩托羅拉2025款Razr系列則採用鈦金屬骨架,鉸鏈耐用性提升35%,並獲得IP48級防水防塵認證。可靠性里程碑的達成降低了消費者的猶豫,隨著廢品率的降低和產量的提高,產品價格區間的進一步擴大也為更廣泛的細分市場鋪平了道路。
通訊業者對高階5G套餐的補貼
通訊業者門市仍佔折疊式行動電話銷量的60%,因為分期付款計畫加上高ARPU值的5G套餐抵銷了最終用戶的價格溢價。典型的補貼計畫在24個月的合約期間將零售價降低30%至45%,從而提高用戶留存率並鼓勵用戶增加數據流量,因為折疊式行動電話用戶觀看影片的流量是行動電話用戶的1.8倍。這種策略在北美和歐洲尤其有效,因為這些地區無限費率方案的普及率已經很高,這為營運商提供了利潤空間和行銷優勢,使其能夠將折疊式手機定位為5G升級週期中的理想選擇。
折疊自行車鉸鏈在潮濕熱帶氣候下低於 20 萬公里
高相對濕度會加速鉸鏈銷和軟性黏合層的腐蝕,導致使用壽命低於實驗室額定的20萬次循環,並引發用戶在購買後18個月內申訴。原始設備製造商(OEM)正透過採用防腐蝕合金和奈米塗層等措施來應對這一問題,但這些升級會增加材料成本,並使散熱預算更加複雜。儘管智慧型手機更換率很高,但由於難以在耐用性和價格之間取得平衡,印尼、泰國和巴西等沿海地區的智慧型手機普及率低於平均水平。
細分市場分析
到2024年,圖書將佔全球出貨量的62%,在折疊式智慧型手機市場中佔有重要佔有率。平板電腦等級的7-8吋內建顯示器支援三螢幕多工處理和觸控筆友善繪圖介面,使其區別於一體式超薄裝置。三星Galaxy Z Fold系列和華為Mate X系列是推動這一市場主導地位的主要力量,這兩款產品都瞄準了金融、設計以及早期嚐鮮消費者等電力用戶群。翻蓋泡殼細分市場正以預計33.4%的複合年成長率快速成長,它們憑藉親民的建議零售價和人們對翻蓋手機人體工學設計的懷舊情懷,吸引著追求時尚的消費者。
一款計劃於2025年限量生產的三折疊原型機,其內部面板尺寸預計將擴展至10英寸,從而在不影響核心機型的情況下增加收入。向外折疊的設計仍受限於保護裸露軟性矩陣免受磨損的工程難題。儘管目前仍在進行試驗,但預計到2030年,折疊式智慧型手機市場(與書籍市場並列)的規模將超過650億美元,而泡殼的強勁銷量成長將縮小兩者之間的差距,並鞏固未來產品組合的雙支柱結構。
到2024年,7至8吋面板將佔全球出貨量的55%,這體現了筆記型電腦般的生產力和折疊式後單手攜帶的便利性之間的完美平衡。 OEM廠商的藍圖顯示,主動式顯示器仍將青睞此頻寬,因為它們每平方英吋的毛利率最高。隨著複雜的多齒輪鉸鏈的簡化和聚合物背板剛性的增強,8英寸以上的顯示器將以32.5%的複合年成長率成長,從而減少摺痕。
螢幕尺寸小於等於 6.9 吋的翻蓋手機在時尚和年輕群體中仍然頗具吸引力,因為便攜性和色彩搭配的配件比單純的螢幕空間更重要。然而,更大的螢幕更能吸引高 ARPU 內容合作夥伴。預計到 2030 年,螢幕尺寸大於 8 吋的手機將佔據折疊式智慧型手機市場 23% 的佔有率,但由於價格競爭加劇,其收入佔有率仍將落後於其他機型。
區域分析
亞太地區預計到2024年將佔全球出貨量的68%,其在顯示器製造、鉸鏈鍛造和UTG拋光等方面的垂直整合將確保其區域領先地位。中國既支撐著供應,也滿足了國內需求,本土OEM廠商利用省級補貼擴大其8.6代OLED工廠規模,實現了規模經濟。韓國憑藉強大的5G網路覆蓋範圍和三星本土品牌的股權,擁有全球最高的人均折疊式螢幕設備普及率。日本延續了緊湊型手機的傳統,傾向於更小巧的泡殼設備,而印度的普及率則因相對於平均可支配收入而言過高的價格而受到限制,但都市區的發展勢頭依然強勁。
北美在全球排名第二,主要得益於營運商積極的補貼政策,有效抵銷了前期成本。美國在通訊方面領先,這得益於無限流量套餐的普及以及對高階5G體驗的大力行銷。加拿大雖然絕對規模較小,但落後美國。拉丁美洲的5G普及主要集中在巴西和墨西哥,這兩個國家的富裕都市區消費者追求的是彰顯身分的設備。
歐洲市場呈現出多元化的格局:北歐和西方市場,例如德國、法國和英國,已經廣泛採用書本式折疊式以提高生產力,而南方市場仍然對成本較為敏感,轉型速度緩慢。在中東,波灣合作理事會國家展現出對高階產品的需求,將折疊式包定位為生活方式旗艦產品。非洲(南非的城市叢集除外)仍處於發展階段,雖然受到購買力平價的限制,但隨著售價低於1000美元的折疊螢幕手機日益普及,也看到了市場機會。亞太地區在2030年前將繼續擴大其折疊式螢幕智慧型手機的市場佔有率,但未來的成長將越來越依賴北美和西歐的企業採購以及新興市場中價格分佈的選擇。
其他福利:
- Excel格式的市場預測(ME)表
- 3個月的分析師支持
目錄
第1章 引言
- 調查先決條件
- 調查範圍
第2章調查方法
第3章執行摘要
第4章 市場情勢
- 市場概覽
- 市場促進因素
- 超薄玻璃產量比率率的快速提高
- 營運商針對高階 5G 套餐的補貼策略
- 物流領域對支援現場生產力提升應用程式的可折疊設備的企業需求
- 需要更寬寬比的內容串流夥伴關係長寬比
- 軟性AMOLED面板單價下降
- 市場限制
- 在潮濕的熱帶地區,鉸鏈的耐久性問題可能出現在低於 20 萬公里的里程中。
- 針對多視窗折疊式使用者介面的應用最佳化有限
- UTG和鉸鏈零件供應鏈瓶頸(2023年後台灣大地震)
- 價值/供應鏈分析
- 監理展望
- 技術展望
- 折疊式智慧型手機科技場景
- 折疊式顯示面板概述
- 折疊式智慧型手機轉換能力
- 蘭德投資與產業政策
- 折疊式智慧型手機相容性
- 軟體相容性
- 硬體相容性
- 波特五力分析
- 新進入者的威脅
- 買方/消費者的議價能力
- 供應商的議價能力
- 替代品的威脅
- 競爭對手之間的競爭
第5章 市場規模與成長預測
- 按外形規格
- 泡殼(垂直折疊)
- 書籍裝幀(橫向折疊)
- 外折疊
- 旋轉性/滑出式
- 按螢幕尺寸
- 6.9 英吋或更小
- 7-8英寸
- 8吋或以上
- 價格分佈範圍
- 不到1000美元
- 1,000-1,499 美元
- 1500-1999美元
- 超過2000美元
- 按銷售管道
- 承運商/營運商商店
- 消費性電子產品和專業零售
- 電子商務/直接面對消費者
- 最終用戶
- 消費者
- 公司/企業
- 政府/國防
- 按地區
- 北美洲
- 美國
- 加拿大
- 墨西哥
- 南美洲
- 巴西
- 其他南美洲
- 歐洲
- 德國
- 英國
- 法國
- 義大利
- 西班牙
- 北歐國家
- 其他歐洲地區
- 中東
- 沙烏地阿拉伯
- 阿拉伯聯合大公國
- 其他中東地區
- 非洲
- 南非
- 奈及利亞
- 其他非洲地區
- 亞太地區
- 中國
- 日本
- 韓國
- 印度
- 新加坡
- 澳洲
- 亞太其他地區
- 北美洲
第6章 競爭情勢
- 市場集中度
- 策略趨勢
- 市佔率分析
- 公司簡介
- Samsung Electronics Co. Ltd.
- Huawei Technologies Co. Ltd.
- Motorola Mobility LLC(Lenovo)
- Xiaomi Corp.
- Oppo Co. Ltd.
- vivo Communication Technology Co. Ltd.
- Royole Corp.
- Honor Device Co. Ltd.
- TCL Technology Group Corp.
- ZTE Corporation
- Google LLC
- Microsoft Corp.
- Sony Corp.
- LG Electronics Inc.
- Apple Inc.
- TECNO Mobile Ltd.
- OnePlus Technology(Shenzhen)Co. Ltd.
- Energizer Holdings Inc.
- Sharp Corp.
- BOE Technology Group Co. Ltd.
- Visionox Technology Inc.
- Kyocera Corp.
第7章 市場機會與未來展望
The Foldable Smartphone Market size is estimated at USD 31.30 billion in 2025, and is expected to reach USD 118.87 billion by 2030, at a CAGR of 30.59% during the forecast period (2025-2030).
Advances in ultra-thin glass (UTG) manufacturing, hinge engineering, and panel yields are bringing unit costs down while improving durability, a combination that is repositioning foldables from niche status to a mainstream upgrade path. Asia Pacific remains the engine of demand and supply, anchored by Chinese OEMs scaling multi-generation line capacity and South Korean display makers safeguarding process know-how. Carrier-led device subsidies tied to premium 5G plans, rising enterprise interest in productivity-focused use cases, and widening content-streaming partnerships are reinforcing adoption momentum even as conventional smartphone growth settles into single-digit territory. Manufacturers are honing clamshell designs for style-driven buyers and launching book-style flagships for productivity enthusiasts, and they are investing in tri-fold prototypes to secure the next wave of form-factor innovation.
Global Foldable Smartphone Market Trends and Insights
Rapid UTG yield-rate gains
Continuous process refinements have raised UTG yield rates and enabled tougher cover layers. Samsung's latest Galaxy Z generation incorporates reinforced glass that tolerates more than 200,000 folds, while Motorola's 2025 Razr family uses a titanium backbone that raises hinge endurance by 35% and carries IP48 water- and dust-resistance certification . Reliability milestones are reducing consumer hesitation and paving the way for broader price segmentation as scrap losses fall, and throughput improves.
Carrier subsidies for premium 5G bundles
Operator stores still control a 60% share of foldable sales because monthly instalments tied to high-ARPU 5G plans neutralize premium pricing for end users. Typical subsidy schemes shave 30 - 45% off retail prices over 24-month contracts, lifting retention rates and stimulating higher data consumption as foldable owners stream 1.8 times more video traffic than slab-phone users. The tactic is especially potent in North America and Europe, where penetration of unlimited-data tariffs is already high, giving carriers both the margin headroom and marketing muscle to position foldables as the aspirational choice for 5G upgrade cycles.
Sub-200 k fold-cycle hinges in humid tropics
High relative humidity accelerates corrosion on hinge pins and flexible adhesive layers, reducing effective life cycles below the laboratory-rated 200,000 folds and triggering client complaints within 18 months of purchase. OEMs are countering with rust-resistant alloys and additional nano-coatings, yet these upgrades raise bill-of-materials costs and complicate thermal budgets. Difficulty in balancing ruggedization with affordability explains the below-average penetration across Indonesia, Thailand, and coastal Brazil, despite high smartphone replacement frequency.
Other drivers and restraints analyzed in the detailed report include:
- Enterprise productivity demand in logistics
- Content-streaming alliances favouring wide AR
- Limited third-party multi-window app optimisation
For complete list of drivers and restraints, kindly check the Table Of Contents.
Segment Analysis
Book-style devices controlled 62% of global shipments in 2024, underpinning a substantial slice of the foldable smartphone market. Their tablet-class 7 - 8-inch internal displays unlock three-pane multitasking and stylus-friendly drawing surfaces that differentiate them from monolithic slabs. This dominance is underpinned by Samsung's Galaxy Z Fold line and Huawei's Mate X series, which both target power users in finance, design, and early-adopter consumer niches. The clamshell sub-segment is expanding at a forecast 33.4% CAGR as it leverages lower MSRP thresholds and nostalgia for flip-phone ergonomics to appeal to fashion-oriented buyers.
Tri-fold prototypes scheduled for limited production in 2025 could stretch internal panels to 10 inches, potentially capturing incremental revenue without cannibalising core models. Outward-fold variants remain constrained by the engineering challenge of protecting exposed flexible matrices from abrasion. Despite the experimentation, the foldable smartphone market size attached to book-style lines is set to stay above USD 65 billion by 2030, while clamshells will narrow the gap through brisk volume gains, reaffirming the dual-pillar architecture of future portfolios.
Panels between 7 and 8 inches accounted for 55% of global shipments in 2024, reflecting a sweet spot that marries laptop-lite productivity with one-hand portability in folded mode. OEM roadmaps indicate a continued preference for this band because it delivers the highest gross margin per square inch of active display. Displays beyond 8 inches will scale at a 32.5% CAGR as complex multi-gear hinges slim down and polymer backplanes stiffen, shrinking crease lines.
Smaller <= 6.9-inch clamshell screens remain attractive in the fashion and youth segments where pocketability and colour-matched accessories trump raw workspace. Nevertheless, larger canvases attract premium ARPU content partnerships. By 2030, the > 8-inch cohort is expected to reach 23% of the foldable smartphone market size, though still lagging in revenue share due to price compression.
The Foldable Smartphone Market Report is Segmented by Form Factor (Clamshell, Book-Style, and More), Screen Size ( Less Than Equal To 6. 9 Inch, 7-8 Inch, and More), Price Range (Less Than USD 1, 000, and More), Sales Channel (Carrier/Operator Stores, Consumer Electronics and Specialty Retail, and More), End User (Consumer, Enterprise/Corporate, and More), and Geography. The Market Forecasts are Provided in Terms of Value (USD).
Geography Analysis
Asia Pacific commanded 68% of 2024 shipments, securing regional leadership through its tight vertical integration of display fabrication, hinge forging, and UTG polishing. China anchors both supply and domestic demand, with local OEMs leveraging provincial subsidies to expand Gen 8.6 OLED fabs and achieve scale economies. South Korea boasts the world's highest per-capita foldable uptake thanks to a robust 5G footprint and Samsung's home-field brand equity. Japan leans toward petite clamshells in keeping with compact handset traditions, while India's adoption pace is gated by premium pricing relative to average disposable income, yet still plots a steep trajectory in metro areas.
North America ranks second globally, driven by aggressive carrier subsidies that neutralise upfront costs. The United States leads volume on the back of broad unlimited-data plan penetration, coupled with a heavy marketing push behind premium 5G experiences. Canada shadows the US curve, albeit at a lower absolute scale. Latin American adoption is concentrated in Brazil and Mexico, where affluent urban consumers seek status devices; however, sticky import tariffs and volatile foreign-exchange conditions temper mass-market momentum.
Europe presents a mosaic picture: Northern and Western markets such as Germany, France, and the UK exhibit productive-use adoption of book-style folds, while Southern markets remain cost-sensitive and slower to migrate. Gulf Cooperation Council states in the Middle East display luxury-driven demand, positioning foldables as lifestyle flagships. Africa remains nascent except for South Africa's urban clusters, constrained by purchasing-power parity yet signalling opportunity once sub-USD 1,000 models proliferate. Collectively, Asia Pacific will continue to raise its foldable smartphone market share through 2030, but incremental growth will increasingly hinge on North American and Western European enterprise purchases and emerging-market affordability plays.
- Samsung Electronics Co. Ltd.
- Huawei Technologies Co. Ltd.
- Motorola Mobility LLC (Lenovo)
- Xiaomi Corp.
- Oppo Co. Ltd.
- vivo Communication Technology Co. Ltd.
- Royole Corp.
- Honor Device Co. Ltd.
- TCL Technology Group Corp.
- ZTE Corporation
- Google LLC
- Microsoft Corp.
- Sony Corp.
- LG Electronics Inc.
- Apple Inc.
- TECNO Mobile Ltd.
- OnePlus Technology (Shenzhen) Co. Ltd.
- Energizer Holdings Inc.
- Sharp Corp.
- BOE Technology Group Co. Ltd.
- Visionox Technology Inc.
- Kyocera Corp.
Additional Benefits:
- The market estimate (ME) sheet in Excel format
- 3 months of analyst support
TABLE OF CONTENTS
1 INTRODUCTION
- 1.1 Study Assumptions
- 1.2 Scope of the Study
2 RESEARCH METHODOLOGY
3 EXECUTIVE SUMMARY
4 MARKET LANDSCAPE
- 4.1 Market Overview
- 4.2 Market Drivers
- 4.2.1 Rapid Advancements in Ultra-Thin Glass Yield Rates
- 4.2.2 Carrier Subsidization Strategies for Premium 5G Plans
- 4.2.3 Enterprise Demand for Foldables to Support Field-Productivity Apps in Logistics Sector
- 4.2.4 Content-Streaming Partnerships Requiring Wider Aspect Ratios
- 4.2.5 Declining Per-Unit Cost of Flexible AMOLED Panels
- 4.3 Market Restraints
- 4.3.1 Sub-200 k Cycle Hinge Durability Concerns in Humid Tropics
- 4.3.2 Limited App Optimization for Multi-window Foldable UI
- 4.3.3 Supply-Chain Bottlenecks for UTG and Hinge Components (Post-2023 Taiwan Quake)
- 4.4 Value/Supply-Chain Analysis
- 4.5 Regulatory Outlook
- 4.6 Technological Outlook
- 4.7 Folding Smartphone Technology Scenario
- 4.7.1 Folding Display Panel Overview
- 4.7.2 Foldable Smartphone Convertibility
- 4.7.3 RandD Investment and Industry Policies
- 4.7.4 Foldable Smartphone Compatibility
- 4.7.4.1 Software Compatibility
- 4.7.4.2 Hardware Compatibility
- 4.8 Porter's Five Forces Analysis
- 4.8.1 Threat of New Entrants
- 4.8.2 Bargaining Power of Buyers/Consumers
- 4.8.3 Bargaining Power of Suppliers
- 4.8.4 Threat of Substitute Products
- 4.8.5 Intensity of Competitive Rivalry
5 MARKET SIZE AND GROWTH FORECASTS (VALUE)
- 5.1 By Form Factor
- 5.1.1 Clamshell (Vertical Fold)
- 5.1.2 Book-Style (Horizontal Fold)
- 5.1.3 Outward Fold
- 5.1.4 Rollable/Slide-out
- 5.2 By Screen Size
- 5.2.1 Less than Equal 6.9 inch
- 5.2.2 7 - 8 inch
- 5.2.3 Greater than to 8 inch
- 5.3 By Price Range
- 5.3.1 Less than USD 1,000
- 5.3.2 USD 1,000 - 1,499
- 5.3.3 USD 1,500 - 1,999
- 5.3.4 Greater than equal USD 2,000
- 5.4 By Sales Channel
- 5.4.1 Carrier/Operator Stores
- 5.4.2 Consumer Electronics and Specialty Retail
- 5.4.3 E-commerce/Direct-to-Consumer
- 5.5 By End User
- 5.5.1 Consumer
- 5.5.2 Enterprise/Corporate
- 5.5.3 Government and Defense
- 5.6 By Geography
- 5.6.1 North America
- 5.6.1.1 United States
- 5.6.1.2 Canada
- 5.6.1.3 Mexico
- 5.6.2 South America
- 5.6.2.1 Brazil
- 5.6.2.2 Rest of South America
- 5.6.3 Europe
- 5.6.3.1 Germany
- 5.6.3.2 United Kingdom
- 5.6.3.3 France
- 5.6.3.4 Italy
- 5.6.3.5 Spain
- 5.6.3.6 Nordics
- 5.6.3.7 Rest of Europe
- 5.6.4 Middle East
- 5.6.4.1 Saudi Arabia
- 5.6.4.2 United Arab Emirates
- 5.6.4.3 Rest of Middle East
- 5.6.5 Africa
- 5.6.5.1 South Africa
- 5.6.5.2 Nigeria
- 5.6.5.3 Rest of Africa
- 5.6.6 Asia-Pacific
- 5.6.6.1 China
- 5.6.6.2 Japan
- 5.6.6.3 South Korea
- 5.6.6.4 India
- 5.6.6.5 Singapore
- 5.6.6.6 Australia
- 5.6.6.7 Rest of Asia-Pacific
- 5.6.1 North America
6 COMPETITIVE LANDSCAPE
- 6.1 Market Concentration
- 6.2 Strategic Moves
- 6.3 Market Share Analysis
- 6.4 Company Profiles (includes Global-level Overview, Market-level Overview, Core Segments, Financials as available, Strategic Info, Market Rank/Share for key companies, Products and Services, Recent Developments)
- 6.4.1 Samsung Electronics Co. Ltd.
- 6.4.2 Huawei Technologies Co. Ltd.
- 6.4.3 Motorola Mobility LLC (Lenovo)
- 6.4.4 Xiaomi Corp.
- 6.4.5 Oppo Co. Ltd.
- 6.4.6 vivo Communication Technology Co. Ltd.
- 6.4.7 Royole Corp.
- 6.4.8 Honor Device Co. Ltd.
- 6.4.9 TCL Technology Group Corp.
- 6.4.10 ZTE Corporation
- 6.4.11 Google LLC
- 6.4.12 Microsoft Corp.
- 6.4.13 Sony Corp.
- 6.4.14 LG Electronics Inc.
- 6.4.15 Apple Inc.
- 6.4.16 TECNO Mobile Ltd.
- 6.4.17 OnePlus Technology (Shenzhen) Co. Ltd.
- 6.4.18 Energizer Holdings Inc.
- 6.4.19 Sharp Corp.
- 6.4.20 BOE Technology Group Co. Ltd.
- 6.4.21 Visionox Technology Inc.
- 6.4.22 Kyocera Corp.
7 MARKET OPPORTUNITIES AND FUTURE OUTLOOK
- 7.1 White-space and Unmet-Need Assessment
 折疊式智慧型手機市場報告:趨勢、預測和競爭分析(至2035年)
 折疊式智慧型手機市場:依顯示類型、鉸鏈方向、螢幕大小及銷售管道分類-2026-2032年全球市場預測
 折疊式智慧型手機市場-全球產業規模、佔有率、趨勢、機會和預測:按功能、價格範圍、銷售管道、地區和競爭格局分類,2021-2031年
 折疊式智慧型手機的全球市場
 2025年全球折疊式智慧型手機市場報告可折疊智慧型手機市場 - 全球產業規模、佔有率、趨勢、機會和預測,細分,按顯示面板類型、按模式、按配銷通路、按地區、按競爭,2020-2030F
 折疊式智慧型手機市場:依功能類型、銷售管道和地區
 折疊式智慧型手機市場規模、佔有率、趨勢分析報告:按功能、分銷管道、地區、細分市場預測,2024-2030