


 |
市場調查報告書
商品編碼
1851155
內容分析:市場佔有率分析、產業趨勢、統計數據、成長預測(2025-2030)Content Analytics - Market Share Analysis, Industry Trends & Statistics, Growth Forecasts (2025 - 2030) |
||||||
※ 本網頁內容可能與最新版本有所差異。詳細情況請與我們聯繫。
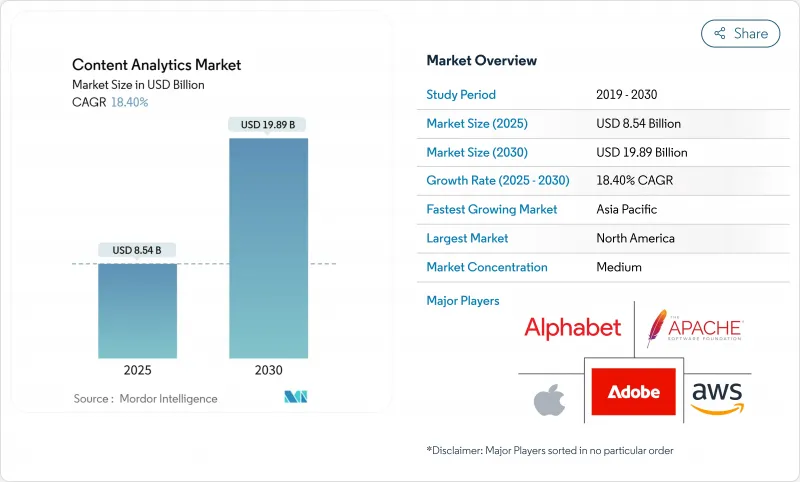
內容分析市場規模預計在 2025 年達到 85.4 億美元,預計到 2030 年將達到 198.9 億美元,預測期(2025-2030 年)複合年成長率為 18.40%。
雲端遷移加速、多模態人工智慧的快速普及以及向量搜尋和語義嵌入技術的融合正在重塑企業從非結構化資訊中提取價值的方式。公共雲端的採用、即時社交聆聽以及大規模語言模型驅動的「知識挖掘」管道正在降低准入門檻,並鼓勵企業進行實驗。同時,市場對能夠平衡資料主權和超大規模人工智慧平台規模經濟效益的混合架構的需求也在不斷成長。零售、媒體和銀行、金融服務及保險(BFSI)行業現有企業之間日益激烈的競爭,正促使供應商轉向垂直化解決方案,以期更快地實現價值並帶來可衡量的生產力提升。這些因素共同表明,在整個預測期內,內容分析市場將繼續超過更廣泛的企業軟體支出。
全球內容分析市場趨勢與洞察
非結構化企業資料的指數級成長
非結構化資訊已佔據企業記憶體的很大一部分,預計到2025年,175Zetta位元組的資料中,80%將產生於關係系統之外。例如,醫療機構正在將數百萬張圖像和圖表數位化,以獲取即時臨床訊息,同時降低實體儲存成本。這些資料量正推動企業採用湖屋架構,將向量函數嵌入到熟悉的SQL引擎中,使知識工作者能夠在同一查詢中跨文件、聊天記錄和醫學掃描等多種資料提出語義問題。
雲端基礎分析平台的採用率激增
公共雲端人工智慧服務使企業能夠按需租用變壓器級規模的模型,從而避免在專用硬體上投入資本支出。亞馬遜雲端服務 (AWS) 2025 年第一季的營收年增 17%,達到 335 億美元,主要得益於分析工作負載的成長。混合模式正變得越來越普遍,企業將工作負載分散到不同的服務供應商,以最佳化延遲、成本和合規性。 Google BigQuery 和微軟知識挖掘管道 (Microsoft Knowledge Mining Pipeline) 透過開放向量搜尋API 並抽象化基礎設施,為此轉變提供了支援。
數據素養人才短缺與變革管理差距
只有37%的技術領導者認可生成式人工智慧的價值,這主要是因為企業難以將原型轉化為可擴展的工作流程。聯準會的一項調查發現,各公司採用人工智慧的比例從5%到40%不等,凸顯了資料工程、模型管治和特定領域提示設計的技能差異。如果沒有有針對性的技能提升計劃,即使供應商提供了豐富的解決方案,企業在實現分析價值方面仍可能面臨停滯不前的風險。
細分市場分析
到2024年,隨著企業尋求無縫存取變壓器級模型,公共雲端服務將佔56.2%的營收佔有率。這一佔有率印證了雲端超大規模營運商持續提升的成本效益和彈性優勢。受託管特徵儲存、模型中心和企業提示庫的推動,公共雲端工作負載的內容分析市場規模預計將大幅成長。混合雲端和多重雲端用例的複合年成長率(CAGR)為21.3%。在受監管行業,對於需要確定性吞吐量和自主控制的工作負載而言,本地部署設備仍然至關重要。
透過將向量索引部署在邊緣,並將繁重的嵌入生成任務卸載到雲端GPU,越來越多的企業能夠在不犧牲洞察力的前提下實現策略合規性。供應商現在將可觀測性儀表板捆綁在一起,用於評估私有和公共端點的管道健康狀況,這一趨勢使內容分析市場更能抵禦單一提供者的故障。
社群媒體監測在2024年將維持33.6%的市場佔有率,這反映出品牌監聽套件和影響者追蹤模組的成熟應用。然而,客服中心自動化、即時轉錄和語音生物辨識技術將推動語音分析領域達到20.5%的複合年成長率,成為所有追蹤細分領域中成長最快的。隨著語音助理在銀行、旅遊和醫療保健自助服務終端的普及,以語音為中心的工具的內容分析市場規模正在擴大。高品質的自動語音辨識能夠創建多模態儀表板,透過語氣、情緒和意圖評分來觸發客服人員培訓和升級工作流程。
文字分析對於合約驗證和合規性標記至關重要,而以影片為中心的流程則有助於損失預防和串流內容最佳化。隨著社交影片剪輯、客服中心記錄和用戶提交的圖像現在都透過同一模型進行處理,融合趨勢正在加速。因此,產業格局正從孤立的產品轉向統一的體驗引擎,從而增強內容分析市場的長期成長前景。
內容分析市場按配置類型(本地部署、公共雲端、混合/多重雲端)、應用領域(文字分析、視訊分析及其他)、最終用戶產業(銀行、金融服務和保險、醫療保健、生命科學及其他)、組織規模(大型企業、中小企業)、內容類型(文字、圖像、音訊及其他)和地區進行細分。市場預測以美元計價。
區域分析
預計到2024年,北美地區的營收佔有率將達到38.1%,這得益於早期雲端運算的普及,它催生了成熟的資料科學人才庫和龐大的第三方市場生態系統。 AWS等領先供應商透過將高階向量搜尋原語與無伺服器資料庫捆綁在一起,實現了兩位數的成長,提高了區域性企業的進入門檻。儘管即將生效的歐洲ESG報告要求已經影響數千家美國跨國公司,它們必須相應地調整資訊揭露流程,但技術買家正受益於穩定的監管環境。亞太地區的消費結構涵蓋金融服務、醫療科技和直接面對消費者的零售等領域,確保了內容分析市場多元化的發展動能。
預計亞太地區將成為成長最快的地區,到2030年複合年成長率將達到21.7%。政府支持的基礎設施計劃,例如香港的3000千兆次浮點運算超級運算中心和印度13億美元的計算策略,將提供多模態和大規模語言模型工作負載所需的GPU密度。微信、LINE和抖音等社群媒體平台的普及確保了豐富的本地語言數據,從而加速模型微調週期。區域雲端服務供應商正在競相提供自主人工智慧區域,以滿足本地化規則。
儘管隱私保護機制尚不完善,歐洲在人工智慧領域仍穩步發展。 75%的專家認為監管是人工智慧發展的最大障礙,但該地區在聯邦學習等隱私保護分析方面處於領先地位。汽車、工業和能源產業正與學術實驗室合作,將運行在嵌入式硬體上的輕量級多模態模型商業化,從而增強製造業的競爭力。私人投資水準仍低於北美和中國,促使人們就人工智慧戰略自主性展開政策討論。
中東和非洲的公共部門數位化和金融科技領域正迎來新的發展動能。由於GPU在這些地區的供應有限,邊緣加速器因其能夠最大限度地減少資料外洩而備受關注。拉丁美洲也呈現同樣的趨勢,零售支付領域的顛覆者以及城市安全機構都在積極採用SaaS語音分析技術。儘管這些地區的市場規模相對較小,但它們正推動全球內容分析市場對供應商多元化收入來源和降低地理集中風險的需求不斷成長。
其他福利:
- Excel格式的市場預測(ME)表
- 3個月的分析師支持
目錄
第1章 引言
- 研究假設和市場定義
- 調查範圍
第2章調查方法
第3章執行摘要
第4章 市場情勢
- 市場概覽
- 市場促進因素
- 非結構化企業資料的指數級成長
- 雲端基礎分析平台的採用率激增
- 即時社群媒體監聽提升品牌聲譽
- 向量搜尋和語義嵌入能夠揭示更深層的見解
- GenAI 工作流程中的多模態(文字-圖像-影片)分析
- 受監管產業面臨的電子取證合規壓力
- 市場限制
- 數據素養不足與變革管理差距
- 加強資料隱私/主權監管
- 大規模人工智慧管道的高能耗和高碳足跡
- 內容格式片段化和缺乏標準化
- 產業價值鏈分析
- 監管環境
- 技術展望
- 產業吸引力:波特五力分析
- 新進入者的威脅
- 買方的議價能力
- 供應商的議價能力
- 替代品的威脅
- 競爭對手之間的競爭
- 宏觀經濟因素如何影響市場
第5章 市場規模與成長預測(價值)
- 依部署類型
- 本地部署
- 公有雲
- 混合/多重雲端
- 透過使用
- 文字分析
- 影片分析
- 社群媒體分析
- 語音分析
- 網路和文件分析
- 按最終用戶行業分類
- BFSI
- 醫療保健和生命科學
- 零售和消費品
- 資訊科技和電信
- 製造業
- 政府和公共機構
- 媒體與娛樂
- 其他終端用戶產業
- 按公司規模
- 主要企業
- 中小企業
- 按內容類型
- 文字
- 影像
- 聲音的
- 影片
- 多模態/複合材料
- 按地區
- 北美洲
- 美國
- 加拿大
- 墨西哥
- 南美洲
- 巴西
- 阿根廷
- 智利
- 其他南美洲
- 歐洲
- 德國
- 英國
- 法國
- 義大利
- 西班牙
- 俄羅斯
- 其他歐洲地區
- 亞太地區
- 中國
- 印度
- 日本
- 韓國
- 新加坡
- 馬來西亞
- 澳洲
- 亞太其他地區
- 中東和非洲
- 中東
- 阿拉伯聯合大公國
- 沙烏地阿拉伯
- 土耳其
- 其他中東地區
- 非洲
- 南非
- 奈及利亞
- 其他非洲地區
- 北美洲
第6章 競爭情勢
- 市場集中度
- 策略趨勢
- 市佔率分析
- 公司簡介
- Adobe Inc.
- Alphabet Inc.(Google Cloud)
- Amazon Web Services, Inc.
- Apache Software Foundation(OpenSearch)
- Apple Inc.(Apple Analytics)
- Bazaarvoice, Inc.
- Cision Ltd.(Brandwatch)
- Clarabridge, Inc.(a Qualtrics company)
- ContentSquare SAS
- Databricks, Inc.
- Hootsuite Inc.
- IBM Corporation
- Meltwater BV
- Microsoft Corporation
- NetBase Quid, Inc.
- NICE Ltd.
- OpenText Corporation
- Oracle Corporation
- Palantir Technologies Inc.
- SAS Institute Inc.
- Sprinklr, Inc.
- Talkwalker SA
- Teradata Corporation
- TIBCO Software Inc.
- Verint Systems Inc.
第7章 市場機會與未來趨勢
- 閒置頻段與未滿足需求評估
The Content Analytics Market size is estimated at USD 8.54 billion in 2025, and is expected to reach USD 19.89 billion by 2030, at a CAGR of 18.40% during the forecast period (2025-2030).
Accelerating cloud migration, rapid adoption of multimodal AI, and the convergence of vector search with semantic embedding technologies are reshaping how enterprises extract value from unstructured information. Public cloud deployments, real-time social listening, and large-language-model-powered "knowledge mining" pipelines are lowering entry barriers and encouraging experimentation. At the same time, demand is rising for hybrid architectures that balance data-sovereignty mandates with the scale advantages of hyperscale AI platforms. Intensifying competition among retail, media, and BFSI incumbents is pushing vendors toward verticalized solutions that promise faster time-to-value and measurable productivity gains. Together, these factors suggest that the content analytics market will keep outpacing broader enterprise-software spending through the forecast window.
Global Content Analytics Market Trends and Insights
Exponential Growth of Unstructured Enterprise Data
Unstructured information already represents the majority of corporate memory, with 80% of the 175 zettabytes expected in 2025 originating outside relational systems. Health-care providers, for example, digitized millions of images and charts to unlock real-time clinical insight while eliminating physical storage costs. These volumes are pushing enterprises toward lakehouse architectures that embed vector functions inside familiar SQL engines, allowing knowledge workers to ask semantic questions against documents, chat logs, and medical scans in the same query.
Surging Adoption of Cloud-Based Analytics Platforms
Public-cloud AI services let enterprises rent transformer-scale models on demand, avoiding capital expenditure on specialized hardware. Amazon Web Services recorded USD 33.5 billion in Q1 2025 sales, up 17% year on year, driven largely by analytics workloads. Hybrid patterns are now mainstream as firms split workloads across providers to optimize for latency, cost, and jurisdictional compliance. Google BigQuery and Microsoft Knowledge Mining pipelines are anchoring this shift by abstracting infrastructure while exposing vector search APIs.
Shortage of Data-Literate Workforce and Change Management Gaps
Only 37% of technology leaders judge generative AI as valuable today, largely because firms struggle to translate prototypes into scaled workflows. Federal Reserve research shows AI uptake ranging from 5% to 40% across companies, highlighting the skills dispersion in data engineering, model governance, and domain-specific prompt design. Without targeted reskilling programs, analytics value realisation risks stalling despite abundant vendor offerings.
Other drivers and restraints analyzed in the detailed report include:
- Real-Time Social Media Listening for Brand Reputation
- Vector Search and Semantic Embedding Unlock Deeper Insights
- Escalating Data-Privacy and Sovereignty Regulations
For complete list of drivers and restraints, kindly check the Table Of Contents.
Segment Analysis
Public-cloud services captured 56.2% revenue in 2024 as enterprises sought frictionless access to transformer-class models. This share underscores the cost-efficiency and elasticity advantages that cloud hyperscalers continue to refine. The content analytics market size for public-cloud workloads is projected to climb steeply on the back of managed feature stores, model hubs, and enterprise prompts libraries. Hybrid and multi-cloud deployments are on a 21.3% CAGR trajectory because firms must reconcile latency-sensitive use cases with data-residency statutes. In regulated sectors, on-premise appliances remain indispensable for workloads requiring deterministic throughput or sovereign control.
Enterprises increasingly position vector indexes at the edge while offloading heavy embedding generation to cloud GPUs, achieving policy compliance without sacrificing insight depth. Vendors now bundle observability dashboards that score pipeline health across private and public endpoints, a trend that strengthens the content analytics market's resilience to single-provider outages.
Social media monitoring retained a 33.6% share in 2024, reflecting mature adoption of brand-listening suites and influencer tracking modules. Yet contact-center automation, real-time transcription, and voice biometrics are pushing speech and audio analytics toward a 20.5% CAGR, the fastest among tracked segments. The content analytics market size for speech-centric tools is scaling as voice assistants proliferate across banking, travel, and healthcare kiosks. High-quality automatic speech recognition feeds multi-modal dashboards where tone, sentiment, and intent scores guide agent coaching or trigger escalation workflows.
Text analytics remains essential for contractual review and compliance flagging, while video-centric pipelines serve loss-prevention and streaming-content optimisation. Convergence is gaining speed as social-video clips, call-center transcriptions, and user-posted images are routed into the same model garden. The industry narrative, therefore, shifts away from siloed products toward cohesive experience engines, reinforcing long-term growth prospects for the content analytics market.
Content Analytics Market is Segmented by Deployment Type (On-Premise, Public Cloud, and Hybrid/Multi-Cloud), Application (Text Analytics, Video Analytics, and More), End-User Industry (BFSI, Healthcare and Life Sciences, and More), Organisation Size (Large Enterprises and Small and Medium-Sized Enterprises), Content Type (Text, Image, Audio, and More), and Geography. The Market Forecasts are Provided in Terms of Value (USD).
Geography Analysis
North America held 38.1% revenue share in 2024 because early cloud adoption produced mature data-science talent pools and extensive third-party marketplace ecosystems. Major providers like AWS drove double-digit percentage growth by bundling advanced vector search primitives into serverless databases, raising the entry barrier for regional challengers. Technology buyers benefit from a stable regulatory backdrop, although impending European ESG-reporting mandates already affect thousands of US multinationals that must align disclosure pipelines accordingly. The region's spend mix spans financial services, health-tech, and direct-to-consumer retail, ensuring diversified momentum for the content analytics market.
Asia-Pacific is the fastest-growing territory, expected to clock a 21.7% CAGR through 2030. Government-backed infrastructure projects, including Hong Kong's 3,000-petaflops supercomputing centre and India's USD 1.3 billion compute strategy, provision the GPU density required for multimodal and large-language model workloads. Social-media penetration across WeChat, LINE, and Douyin ensures abundant vernacular data that accelerates fine-tuning cycles. Regional cloud providers are racing to deliver sovereign AI zones to meet localisation rules, a move likely to preserve high services revenue inside domestic value chains.
Europe advances steadily despite fragmented privacy regimes. Seventy-five percent of professionals cite regulation as their biggest AI hurdle, yet the region leads in privacy-preserving analytics such as federated learning. Automotive, industrial, and energy sectors align with academic labs to commercialise lightweight multimodal models that run on embedded hardware, reinforcing manufacturing competitiveness. Private investment still trails North American and Chinese levels, motivating policy debate on strategic AI autonomy.
Middle East and Africa show emerging momentum in public-sector digitalisation and fintech. Limited local GPU availability has spurred interest in edge accelerators that minimise data egress. Latin America mirrors this trend, with retail payment disruptors and urban-safety agencies embracing SaaS voice analytics. Although smaller in absolute terms, these regions contribute incremental demand that diversifies vendor revenue streams and mitigates geographic concentration risk in the global content analytics market.
- Adobe Inc.
- Alphabet Inc. (Google Cloud)
- Amazon Web Services, Inc.
- Apache Software Foundation (OpenSearch)
- Apple Inc. (Apple Analytics)
- Bazaarvoice, Inc.
- Cision Ltd. (Brandwatch)
- Clarabridge, Inc. (a Qualtrics company)
- ContentSquare S.A.S.
- Databricks, Inc.
- Hootsuite Inc.
- IBM Corporation
- Meltwater B.V.
- Microsoft Corporation
- NetBase Quid, Inc.
- NICE Ltd.
- OpenText Corporation
- Oracle Corporation
- Palantir Technologies Inc.
- SAS Institute Inc.
- Sprinklr, Inc.
- Talkwalker S.A.
- Teradata Corporation
- TIBCO Software Inc.
- Verint Systems Inc.
Additional Benefits:
- The market estimate (ME) sheet in Excel format
- 3 months of analyst support
TABLE OF CONTENTS
1 INTRODUCTION
- 1.1 Study Assumptions and Market Definition
- 1.2 Scope of the Study
2 RESEARCH METHODOLOGY
3 EXECUTIVE SUMMARY
4 MARKET LANDSCAPE
- 4.1 Market Overview
- 4.2 Market Drivers
- 4.2.1 Exponential growth of unstructured enterprise data
- 4.2.2 Surging adoption of cloud-based analytics platforms
- 4.2.3 Real-time social media listening for brand reputation
- 4.2.4 Vector search and semantic embedding unlock deeper insights
- 4.2.5 Multimodal (text-image-video) analytics in GenAI workflows
- 4.2.6 e-Discovery compliance pressures in regulated industries
- 4.3 Market Restraints
- 4.3.1 Shortage of data-literate workforce and change management gaps
- 4.3.2 Escalating data-privacy/sovereignty regulations
- 4.3.3 High energy and carbon footprint of large-scale AI pipelines
- 4.3.4 Fragmentation of content formats and lack of standardisation
- 4.4 Industry Value Chain Analysis
- 4.5 Regulatory Landscape
- 4.6 Technological Outlook
- 4.7 Industry Attractiveness - Porter's Five Forces Analysis
- 4.7.1 Threat of New Entrants
- 4.7.2 Bargaining Power of Buyers
- 4.7.3 Bargaining Power of Suppliers
- 4.7.4 Threat of Substitutes
- 4.7.5 Intensity of Competitive Rivalry
- 4.8 Impact of Macroeconomic Factors on the Market
5 MARKET SIZE AND GROWTH FORECASTS (VALUES)
- 5.1 By Deployment Type
- 5.1.1 On-Premise
- 5.1.2 Public Cloud
- 5.1.3 Hybrid/Multi-Cloud
- 5.2 By Application
- 5.2.1 Text Analytics
- 5.2.2 Video Analytics
- 5.2.3 Social Media Analytics
- 5.2.4 Speech/Audio Analytics
- 5.2.5 Web and Document Analytics
- 5.3 By End-user Industry
- 5.3.1 BFSI
- 5.3.2 Healthcare and Life Sciences
- 5.3.3 Retail and Consumer Goods
- 5.3.4 IT and Telecom
- 5.3.5 Manufacturing
- 5.3.6 Government and Public Sector
- 5.3.7 Media and Entertainment
- 5.3.8 Other End-user Industries
- 5.4 By Organisation Size
- 5.4.1 Large Enterprises
- 5.4.2 Small and Medium-sized Enterprises (SMEs)
- 5.5 By Content Type
- 5.5.1 Text
- 5.5.2 Image
- 5.5.3 Audio
- 5.5.4 Video
- 5.5.5 Multimodal/Composite
- 5.6 By Geography
- 5.6.1 North America
- 5.6.1.1 United States
- 5.6.1.2 Canada
- 5.6.1.3 Mexico
- 5.6.2 South America
- 5.6.2.1 Brazil
- 5.6.2.2 Argentina
- 5.6.2.3 Chile
- 5.6.2.4 Rest of South America
- 5.6.3 Europe
- 5.6.3.1 Germany
- 5.6.3.2 United Kingdom
- 5.6.3.3 France
- 5.6.3.4 Italy
- 5.6.3.5 Spain
- 5.6.3.6 Russia
- 5.6.3.7 Rest of Europe
- 5.6.4 Asia-Pacific
- 5.6.4.1 China
- 5.6.4.2 India
- 5.6.4.3 Japan
- 5.6.4.4 South Korea
- 5.6.4.5 Singapore
- 5.6.4.6 Malaysia
- 5.6.4.7 Australia
- 5.6.4.8 Rest of Asia-Pacific
- 5.6.5 Middle East and Africa
- 5.6.5.1 Middle East
- 5.6.5.1.1 United Arab Emirates
- 5.6.5.1.2 Saudi Arabia
- 5.6.5.1.3 Turkey
- 5.6.5.1.4 Rest of Middle East
- 5.6.5.2 Africa
- 5.6.5.2.1 South Africa
- 5.6.5.2.2 Nigeria
- 5.6.5.2.3 Rest of Africa
- 5.6.1 North America
6 COMPETITIVE LANDSCAPE
- 6.1 Market Concentration
- 6.2 Strategic Moves
- 6.3 Market Share Analysis
- 6.4 Company Profiles (includes Global level Overview, Market level overview, Core Segments, Financials as available, Strategic Information, Market Rank/Share for key companies, Products and Services, and Recent Developments)
- 6.4.1 Adobe Inc.
- 6.4.2 Alphabet Inc. (Google Cloud)
- 6.4.3 Amazon Web Services, Inc.
- 6.4.4 Apache Software Foundation (OpenSearch)
- 6.4.5 Apple Inc. (Apple Analytics)
- 6.4.6 Bazaarvoice, Inc.
- 6.4.7 Cision Ltd. (Brandwatch)
- 6.4.8 Clarabridge, Inc. (a Qualtrics company)
- 6.4.9 ContentSquare S.A.S.
- 6.4.10 Databricks, Inc.
- 6.4.11 Hootsuite Inc.
- 6.4.12 IBM Corporation
- 6.4.13 Meltwater B.V.
- 6.4.14 Microsoft Corporation
- 6.4.15 NetBase Quid, Inc.
- 6.4.16 NICE Ltd.
- 6.4.17 OpenText Corporation
- 6.4.18 Oracle Corporation
- 6.4.19 Palantir Technologies Inc.
- 6.4.20 SAS Institute Inc.
- 6.4.21 Sprinklr, Inc.
- 6.4.22 Talkwalker S.A.
- 6.4.23 Teradata Corporation
- 6.4.24 TIBCO Software Inc.
- 6.4.25 Verint Systems Inc.
7 MARKET OPPORTUNITIES AND FUTURE TRENDS
- 7.1 White-Space and Unmet-Need Assessment
 搜尋和內容分析市場:按元件、解決方案類型、應用程式、最終用戶產業、部署模式和組織規模分類 - 2026-2032 年全球預測
 2026年全球內容分析、發現與認知軟體市場報告2026年全球內容分析市場報告
 全球內容分析市場規模、佔有率、趨勢和成長分析報告(2026-2034)
 內容分析市場預測至 2032 年:按組件、分析類型、部署模式、組織規模、最終用戶和地區分類的全球分析
 內容分析市場機會、成長動力、產業趨勢分析與預測 2024 - 2032
 內容分析市場規模、佔有率、趨勢分析報告:2025-2030 年按部署、應用程式、產業、地區和細分市場進行的預測
 全球內容分析、發現與認知軟體市場 2024-2031