


 |
市場調查報告書
商品編碼
1851098
容器即服務:市場佔有率分析、產業趨勢、統計數據和成長預測(2025-2030 年)Container As A Service - Market Share Analysis, Industry Trends & Statistics, Growth Forecasts (2025 - 2030) |
||||||
※ 本網頁內容可能與最新版本有所差異。詳細情況請與我們聯繫。
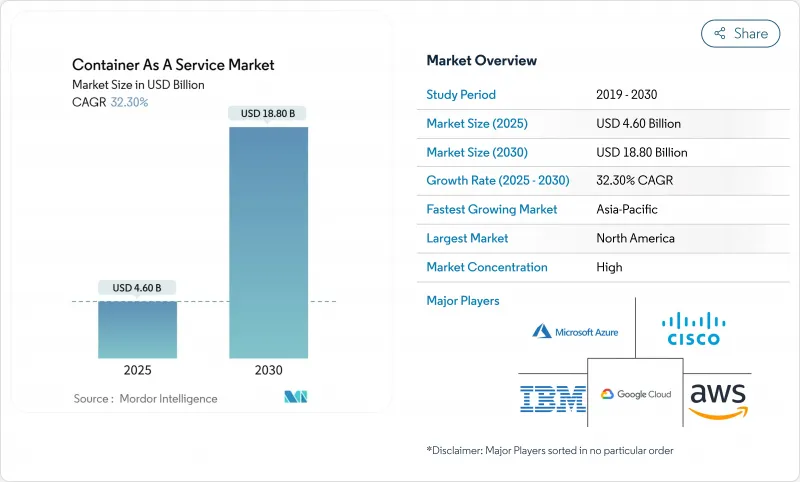
預計到 2025 年,貨櫃即服務市場規模將達到 46 億美元,到 2030 年將達到 188 億美元,年複合成長率為 32.3%。
雲端原生敏捷性、多重雲端策略的興起以及對精細化資源分配的強勁需求正在重塑企業基礎設施決策。在亞太和歐洲,主權雲端指令以及軟體材料清單(SBOM) 指令正在推動企業採用雲端服務,超越傳統的「直接遷移」模式。儘管雲端部署仍佔營收的 78%,但隨著受監管產業採用混合模式,本地部署正以 34% 的複合年成長率加速成長。託管服務佔收入的 54%,負責處理先前由企業內部完成的安全掃描和合規自動化任務。中小企業 (SME) 目前是成長最快的客戶群體,這反映了按需付費收費和低進入門檻的吸引力。製造業是關鍵成長產業,它利用輕量級編配來運作支援工業 4.0舉措的 AI 賦能邊緣工作負載。
全球容器即服務市場趨勢與洞察
與雲端平台無關的 Kubernetes 平台避免了廠商鎖定
為了避免廠商鎖定並爭取更優惠的價格,雲端編配正被日益廣泛地採用。跨廠商運行相同叢集的平台簡化了工作負載的可移植性,並在測試有狀態微服務時將遷移停機時間減少 77%。像 HPE 這樣的廠商正在將虛擬機器和容器整合到單一控制平面中,以強化混合雲策略。
計量收費的透明度提高了中小企業的採用率。
面向消費者的定價策略消除了中小企業的資本投資障礙。 AWS Fargate 和 EKS 的成本視覺化工具可協助中小企業無需專門的 DevOps 團隊即可部署生產叢集。自動化的實例大小調整和競價型實例利用率進一步使成本與流量波動保持一致,從而支持了中小企業 36.7% 的複合年成長率。
認證K8S維運人員短缺
人才短缺會減緩技術應用,並增加營運風險。新興市場的企業往往依賴成本高昂的諮詢顧問,導致計劃週期延長。訓練體系無法滿足服務網格、GitOps 和邊緣叢集技能的需求。
細分市場分析
儘管雲端運算仍保持其主導地位,但預計本地叢集將以 34% 的複合年成長率成長,這反映了合規性需求、本地處理的延遲優勢以及企業希望升級現有硬體而非重新部署所有工作負載的願望。 HPE GreenLake 提供基於使用量的私有雲端定價模式,與公共雲端的經濟模式類似,這表明供應商正在適應混合雲的需求。
企業通常在雲端運行開發和突發工作負載,同時將對延遲敏感或受監管的應用程式保留在本地。容器即服務 (CaaS) 市場透過統一的控制平面支援無縫的工作負載遷移,使團隊能夠根據效能和自主需求遷移容器。隨著混合部署成熟度的提高,部署決策將更多地取決於成本和合規性等可衡量的變量,而不是預設的雲端優先策略。
託管服務佔了 54% 的市場佔有率,年複合成長率達 34.5%。服務提供者正在整合人工智慧主導的資源調優和自動化補丁程序,以確保執行時間,同時減少對內部人員的需求。 T-Mobile 為其通訊業者雲端功能採用了託管的 Red Hat OpenShift 技術堆疊,檢驗了該方法在關鍵任務型 5G 工作負載方面的有效性。
專業服務對於遷移和複雜整合仍然至關重要,但其帶來的收入只是暫時的。隨著時間的推移,週期性的託管服務將超越計劃工作。容器即服務 (Container-as-a-Service) 市場也反映了這一轉變,新功能(例如 BBOM 自動化、供應鏈安全、FinOps 控制面板)被打包到訂閱方案中,從而帶來可衡量的成果。
容器即服務 (Containers as A Service) 市場報告按配置類型(本地部署、雲端部署)、服務類型(專業服務、託管服務)、公司規模(中小企業、大型企業)、最終用戶應用(銀行、金融服務和保險 (BFSI)、零售、IT 和通訊、製造業、其他最終用戶應用)以及地區對產業進行細分。市場預測以美元計價。
區域分析
北美地區受益於成熟的超大規模生態系統和積極的企業現代化進程,預計到2024年將佔據38.5%的雲端收入佔有率。領先的雲端服務供應商預計在2025年實現兩位數的雲端收入成長,進一步鞏固該地區的領先地位。然而,Kubernetes維運技能的短缺正在阻礙成長,並推動了對託管服務的需求。
亞太地區預計將以39.4%的複合年成長率實現最快成長,這主要得益於主權雲端規則和國家資助的人工智慧基礎設施。印度已撥款13億美元用於運算能力建設,其中包括為公共和私有人工智慧叢集購置1萬個GPU。以阿里雲、騰訊雲和華為雲主導的中國生態系統正加速混合雲的普及,華為雲平台在亞太新興市場的營收成長高達106%。
歐盟資料法規將於2025年9月生效,屆時將強制要求雲端資料可攜性,並於2027年取消雲端切換費用。擁有完全雲端無關架構的供應商可能更具優勢,而主權條款則可能促進區域性雲端即服務(CaaS)平台的發展。德國、法國和英國在採用這項法規方面處於領先地位,但監管的複雜性可能會減緩採購週期,直到認證機制最終確定。
其他福利:
- Excel格式的市場預測(ME)表
- 3個月的分析師支持
目錄
第1章 引言
- 研究假設和市場定義
- 調查範圍
第2章調查方法
第3章執行摘要
第4章 市場情勢
- 市場概覽
- 市場促進因素
- 與雲端平台無關的 Kubernetes 平台避免了廠商鎖定
- 按使用付費的透明度提高了小型企業的採用率。
- DevSecOps SBOM 指令加速了託管 CaaS 的發展。
- 支援人工智慧/機器學習的GPU集群正在迅速普及
- 5G邊緣微型資料中心部署需要輕量級CaaS。
- 主權雲端指令推動國內雲端即服務(CaaS)發展。
- 市場限制
- Kubernetes認證操作員短缺
- 核心級逃逸和 eBPF 攻擊向量
- 難以預測的雲端帳單
- 可觀測性許可成本細分
- 監管環境
- 技術展望
- 波特五力分析
- 供應商的議價能力
- 買方的議價能力
- 新進入者的威脅
- 替代品的威脅
- 競爭的激烈程度
- 投資分析
第5章 市場規模與成長預測
- 透過部署
- 雲
- 本地部署
- 按服務類型
- 託管服務
- 專業服務
- 按公司規模
- 小型企業
- 主要企業
- 透過最終用戶使用
- BFSI
- 零售
- 資訊科技/通訊
- 製造業
- 衛生保健
- 政府機構
- 其他(媒體、遊戲、教育科技)
- 按地區
- 北美洲
- 美國
- 加拿大
- 墨西哥
- 南美洲
- 巴西
- 阿根廷
- 其他南美洲
- 歐洲
- 德國
- 英國
- 法國
- 西班牙
- 義大利
- 其他歐洲地區
- 亞太地區
- 中國
- 日本
- 印度
- 澳洲
- 韓國
- 亞太其他地區
- 中東
- 以色列
- 沙烏地阿拉伯
- 阿拉伯聯合大公國
- 土耳其
- 其他中東地區
- 非洲
- 南非
- 埃及
- 奈及利亞
- 其他非洲地區
- 北美洲
第6章 競爭情勢
- 市場集中度
- 策略趨勢
- 市佔率分析
- 公司簡介
- Amazon Web Services
- Microsoft Azure
- Google Cloud(GKE)
- IBM Corp(Red Hat OpenShift)
- Alibaba Cloud
- VMware Tanzu
- Cisco Systems
- SUSE Rancher
- Oracle Container Engine
- Hewlett Packard Enterprise(Ezmeral)
- Mirantis
- D2iQ
- Platform9 Systems
- Akamai(Linode)
- DigitalOcean
- Rackspace Technology
- Nutanix
- Canonical
- HashiCorp
- Huawei Cloud
- Tencent Cloud
- OVHCloud
第7章 市場機會與未來展望
The Container-as-a-Service market size stands at USD 4.6 billion in 2025 and is forecast to reach USD 18.8 billion by 2030, expanding at a 32.3% CAGR.
Strong demand for cloud-native agility, rising multi-cloud strategies and granular resource allocation are reshaping enterprise infrastructure decisions. Sovereign-cloud directives in Asia-Pacific and Europe, together with mandatory software bill of materials (SBOM) rules, are widening adoption beyond classic lift-and-shift migrations. Cloud deployment still represents 78% of revenue, but on-premise deployment is accelerating at a 34% CAGR as regulated industries embrace hybrid models. Managed services, which hold 54% share, are taking on security scanning and compliance automation tasks once handled internally. Small and medium enterprises now form the fastest-growing customer group, reflecting the appeal of pay-per-use billing and low entry costs. Manufacturing is the leading growth vertical, leveraging lightweight orchestration to operate AI-enabled edge workloads that support Industry 4.0 initiatives.
Global Container As A Service Market Trends and Insights
Cloud-agnostic Kubernetes Platforms Avert Lock-in
Enterprises increasingly deploy cloud-agnostic orchestration to avoid vendor dependency and negotiate favorable pricing. Platforms that run identical clusters across providers simplify workload portability and reduce migration downtime by 77% in stateful microservices tests. Vendors such as HPE integrate virtual machines and containers within one control plane, strengthening hybrid strategies.
Pay-per-use Transparency Grows SME Adoption
Consumption pricing eliminates capital expenditure barriers for smaller firms. AWS Fargate and EKS cost-visibility tools help SMEs deploy production clusters without dedicated DevOps teams. Automated rightsizing and spot-instance use further align expenses with fluctuating traffic, supporting the 36.7% CAGR recorded for SMEs.
Shortage of Certified K8s Operators
The talent gap delays deployments and raises operating risk. Enterprises in emerging markets often rely on costly consultants, lengthening project timelines. Training pipelines have yet to match demand for service-mesh, GitOps and edge cluster skills.
Other drivers and restraints analyzed in the detailed report include:
- DevSecOps SBOM Mandates Accelerate Managed CaaS
- AI/ML GPU-ready Clusters Surge
- Kernel-level Escape and eBPF Attack Vectors
For complete list of drivers and restraints, kindly check the Table Of Contents.
Segment Analysis
On-premise clusters are forecast to grow at a 34% CAGR even though cloud maintains dominant share. This reflects compliance needs, local-processing latency advantages and a desire to modernize existing hardware rather than relocate every workload. HPE GreenLake offers consumption-based private-cloud pricing that mirrors public-cloud economics, demonstrating how suppliers adapt to hybrid demand.
Organizations usually run development and bursting workloads in the cloud while retaining latency-sensitive or regulated applications on-site. The Container-as-a-Service market supports seamless workload migration through unified control planes, allowing teams to shift containers in response to performance or sovereignty requirements. As hybrid maturity rises, placement decisions hinge on measurable cost and compliance variables rather than a default cloud-first stance.
Managed offerings hold 54% share and are expanding at 34.5% CAGR as enterprises offload day-two operations. Providers integrate AI-driven resource tuning and automated patching, ensuring uptime while lowering internal headcount needs. T-Mobile adopted a managed Red Hat OpenShift stack for telco cloud functions, validating the approach for mission-critical 5G workloads.
Professional services remain essential for migrations and complex integrations, but revenue is episodic. Over time, recurring managed contracts outpace project work. The Container-as-a-Service market reflects this shift as new features-SBOM automation, supply-chain security and FinOps dashboards-are bundled into subscription tiers that deliver measurable outcomes.
Containers As A Service Market Report Segments the Industry Into by Deployment (On-Premise, Cloud), by Service Type (Professional Services, Managed Services), Enterprise Size (Small and Medium Enterprises, Large Enterprises), End-User Application (BFSI, Retail, IT & Telecommunications, Manufacturing, Other End-User Applications), and Geography. The Market Forecasts are Provided in Terms of Value (USD).
Geography Analysis
North America earns 38.5% of 2024 revenue, benefitting from established hyperscale ecosystems and aggressive enterprise modernization. Major providers posted double-digit cloud revenue growth in 2025, reinforcing regional dominance. Skills shortages in Kubernetes operations, however, are creating a drag that fuels demand for managed services.
Asia-Pacific is forecast to grow at 39.4% CAGR, the fastest worldwide, due to sovereign-cloud rules and state-funded AI infrastructure. India allocated USD 1.3 billion for compute capacity, including 10,000 GPUs earmarked for public-private AI clusters. China's ecosystem, led by Alibaba Cloud, Tencent Cloud and Huawei Cloud, is expanding hybrid-cloud deployments, with Huawei Cloud Stack reporting 106% revenue growth in emerging Asia-Pacific markets.
Europe faces distinctive dynamics under the EU Data Act, effective September 2025, which mandates cloud portability and removes switching fees by 2027. Providers with genuinely cloud-agnostic architectures appear better positioned, while sovereignty clauses are likely to spur regional CaaS platforms. Germany, France and the United Kingdom lead adoption, but regulatory complexity could slow purchase cycles until certification schemes settle.
- Amazon Web Services
- Microsoft Azure
- Google Cloud (GKE)
- IBM Corp (Red Hat OpenShift)
- Alibaba Cloud
- VMware Tanzu
- Cisco Systems
- SUSE Rancher
- Oracle Container Engine
- Hewlett Packard Enterprise (Ezmeral)
- Mirantis
- D2iQ
- Platform9 Systems
- Akamai (Linode)
- DigitalOcean
- Rackspace Technology
- Nutanix
- Canonical
- HashiCorp
- Huawei Cloud
- Tencent Cloud
- OVHCloud
Additional Benefits:
- The market estimate (ME) sheet in Excel format
- 3 months of analyst support
TABLE OF CONTENTS
1 INTRODUCTION
- 1.1 Study Assumptions and Market Definition
- 1.2 Scope of the Study
2 RESEARCH METHODOLOGY
3 EXECUTIVE SUMMARY
4 MARKET LANDSCAPE
- 4.1 Market Overview
- 4.2 Market Drivers
- 4.2.1 Cloud-agnostic Kubernetes platforms avert lock-in
- 4.2.2 Pay-per-use transparency grows SME adoption
- 4.2.3 DevSecOps SBOM mandates accelerate managed CaaS
- 4.2.4 AI/ML GPU-ready clusters surge
- 4.2.5 5G edge micro-DC roll-outs need lightweight CaaS
- 4.2.6 Sovereign-cloud mandates spur domestic CaaS
- 4.3 Market Restraints
- 4.3.1 Shortage of certified K8s operators
- 4.3.2 Kernel-level escape and eBPF attack vectors
- 4.3.3 Unpredictable cloud egress fees
- 4.3.4 Fragmented observability licensing costs
- 4.4 Regulatory Landscape
- 4.5 Technological Outlook
- 4.6 Porter's Five Forces Analysis
- 4.6.1 Bargaining Power of Suppliers
- 4.6.2 Bargaining Power of Buyers
- 4.6.3 Threat of New Entrants
- 4.6.4 Threat of Substitutes
- 4.6.5 Intensity of Rivalry
- 4.7 Investment Analysis
5 MARKET SIZE AND GROWTH FORECASTS (VALUE)
- 5.1 By Deployment
- 5.1.1 Cloud
- 5.1.2 On-Premise
- 5.2 By Service Type
- 5.2.1 Managed Services
- 5.2.2 Professional Services
- 5.3 By Enterprise Size
- 5.3.1 Small and Medium Enterprises
- 5.3.2 Large Enterprises
- 5.4 By End-user Application
- 5.4.1 BFSI
- 5.4.2 Retail
- 5.4.3 IT and Telecommunications
- 5.4.4 Manufacturing
- 5.4.5 Healthcare
- 5.4.6 Government
- 5.4.7 Others (Media, Gaming, EdTech)
- 5.5 By Geography
- 5.5.1 North America
- 5.5.1.1 United States
- 5.5.1.2 Canada
- 5.5.1.3 Mexico
- 5.5.2 South America
- 5.5.2.1 Brazil
- 5.5.2.2 Argentina
- 5.5.2.3 Rest of South America
- 5.5.3 Europe
- 5.5.3.1 Germany
- 5.5.3.2 United Kingdom
- 5.5.3.3 France
- 5.5.3.4 Spain
- 5.5.3.5 Italy
- 5.5.3.6 Rest of Europe
- 5.5.4 Asia-Pacific
- 5.5.4.1 China
- 5.5.4.2 Japan
- 5.5.4.3 India
- 5.5.4.4 Australia
- 5.5.4.5 South Korea
- 5.5.4.6 Rest of Asia-Pacific
- 5.5.5 Middle East
- 5.5.5.1 Israel
- 5.5.5.2 Saudi Arabia
- 5.5.5.3 United Arab Emirates
- 5.5.5.4 Turkey
- 5.5.5.5 Rest of Middle East
- 5.5.6 Africa
- 5.5.6.1 South Africa
- 5.5.6.2 Egypt
- 5.5.6.3 Nigeria
- 5.5.6.4 Rest of Africa
- 5.5.1 North America
6 COMPETITIVE LANDSCAPE
- 6.1 Market Concentration
- 6.2 Strategic Moves
- 6.3 Market Share Analysis
- 6.4 Company Profiles (includes Global level Overview, Market level overview, Core Segments, Financials as available, Strategic Information, Market Rank/Share for key companies, Products and Services, and Recent Developments)
- 6.4.1 Amazon Web Services
- 6.4.2 Microsoft Azure
- 6.4.3 Google Cloud (GKE)
- 6.4.4 IBM Corp (Red Hat OpenShift)
- 6.4.5 Alibaba Cloud
- 6.4.6 VMware Tanzu
- 6.4.7 Cisco Systems
- 6.4.8 SUSE Rancher
- 6.4.9 Oracle Container Engine
- 6.4.10 Hewlett Packard Enterprise (Ezmeral)
- 6.4.11 Mirantis
- 6.4.12 D2iQ
- 6.4.13 Platform9 Systems
- 6.4.14 Akamai (Linode)
- 6.4.15 DigitalOcean
- 6.4.16 Rackspace Technology
- 6.4.17 Nutanix
- 6.4.18 Canonical
- 6.4.19 HashiCorp
- 6.4.20 Huawei Cloud
- 6.4.21 Tencent Cloud
- 6.4.22 OVHCloud
7 MARKET OPPORTUNITIES AND FUTURE OUTLOOK
- 7.1 White-space and Unmet-Need Assessment
 容器即服務 (CaaS) 市場:2026-2032 年全球市場預測(按服務類型、部署模式、組織規模和最終用戶行業分類)
 容器管理市場預測至 2034 年—按組件、部署模式、組織規模、容器類型、應用程式、最終用戶和地區分類的全球分析
 2026年全球容器即服務市場報告
 容器即服務 (CaaS) 市場規模、佔有率和成長分析(按部署模式、服務類型、最終用戶產業、容器技術、收費模式和地區分類)—2026-2033 年產業預測
 容器即服務市場 - 全球產業規模、佔有率、趨勢、機會及預測(按服務類型、部署模式、組織規模、產業垂直領域、地區和競爭格局分類,2021-2031 年)2032 年容器即服務 (CaaS) 市場預測:按服務類型、部署模式、組織規模、最終用戶和地區進行的全球分析
 容器即服務市場規模、佔有率和趨勢分析報告:按服務類型、部署、公司規模、最終用途、地區和細分市場進行預測,2025 年至 2033 年