


 |
市場調查報告書
商品編碼
1851091
5G服務:市場佔有率分析、產業趨勢、統計數據和成長預測(2025-2030年)5G Services - Market Share Analysis, Industry Trends & Statistics, Growth Forecasts (2025 - 2030) |
||||||
※ 本網頁內容可能與最新版本有所差異。詳細情況請與我們聯繫。
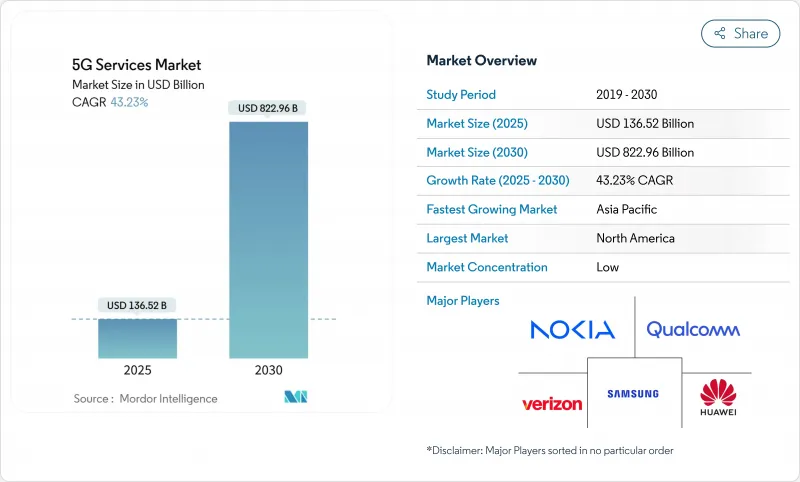
預計 5G 服務市場在 2025 年將創造 1,365.2 億美元的收入,到 2030 年將達到 8,229.6 億美元,複合年成長率為 43.23%。
通訊業者正從基於流量的收費轉向基於體驗的收費,這種模式對延遲、吞吐量和安全等級有保障,並收取額外費用,從而提升工業領域的平均用戶收入。製造業、醫療保健和物流正在採用專用 5G 網路來支援即時自動化、預測性維護和遠端操作。亞太地區透過積極開放頻譜和大規模部署 5G-Advanced 網路,保持其技術領先地位,而北美則利用其豐富的中頻段頻譜資源,加速固定無線接入 (FWA) 的普及。
全球5G服務市場趨勢與洞察
企業數位轉型用例
主要亮點
- 2024年行動數據流量將年增38%,到2030年將成長八倍,這將為4G網路帶來巨大壓力,並促使營運商向5G中頻段頻譜過渡。影片串流媒體已消耗超過70%的行動電話頻寬,促使營運商將流量分流至5G獨立網路核心網。隨著通訊業者能夠以更高的價格分佈提供分級無限流量套餐,同時降低每GB的成本,5G服務市場將從中受益。隨著智慧型手機處理器和顯示器的改進,4K行動視訊、雲端遊戲和基於XR的娛樂將推動流量成長,進一步鞏固預計的8.5%的複合年成長率。
透過網路切片和 SLA 層級實現獲利
美國商用5G網路的平均下載速度為225 Mbps,中國為405 Mbps,遠超過4G記錄。消費者如今期望獲得穩定的4K串流媒體播放和低延遲遊戲體驗,通訊業者在已開發市場推出高級速度套餐,每月每用戶平均收入(ARPU)增加5-10美元。行動裝置廠商預測,2024年5G智慧型手機出貨量將達到2.8億部,佔旗艦機型市場的81%,這鞏固了他們對大眾市場的承諾。通訊業者將透過基於速度的套餐和捆綁雲端遊戲通行證來滿足這項需求,在eMBB需求的推動下,實現6.2%的複合年成長率。體育場館、音樂會場館和交通樞紐擴大依賴5G小型基地台來支援高流量,這表明消費者願意為可預測的吞吐量付費。
實施成本高,投資回收期長
一座5G基地台的成本在10萬至20萬美元之間,而毫米波基地台的成本是其兩倍。到2025年,全球5G基礎設施投資將超過1.1兆美元,但損益平衡點通常需要8到10年,這給價格敏感地區的企業帶來了沉重的負擔。一些營運商報告稱,即使採用了節能軟體,電費也上漲了23%。這種壓力促使企業達成成本分攤協議,例如KDDI和Softbank Corporation在日本協力網路。像T-Mobile以44億美元收購UScellular的併購案也強化了企業追求規模經濟的趨勢。
細分市場分析
至2024年,增強型行動寬頻將佔5G服務市場64.20%的佔有率。超可靠、低延遲通訊將以60.30%的複合年成長率成長,這主要得益於依賴亞毫秒延遲的製造自動化和遠端手術等應用。大規模機器通訊在智慧城市網路中日益普及,根據Mobile World Live預測,到2033年,蜂巢式物聯網鏈路數量將達到75億。
URLLC(超可靠低延遲通訊)推動了高階業務的獲利模式,各產業為確保確定性效能而付費。預計到2030年,隨著醫院網路採用機器人手術鏈路,URLLC應用的5G服務市場規模將佔據較高的個位數佔有率。 RedCap和eRedCap設備的標準化降低了物聯網晶片組的成本,加速了簡化型工業感測器的商業化進程。網路切片為低資料速率設備分配專用頻寬,從而提高了物流公司的電池續航時間和可預測性。
區域分析
亞太地區預計在2024年貢獻全球42.00%的收入,並以56.42%的複合年成長率成為所有地區中成長最快的地區。中國聯通北京和華為聯合運作的5G-Advanced網路覆蓋1000萬人口,凸顯了融合頻譜接入、低成本硬體以及廠商與營運商緊密合作的生態系統(huawei.com)。印度的固定無線存取(FWA)市場目標是在2027年達到3,000萬用戶,反映出該國固定寬頻的龐大需求尚未滿足,目前只有11%的家庭享有有線寬頻存取。
在北美,豐富的中頻段頻譜和積極的固定無線接入(FWA)擴張已使預計到2027年5G用戶滲透率達到90%。 T-Mobile的643萬FWA用戶和Verizon的430萬FWA用戶表明,無線接入已成為光纖的主流替代方案。加拿大Rogers公司在該地區進行了首次網路切片測試,為企業級保固服務鋪平了道路。
歐洲在獨立組網(SA)覆蓋率方面落後,預計到2024年下半年SA覆蓋率僅2%。然而,德國、英國和西班牙正在加速部署,沃達豐和Three的合併(202.8億美元)預計將為SA部署提供更大的資金池。在中東和非洲,埃及投資6.09億美元計畫於2025年推出5G服務,南非已新增1,080萬用戶,覆蓋率超過50%。拉丁美洲也穩定擴張,巴西將在1300個城市推出商用5G服務,哥斯大黎加將於2025年2月分配四個頻寬的頻譜。
其他福利:
- Excel格式的市場預測(ME)表
- 3個月的分析師支持
目錄
第1章 引言
- 研究假設和市場定義
- 調查範圍
第2章調查方法
第3章執行摘要
第4章 市場洞察
- 市場概覽
- 市場促進因素
- 行動資料流程量的爆炸性成長
- 消費者對eMBB服務的需求很高
- 企業數位轉型用例
- 政府為開放頻寬所做的努力
- 在CBRS和頻寬授權頻段上部署私人5G網路
- 利用網路切片和 SLA 層級實現貨幣化
- 市場限制
- 實施成本高,投資報酬期長
- 碎片化且滯後的頻譜政策
- 新興市場5G設備準備度有限
第5章 市場動態
- 價值鏈分析
- 監管環境
- 技術展望
- 波特五力分析
- 新進入者的威脅
- 買方的議價能力
- 供應商的議價能力
- 替代品的威脅
- 競爭對手之間的競爭
第6章 市場規模與成長預測
- 按服務類型
- 高速大容量(eMBB)
- 超可靠、低延遲通訊(URLLC)
- 大規模機器通訊(mMTC)
- 透過網路架構
- 非獨立組網(NSA)5G
- 獨立組網(SA)5G
- 按最終用戶行業分類
- 資訊科技和電訊
- 媒體與娛樂
- 汽車與出行
- 能源與公共產業
- 航太/國防
- 製造業
- 衛生保健
- 其他行業
- 按地區
- 北美洲
- 美國
- 加拿大
- 墨西哥
- 南美洲
- 巴西
- 阿根廷
- 其他南美洲
- 歐洲
- 德國
- 英國
- 法國
- 義大利
- 俄羅斯
- 其他歐洲地區
- 亞太地區
- 中國
- 印度
- 日本
- 韓國
- ASEAN
- 亞太其他地區
- 中東和非洲
- 中東
- 沙烏地阿拉伯
- 阿拉伯聯合大公國
- 土耳其
- 其他中東地區
- 非洲
- 南非
- 奈及利亞
- 其他非洲地區
- 北美洲
第7章 競爭情勢
- 市場集中度
- 策略趨勢
- 市佔率分析
- 公司簡介
- China Mobile Ltd.
- Verizon Communications Inc.
- ATandT Inc.
- T-Mobile US Inc.
- China Telecom Corp. Ltd.
- Telefonaktiebolaget LM Ericsson
- Nokia Corp.
- Huawei Technologies Co. Ltd.
- Deutsche Telekom AG
- Vodafone Group Plc
- Orange SA
- Telefonica SA
- BT Group plc
- Swisscom AG
- Telstra Corp. Ltd.
- SK Telecom Co. Ltd.
- KT Corp.
- Rakuten Mobile Inc.
- Reliance Jio Infocomm Ltd.
- Qualcomm Inc.(5G as-a-Service platforms)
- Samsung Electronics Co. Ltd.(5G networks)
第8章:市場機會與未來展望
- 閒置頻段與未滿足需求評估
The 5G services market generated USD 136.52 billion in 2025 and is forecast to reach USD 822.96 billion by 2030, reflecting a 43.23% CAGR.
Standalone 5G rollouts, the commercial debut of network slicing, and a rapid shift from consumer to enterprise use cases underpin this expansion.Operators are moving away from traffic-based billing and toward experience-based pricing that charges premiums for assured latency, throughput, and security levels, boosting average revenue per user in industrial verticals. Manufacturing, healthcare, and logistics are adopting private 5G networks to support real-time automation, predictive maintenance, and remote operations-use cases that cannot be handled by legacy Wi-Fi. Asia Pacific retains technology leadership through aggressive spectrum releases and large-scale 5G-Advanced deployments, while North America leverages a deep mid-band spectrum pool to accelerate fixed wireless access (FWA) adoption.
Global 5G Services Market Trends and Insights
Enterprise Digital-Transformation Use Cases
Key Highlights
- Mobile-data traffic rose 38% year-on-year in 2024 and is tracking toward an eight-fold increase by 2030, straining 4 G networks and driving migration to 5 G mid-band spectrum. Video streaming already consumes more than 70% of cellular bandwidth, encouraging operators to off-load traffic to 5G stand-alone cores where higher spectral efficiency lowers cost per bit. eMBB services now average 38 GB per subscriber each month in South Korea, a figure that would saturate legacy radios. The 5G services market benefits because service providers can tier unlimited-data plans at higher price points while still reducing the cost per gigabyte. As smartphone processors and displays improve, 4K mobile video, cloud gaming, and XR-based entertainment will amplify traffic, reinforcing the 8.5% uplift in forecast CAGR.
Monetization via Network Slicing and SLA Tiers
Commercial 5 G networks deliver median download speeds of 225 Mbps in the United States and 405 Mbps in China, well above 4 G records. Consumers now expect consistent 4K streaming and low-latency gaming, prompting carriers to launch premium-speed tiers that add USD 5-10 to monthly ARPU in developed markets. Handset vendors shipped 280 million 5 G-capable smartphones in 2024, 81% of the flagship segment, cementing mass-market readiness. Operators monetize this appetite with speed-based plans and bundled cloud-gaming passes, producing the 6.2% CAGR lift attributed to eMBB demand. Stadiums, concert venues, and transportation hubs increasingly rely on 5 G small cells to sustain dense traffic, proving early willingness to pay for predictable throughput.
High Deployment Cost and Long ROI Horizons
Operators face steep capital commitments: a single 5G base-station costs USD 100,000-200,000, with millimeter-wave units up to twice as expensive. Global 5G infrastructure spend will top USD 1.1 trillion in 2025, yet breakeven is often eight to ten years, stretching balance sheets in price-sensitive regions. Energy outlays are also rising; some operators report 23% hikes in electricity bills even after adopting power-saving software. These pressures spur cost-sharing deals such as KDDI and SoftBank's joint network build in Japan, which aims to lower expenses by 30-40% through site co-location. Mergers like T-Mobile's USD 4.4 billion acquisition of UScellular reinforce the quest for scale economies.
Other drivers and restraints analyzed in the detailed report include:
- Enterprise Digital-Transformation Use Cases
- Government Spectrum-Release Initiatives
- Limited 5G Device Readiness in Emerging Markets
For complete list of drivers and restraints, kindly check the Table Of Contents.
Segment Analysis
Enhanced mobile broadband contributed 64.20% to the 5G services market in 2024, reflecting its foundational role in consumer video and gaming. Ultra-reliable low-latency communications is forecast to deliver a 60.30% CAGR, buoyed by manufacturing automation and telesurgery, which depend on sub-millisecond latency. Massive machine-type communications is gaining traction in smart-city grids, with cellular IoT links predicted to hit 7.5 billion by 2033, according to Mobile World Live.
URLLC drives premium monetization because industries will pay to ensure deterministic performance. The 5G services market size for URLLC applications is projected to capture a high-single-digit share by 2030 as hospital networks adopt robotic-surgery links. Standardization of RedCap and eRedCap devices keeps IoT chipset costs down, hastening commercial readiness for simplified industrial sensors. Network slicing allocates dedicated bandwidth to low-data-rate devices, improving battery life and predictability for logistics firms.
The 5G Service Market Report is Segmented by Service Type (Enhanced Mobile Broadband (eMBB), Ultra-Reliable Low-Latency Comms (URLLC), and More), Network Architecture (Non-Standalone (NSA) 5G and Standalone (SA) 5G), End-User Industry (IT and Telecom, Media and Entertainment, Automotive and Mobility, and More), and Geography. The Market Forecasts are Provided in Terms of Value (USD).
Geography Analysis
Asia Pacific generated 42.00% of global revenue in 2024 and is on track for a 56.42% CAGR, the fastest among all regions. China Unicom Beijing and Huawei activated a 5G-Advanced network covering 10 million people, highlighting an ecosystem that blends spectrum access, low-cost hardware, and tight vendor-operator collaboration huawei.com. India's FWA market aims for 30 million users by 2027, reflecting unmet fixed-broadband demand in a nation where only 11% of households enjoy wired access.
North America already records 90% 5G subscription penetration forecasts for 2027, driven by abundant mid-band spectrum and aggressive FWA scaling. T-Mobile's 6.43 million FWA customers and Verizon's 4.3 million illustrate how wireless has become a mainstream alternative to fiber. Canada's Rogers performed the region's first network-slicing trial, paving the way for guaranteed service to enterprises.
Europe lags in standalone coverage, with only 2% SA availability in late 2024. Yet Germany, the UK, and Spain accelerate deployment, while the USD 20.28 billion Vodafone-Three merger promises deeper capital pools for SA rollouts. In the Middle East and Africa, Egypt invested USD 609 million to prepare for 2025 launches, and South Africa reaches over 50% population coverage with 10.8 million users. Latin America is steadily expanding, with Brazil's commercial 5G live in 1,300 cities and Costa Rica allocating spectrum across four bands in February 2025.
- China Mobile Ltd.
- Verizon Communications Inc.
- ATandT Inc.
- T-Mobile US Inc.
- China Telecom Corp. Ltd.
- Telefonaktiebolaget LM Ericsson
- Nokia Corp.
- Huawei Technologies Co. Ltd.
- Deutsche Telekom AG
- Vodafone Group Plc
- Orange S.A.
- Telefonica S.A.
- BT Group plc
- Swisscom AG
- Telstra Corp. Ltd.
- SK Telecom Co. Ltd.
- KT Corp.
- Rakuten Mobile Inc.
- Reliance Jio Infocomm Ltd.
- Qualcomm Inc. (5G as-a-Service platforms)
- Samsung Electronics Co. Ltd. (5G networks)
Additional Benefits:
- The market estimate (ME) sheet in Excel format
- 3 months of analyst support
TABLE OF CONTENTS
1 INTRODUCTION
- 1.1 Study Assumptions and Market Definition
- 1.2 Scope of the Study
2 RESEARCH METHODOLOGY
3 EXECUTIVE SUMMARY
4 MARKET INSIGHTS
- 4.1 Market Overview
- 4.2 Market Drivers
- 4.2.1 Exploding mobile data traffic
- 4.2.2 High consumer demand for eMBB services
- 4.2.3 Enterprise digital-transformation use-cases
- 4.2.4 Government spectrum-release initiatives
- 4.2.5 Private-5G uptake in CBRS and local-licence bands
- 4.2.6 Monetisation via network slicing and SLA tiers
- 4.3 Market Restraints
- 4.3.1 High deployment cost and long ROI horizons
- 4.3.2 Fragmented and delayed spectrum policy
- 4.3.3 Limited 5G device readiness in emerging markets
5 MARKET DYNAMICS
- 5.1 Value Chain Analysis
- 5.2 Regulatory Landscape
- 5.3 Technological Outlook
- 5.4 Porter's Five Forces Analysis
- 5.4.1 Threat of New Entrants
- 5.4.2 Bargaining Power of Buyers
- 5.4.3 Bargaining Power of Suppliers
- 5.4.4 Threat of Substitutes
- 5.4.5 Intensity of Competitive Rivalry
6 MARKET SIZE AND GROWTH FORECASTS (VALUE)
- 6.1 By Service Type
- 6.1.1 Enhanced Mobile Broadband (eMBB)
- 6.1.2 Ultra-Reliable Low-Latency Comms (URLLC)
- 6.1.3 Massive Machine-Type Comms (mMTC)
- 6.2 By Network Architecture
- 6.2.1 Non-Standalone (NSA) 5G
- 6.2.2 Standalone (SA) 5G
- 6.3 By End-User Industry
- 6.3.1 IT and Telecom
- 6.3.2 Media and Entertainment
- 6.3.3 Automotive and Mobility
- 6.3.4 Energy and Utilities
- 6.3.5 Aerospace and Defense
- 6.3.6 Manufacturing
- 6.3.7 Healthcare
- 6.3.8 Other Industries
- 6.4 By Geography
- 6.4.1 North America
- 6.4.1.1 United States
- 6.4.1.2 Canada
- 6.4.1.3 Mexico
- 6.4.2 South America
- 6.4.2.1 Brazil
- 6.4.2.2 Argentina
- 6.4.2.3 Rest of South America
- 6.4.3 Europe
- 6.4.3.1 Germany
- 6.4.3.2 United Kingdom
- 6.4.3.3 France
- 6.4.3.4 Italy
- 6.4.3.5 Russia
- 6.4.3.6 Rest of Europe
- 6.4.4 Asia Pacific
- 6.4.4.1 China
- 6.4.4.2 India
- 6.4.4.3 Japan
- 6.4.4.4 South Korea
- 6.4.4.5 ASEAN
- 6.4.4.6 Rest of Asia Pacific
- 6.4.5 Middle East and Africa
- 6.4.5.1 Middle East
- 6.4.5.1.1 Saudi Arabia
- 6.4.5.1.2 UAE
- 6.4.5.1.3 Turkey
- 6.4.5.1.4 Rest of Middle East
- 6.4.5.2 Africa
- 6.4.5.2.1 South Africa
- 6.4.5.2.2 Nigeria
- 6.4.5.2.3 Rest of Africa
- 6.4.1 North America
7 COMPETITIVE LANDSCAPE
- 7.1 Market Concentration
- 7.2 Strategic Moves
- 7.3 Market Share Analysis
- 7.4 Company Profiles {(includes Global level Overview, Market level overview, Core Segments, Financials as available, Strategic Information, Market Rank/Share for key companies, Products and Services, and Recent Developments)}
- 7.4.1 China Mobile Ltd.
- 7.4.2 Verizon Communications Inc.
- 7.4.3 ATandT Inc.
- 7.4.4 T-Mobile US Inc.
- 7.4.5 China Telecom Corp. Ltd.
- 7.4.6 Telefonaktiebolaget LM Ericsson
- 7.4.7 Nokia Corp.
- 7.4.8 Huawei Technologies Co. Ltd.
- 7.4.9 Deutsche Telekom AG
- 7.4.10 Vodafone Group Plc
- 7.4.11 Orange S.A.
- 7.4.12 Telefonica S.A.
- 7.4.13 BT Group plc
- 7.4.14 Swisscom AG
- 7.4.15 Telstra Corp. Ltd.
- 7.4.16 SK Telecom Co. Ltd.
- 7.4.17 KT Corp.
- 7.4.18 Rakuten Mobile Inc.
- 7.4.19 Reliance Jio Infocomm Ltd.
- 7.4.20 Qualcomm Inc. (5G as-a-Service platforms)
- 7.4.21 Samsung Electronics Co. Ltd. (5G networks)
8 MARKET OPPORTUNITIES AND FUTURE OUTLOOK
- 8.1 White-space and Unmet-need Assessment
 5G服務市場預測至2034年——全球通訊方式、服務類型、應用、產業、最終用戶和地區分析——產業特定分析
 5G服務市場規模、佔有率和趨勢分析報告:按通訊類型、行業和細分市場分類的預測(2026-2033年)
 2026-2030年全球5G服務市場
 5G服務市場:按組件、架構、應用和最終用戶產業分類-2026-2032年全球市場預測
 2026年全球5G服務市場報告
 5G服務市場分析及預測(至2035年):依類型、產品類型、服務、技術、組件、應用、部署類型、最終用戶及功能分類
 2026-2034年全球5G服務市場規模、佔有率、趨勢和成長分析報告
 5G服務市場-全球產業規模、佔有率、趨勢、機會及預測(依通訊類型、產業垂直領域、最終用途、地區及競爭格局分類,2021-2031年)
 5G服務市場:產業趨勢·全球預測 (~2035年):服務類型·通訊類型·技術·用途·終端用戶·企業規模·各地區
 5G 服務市場規模、佔有率及成長分析(按通訊類型、企業、應用、最終用戶和地區)- 產業預測(2025 年至 2032 年)