


 |
市場調查報告書
商品編碼
1851074
美國貨運經紀:市場佔有率分析、行業趨勢、統計數據和成長預測(2025-2030 年)United States Freight Brokerage - Market Share Analysis, Industry Trends & Statistics, Growth Forecasts (2025 - 2030) |
||||||
※ 本網頁內容可能與最新版本有所差異。詳細情況請與我們聯繫。
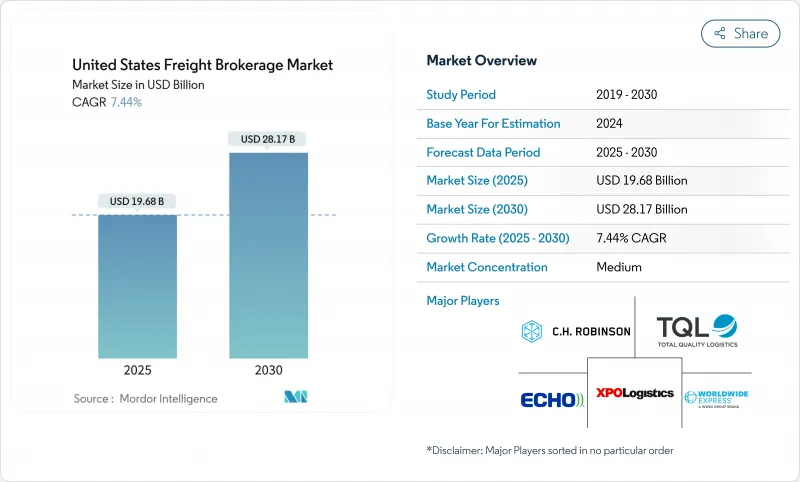
美國貨運經紀市場預計到 2025 年將達到 196.8 億美元,到 2030 年將達到 281.7 億美元,預測期內複合年成長率為 7.44%。
成長動能主要得益於數位化貨運平台的快速普及、持續的電子商務需求以及聯邦政府對基礎設施的持續投資。技術賦能的仲介正在擴大自動化程度以縮短交易時間,而傳統仲介業者則轉向整合以獲得規模優勢。司機短缺和對現貨市場日益成長的依賴,使得那些擁有龐大承運商網路和即時定價引擎的仲介業者更具優勢。同時,自有資產承運商正在增設經紀業務部門以維持利潤率,迫使純粹的貨運仲介透過專業的合規服務、溫控運力或運輸管理合約等方式來脫穎而出。預測數位化、電子記錄數據和創業融資的整合預計將進一步擴大數位成熟企業和落後企業之間的績效差距,重塑美國貨運代理市場的競爭格局。
美國貨運經紀市場趨勢與洞察
國內貨車負載容量短缺及司機短缺
駕駛者的高流動率持續造成運力緊張,導致現貨競標被拒率不斷上升。中型貨主越來越依賴仲介業者來確保在合約承運商拒絕競標時獲得卡車。隨著自動發布資訊縮短了緊急貨運所需的時間,數位化貨運平台正在吸引越來越多的貨運量。遠距冷藏運輸線路的司機短缺問題最為嚴重,這提高了仲介在該細分市場的議價能力。承運商要求更高的運費以抵消留任獎金,而精明的仲介則將回程傳輸機會打包出售,以確保卡車持續運作。因此,即使自有車隊擴大了直接銷售,運力緊張仍然使仲介保持著重要的地位。
電子商務小包裹量增加
快速的線上訂購正在改變貨運模式,使其朝著更小、更頻繁的運輸方向發展,從而提升小件包裹的運輸能力。預計到2025年,主要零擔貨運公司將把一般貨運費率提高4.9%至7.9%,這表明托盤空間將受到限制。計劃於2025年7月實施的基於密度的貨運重新分類將增加較輕型電商小包裹的成本,並凸顯仲介經紀人在貨物分類方面的專業知識的重要性。隨著托運人尋求即時成本可見性,提供動態報價的數位零擔貨運平台將獲得更大的市場佔有率。能夠將小包裹預先包裝成零擔貨物的仲介可以透過降低單件運輸成本來獲得額外價值。因此,美國貨運經紀市場正受惠於電子商務向中末端配送最佳化方向的根本性轉變。
柴油價格波動
預計2024年美國柴油平均價格將在每加侖3.43美元至4.58美元之間波動,漲幅超過燃油額外費用的調整幅度,擠壓了仲介的現貨利潤。大型仲介正在實施包含美國能源資訊署資料的避險模型來預測額外費用,而小型仲介往往定價錯誤,損害了收入淨額的利潤。冷藏運輸線路受到冷藏車燃油消耗過高的嚴重衝擊。一些仲介正在發布包含即時燃油條款的「全包」報價,以保持價格透明度並確保利潤。價格波動的不確定性使得托運人不願鎖定年度運價,轉而選擇以交易為基礎的現貨經紀服務。
細分市場分析
美國貨運經紀市場規模將繼續以整車運輸 (FTL) 為主,預計到 2024 年將佔總收入的 63.75%,而零擔運輸 (LTL) 的複合年成長率 (CAGR) 到 2030 年將達到 9.0%。能夠在幾秒鐘內提供托盤級報價的數位化平台正在從人工電話和傳真工作流程中搶佔業務量。將於 2025 年 7 月生效的基於密度的重新分類將獎勵那些能夠重新設計包裝尺寸的仲介,使托運人能夠避免將輕型大件產品歸入較高等級的運費類別。
儘管整車運輸 (FTL) 仍佔據遠距工業貨運的大部分佔有率,但司機短缺和設備限制正促使托運人轉向零擔 (LTL) 多樞紐整合。包裹轉零擔 (LTL) 整合樞紐能夠緩解最後一公里擁塞並降低單位成本,使仲介能夠透過增值交叉轉運服務獲得新的利潤。專業仲介也在利用「部分整車」服務來彌合零擔 (LTL) 和整車 (FTL) 之間的差距。因此,多元化服務能力如今已成為在貨運代理市場贏得各種招標項目 (RFP) 的基準。
到2024年,乾貨車將佔總收入的44.65%,而冷藏車將以10.1%的複合年成長率成長,這將推動美國貨運經紀市場在該設備細分領域的規模在預測期內擴大。食品和藥品托運人對溫度驗證和電子封條的需求日益成長,這使得擁有配備遠端資訊處理系統的承運商資源的仲介更具優勢。
西海岸特色農產品出口的成長將推動對中西部和東部冷藏回程傳輸運輸的需求。仲介正將溫度監控和滯期費減免納入定價溢價。平板車和階梯式平板車設施將在春季施工期間激增,而油罐車仲介由於危險品墊合規方面的負擔,仍處於小眾市場。因此,設施的靈活性將是贏得2025年多模態合約的關鍵。
美國貨運仲介市場報告按服務類型(例如整車運輸)、設備/拖車類型(例如乾貨廂式貨車)、運輸距離(例如遠距)、經營模式(例如傳統貨運仲介)、最終用戶(例如製造業)、客戶規模(例如大型企業)和地區(例如東北部)進行細分。該報告提供了上述所有細分市場的市場規模和預測(以美元計)。
其他福利:
- Excel格式的市場預測(ME)表
- 3個月的分析師支持
目錄
第1章 引言
- 研究假設和市場定義
- 調查範圍
第2章調查方法
第3章執行摘要
第4章 市場情勢
- 市場概覽
- 市場促進因素
- 國內貨車負載容量和司機短缺推高了現貨仲介的活動。
- 電子商務小包裹量的成長推動了零擔仲介的採用。
- 托運人對運輸管理和第四方物流解決方案的需求
- 電子記錄設備(ELD)強制令增加對合規承運商仲介的依賴
- 創業投資將加速數位化貨運匹配平台的資金籌措
- 《基礎設施投資與就業法案》(IIJA)重新運作建築相關貨物運輸
- 市場限制
- 柴油價格波動對仲介的現貨利潤帶來壓力。
- 港口擁擠和底盤短缺威脅運輸可靠性
- 資產型承運商擴大直接托運人中介業務(利潤率承壓)
- 仲介保證金要求和聯邦政府對詐欺案件的監管力度加大
- 價值/供應鏈分析
- 主要政府法規與措施(HOS、AB5、限速器NPRM)
- 技術概覽(數位貨運經紀、物聯網、人工智慧、視覺化API)
- 波特五力模型
- 供應商的議價能力
- 買方的議價能力
- 新進入者的威脅
- 替代品的威脅
- 競爭對手之間的競爭
- 美國物流業概覽
- 現貨卡車運費與合約卡車運費的分析
- 地緣政治事件如何影響市場
第5章 市場規模與成長預測
- 透過服務
- 整車運輸 (FTL)
- 低於100%的運費(零擔運輸)
- 其他
- 依設備/拖車類型
- 乾貨車
- 冷藏車
- 平板/階梯式平板車
- 油輪(散裝液體和化學品)
- 其他
- 按運輸距離
- 遠距運輸(超過 500 英里)
- 按地區(100-500英里)
- 本地(100英里以內)
- 按經營模式
- 傳統貨運代理
- 基於資產的貨運經紀
- 代理模式貨運經紀
- 數位貨運經紀
- 按最終用戶行業分類
- 製造業和汽車業
- 建築和基礎設施計劃
- 石油、天然氣、採礦和化工
- 農業和食品
- 零售、快速消費品和批發分銷
- 醫療保健和製藥
- 電子商務與第三方物流履約
- 其他終端用戶產業
- 按客戶規模
- 大型企業貨主(貨物使用量超過1億美元)
- 中型貨運公司(年營業額1000萬美元至1億美元)
- 小型企業(營業額低於1000萬美元)
- 按地區
- 東北
- 中西部
- 東南
- 西南
- 西
第6章 競爭情勢
- 市場集中度
- 策略性舉措(併購、資金籌措、夥伴關係)
- 市佔率分析
- 公司簡介
- CH Robinson Worldwide Inc.
- Total Quality Logistics(TQL)
- XPO Logistics Inc.
- Echo Global Logistics
- Worldwide Express
- Coyote Logistics(UPS)
- Landstar System Inc.
- Schneider FreightPlus
- GlobalTranz(WWEX)
- JB Hunt 3600
- Hub Group
- Uber Freight
- BNSF Logistics
- SunteckTTS
- Arrive Logistics
- Nolan Transportation Group
- Mode Global
- Convoy Inc.
- Red Technologies
- ArcBest Corporation
- Allen Lund Company
- Redwood Logistics
- BlueGrace Logistics
- Trinity Logistics
第7章 市場機會與未來展望
The United States freight brokerage market is valued at USD 19.68 billion in 2025 and is set to reach USD 28.17 billion by 2030, registering a 7.44% CAGR through the forecast period.
Growth momentum is supported by the rapid uptake of digital freight platforms, sustained e-commerce demand, and continued federal investment in infrastructure. Tech-enabled brokers are scaling automation to compress transaction time, while traditional intermediaries look to mergers for scale advantages. Driver shortages and heightened spot-market reliance continue to favor intermediaries that maintain deep carrier networks and real-time pricing engines. At the same time, asset-based carriers are bolting on brokerage desks to protect margins, forcing pure-play brokers to differentiate through specialized compliance, temperature-controlled capacity, or managed-transport contracts. The convergence of predictive analytics, electronic logging data, and venture funding is expected to widen the performance gap between digitally mature and lagging firms, thereby reshaping competitive hierarchies across the United States freight brokerage market.
United States Freight Brokerage Market Trends and Insights
Tight Domestic Truckload Capacity and Driver Shortage
Persistent driver turnover keeps capacity tight and lifts spot tender rejection rates, pushing more loads toward brokers with agile matching engines. Mid-sized shippers increasingly depend on intermediaries to secure trucks when contract carriers reject tenders. Digital load boards capture rising volume because automated postings reduce the time needed to cover urgent freight. Driver scarcity is most acute for long-haul refrigerated lanes, intensifying broker leverage in that sub-market. Carriers are demanding higher rates to offset retention bonuses, and savvy brokers bundle back-haul opportunities to keep trucks moving. Tight capacity, therefore, sustains brokerage relevance even as asset-based fleets expand direct sales.
Heightened E-Commerce Parcel Volumes
Rapid-fire online ordering pivots shipment profiles toward smaller, more frequent loads that favor Less-than-Truckload capacity. General rate increases of 4.9%-7.9% across major LTL carriers in 2025 signal constrained pallet space and bolster broker margins when they secure capacity in advance. Density-based freight re-classification slated for July 2025 will lift costs on lightweight e-commerce parcels, reinforcing the need for brokerage expertise in class assignment. Digital LTL portals offering dynamic quoting stand to gain market share as shippers seek rapid cost visibility. Brokers capable of pre-consolidating parcel freight into LTL moves can capture incremental value by reducing per-unit shipping costs. The United States freight brokerage market thus benefits from the structural e-commerce shift toward middle- and final-mile optimization.
Volatile Diesel Prices
Average U.S. diesel swung between USD 3.43 and USD 4.58 per gallon in 2024, outpacing fuel-surcharge recalibration and compressing broker spot margins. Large brokers deploy hedging models that ingest Energy Information Administration data to anticipate surcharges, but smaller players often misprice loads, eroding net revenue. Refrigerated lanes are hit hard because reefer units consume extra fuel. Some brokers now publish "all-in" offers with real-time fuel clauses to shield margins while maintaining price transparency. Fluctuation uncertainty discourages shippers from locking year-long rates, nudging them to transactional spot brokerage.
Other drivers and restraints analyzed in the detailed report include:
- Shipper Demand for Managed Transportation
- ELD Mandate Compliance Requirements
- Port Congestion and Chassis Shortages
For complete list of drivers and restraints, kindly check the Table Of Contents.
Segment Analysis
The United States freight brokerage market size for service lines continues to skew toward FTL, which generated 63.75% of revenue in 2024, yet the LTL corridor is on track for a 9.0% CAGR through 2030. Digital platforms that quote pallet-level rates within seconds are winning volume from manual call-and-fax workflows. The density-based re-classification in July 2025 will reward brokers able to re-engineer packaging dimensions so that shippers avoid higher classes for light bulky products.
FTL still commands the bulk of long-haul industrial freight, but driver scarcity and equipment constraints are nudging shippers to multistop LTL consolidations. Parcel-to-LTL consolidation hubs reduce last-mile congestion and cut per-unit cost, giving brokers new margins on value-added cross-dock services. Specialized brokers also exploit "partial truckload" offerings to bridge the gap between LTL and FTL. Consequently, multi-service capability is now a benchmark for winning diversified RFPs across the United States freight brokerage market.
Dry vans produced 44.65% of revenue in 2024, but refrigerated units are advancing at 10.1% CAGR, lifting the equipment segment's United States freight brokerage market size over the forecast horizon. Food-grade and pharmaceutical shippers require temperature verification and electronic seals, favoring brokers with telematics-equipped carrier pools.
Rising specialty produce exports out of the West Coast elevate back-haul demand for reefers into the Midwest and East. Brokers bundle harmonized temperature monitoring and detention mitigation into premium pricing. Flatbed and step-deck equipment remains cyclical, spiking during spring construction, while tanker brokerage stays niche due to hazmat compliance burdens. Equipment flexibility, therefore, became central to winning multi-modal contracts in 2025.
The US Freight Brokerage Market Report is Segmented by Service (FTL and More), by Equipment / Trailer Type (Dry Van and More), by Haul Length (Long-Haul and More), by Business Model (Traditional Freight Brokerage and More), by End User (Manufacturing and More), by Customer Size (Large Enterprise and More), and by Geography (Northeast and More). The Report Offers Market Size and Forecasts in Value (USD) for all the Above Segments.
List of Companies Covered in this Report:
- C.H. Robinson Worldwide Inc.
- Total Quality Logistics (TQL)
- XPO Logistics Inc.
- Echo Global Logistics
- Worldwide Express
- Coyote Logistics (UPS)
- Landstar System Inc.
- Schneider FreightPlus
- GlobalTranz (WWEX)
- J.B. Hunt 3600
- Hub Group
- Uber Freight
- BNSF Logistics
- SunteckTTS
- Arrive Logistics
- Nolan Transportation Group
- Mode Global
- Convoy Inc.
- Red Technologies
- ArcBest Corporation
- Allen Lund Company
- Redwood Logistics
- BlueGrace Logistics
- Trinity Logistics
Additional Benefits:
- The market estimate (ME) sheet in Excel format
- 3 months of analyst support
TABLE OF CONTENTS
1 Introduction
- 1.1 Study Assumptions & Market Definition
- 1.2 Scope of the Study
2 Research Methodology
3 Executive Summary
4 Market Landscape
- 4.1 Market Overview
- 4.2 Market Drivers
- 4.2.1 Tight Domestic Truckload Capacity & Driver Shortage Boosting Spot Brokerage Activity
- 4.2.2 Heightened E-Commerce Parcel Volumes Driving LTL Brokerage Penetration
- 4.2.3 Shipper Demand for Managed Transportation & 4PL Solutions
- 4.2.4 Electronic Logging Device (ELD) Mandate Increasing Reliance on Brokers for Compliance-Ready Carriers
- 4.2.5 Venture-Capital Funding Accelerating Digital Freight-Matching Platforms
- 4.2.6 Infrastructure Investment & Jobs Act (IIJA) Re-energising Construction-Related Freight Flows
- 4.3 Market Restraints
- 4.3.1 Volatile Diesel Prices Compressing Spot Margin for Brokers
- 4.3.2 Port Congestion & Chassis Shortages Disrupting Drayage Reliability
- 4.3.3 Asset-Based Carriers Expanding Direct-to-Shipper Brokerage (Margin Squeeze)
- 4.3.4 Increasing Federal Scrutiny on Broker Bond Requirements & Fraud Cases
- 4.4 Value / Supply-Chain Analysis
- 4.5 Key Government Regulations & Initiatives (HOS, AB5, Speed-Limiter NPRM)
- 4.6 Technology Snapshot (Digital Freight Brokerage, IoT, AI, Visibility APIs)
- 4.7 Porter's Five Forces
- 4.7.1 Bargaining Power of Suppliers
- 4.7.2 Bargaining Power of Buyers
- 4.7.3 Threat of New Entrants
- 4.7.4 Threat of Substitutes
- 4.7.5 Competitive Rivalry
- 4.8 US Logistics Industry Overview
- 4.9 Insights on Spot vs. Contract Truck Rates
- 4.10 Impact of Geopolitical Events on the Market
5 Market Size & Growth Forecasts (Value)
- 5.1 By Service
- 5.1.1 Full-Truckload (FTL)
- 5.1.2 Less-than-Truckload (LTL)
- 5.1.3 Others
- 5.2 By Equipment / Trailer Type
- 5.2.1 Dry Van
- 5.2.2 Refrigerated Van
- 5.2.3 Flatbed / Step-Deck
- 5.2.4 Tanker (Bulk Liquid & Chemical)
- 5.2.5 Others
- 5.3 By Haul Length
- 5.3.1 Long-Haul (More than 500 miles)
- 5.3.2 Regional (100-500 miles)
- 5.3.3 Local (Less than 100 miles)
- 5.4 By Business Model
- 5.4.1 Traditional Freight Brokerage
- 5.4.2 Asset-Based Freight Brokerage
- 5.4.3 Agent Model Freight Brokerage
- 5.4.4 Digital Freight Brokerage
- 5.5 By End-User Industry
- 5.5.1 Manufacturing & Automotive
- 5.5.2 Construction & Infrastructure Projects
- 5.5.3 Oil, Gas, Mining & Chemicals
- 5.5.4 Agriculture & Food / Beverage
- 5.5.5 Retail, FMCG & Wholesale Distribution
- 5.5.6 Healthcare & Pharmaceuticals
- 5.5.7 E-commerce & 3PL Fulfilment
- 5.5.8 Other End-User Industry
- 5.6 By Customer Size
- 5.6.1 Large Enterprise Shippers (More than $100 M Freight Spend)
- 5.6.2 Mid-Market Shippers ($10-100 M)
- 5.6.3 Small Businesses (Less than $10 M)
- 5.7 By Geography
- 5.7.1 Northeast
- 5.7.2 Midwest
- 5.7.3 Southeast
- 5.7.4 Southwest
- 5.7.5 West
6 Competitive Landscape
- 6.1 Market Concentration
- 6.2 Strategic Moves (M&A, Funding, Partnerships)
- 6.3 Market Share Analysis
- 6.4 Company Profiles (includes Global-level Overview, Market-level Overview, Core Segments, Financials, Strategic Information, Market Rank/Share, Products & Services, and Recent Developments)
- 6.4.1 C.H. Robinson Worldwide Inc.
- 6.4.2 Total Quality Logistics (TQL)
- 6.4.3 XPO Logistics Inc.
- 6.4.4 Echo Global Logistics
- 6.4.5 Worldwide Express
- 6.4.6 Coyote Logistics (UPS)
- 6.4.7 Landstar System Inc.
- 6.4.8 Schneider FreightPlus
- 6.4.9 GlobalTranz (WWEX)
- 6.4.10 J.B. Hunt 3600
- 6.4.11 Hub Group
- 6.4.12 Uber Freight
- 6.4.13 BNSF Logistics
- 6.4.14 SunteckTTS
- 6.4.15 Arrive Logistics
- 6.4.16 Nolan Transportation Group
- 6.4.17 Mode Global
- 6.4.18 Convoy Inc.
- 6.4.19 Red Technologies
- 6.4.20 ArcBest Corporation
- 6.4.21 Allen Lund Company
- 6.4.22 Redwood Logistics
- 6.4.23 BlueGrace Logistics
- 6.4.24 Trinity Logistics
7 Market Opportunities & Future Outlook
- 7.1 White-Space & Unmet-Need Assessment
 貨運代理服務市場:依服務類型、運輸方式、客戶規模、貨物類型、技術應用及最終用戶產業分類-2026-2032年全球市場預測
 美國整車貨運經紀市場:市場佔有率分析、產業趨勢與統計、成長預測(2026-2031 年)
 全球貨運仲介市場規模、佔有率、趨勢和成長分析報告(2026-2034)
 2026-2030年全球貨運仲介市場
 2026-2030年全球數位貨運經紀市場
 數位貨運經紀市場機會、成長促進因素、產業趨勢分析及預測(2026-2035年)
 2032 年數位貨運經紀市場預測:按平台類型、運輸方式、服務類型、部署模式、最終用戶和地區進行的全球分析
 2025年數位貨運經紀全球市場報告全球數位貨運經紀市場-以運輸方式、垂直產業、區域範圍、預測分類的市場規模
 全球數位貨運經紀市場規模、佔有率、趨勢分析報告:依客戶類型、運輸方式、服務類型、最終用戶產業、地區、展望與預測,2025年至2032年