


 |
市場調查報告書
商品編碼
1851069
演算法交易:市場佔有率分析、行業趨勢、統計數據和成長預測(2025-2030 年)Algorithmic Trading - Market Share Analysis, Industry Trends & Statistics, Growth Forecasts (2025 - 2030) |
||||||
※ 本網頁內容可能與最新版本有所差異。詳細情況請與我們聯繫。
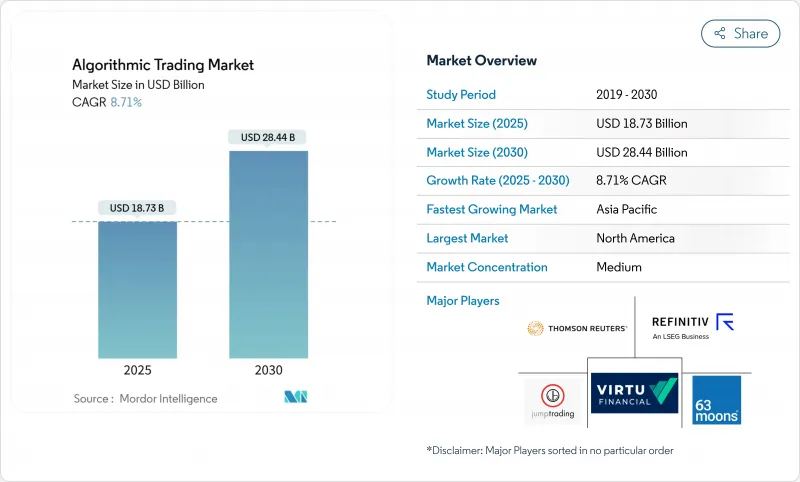
預計到 2025 年,演算法交易市場規模將達到 187.3 億美元,到 2030 年將達到 284.4 億美元,年複合成長率為 8.71%。
隨著人工智慧技術提升執行品質並幫助交易員應對市場波動,其應用正在加速發展。北美交易所引領創新,而亞太地區的強勁需求正在擴大潛在用戶群。儘管機構交易部門仍然是交易量的主要驅動力,但散戶投資者對低程式碼自動化的利用正在重塑競爭格局。與模型設計和合規相關的服務收入成長速度超過了平台收入,抵消了企業在安全本地基礎設施方面不斷成長的支出。同時,雲端延遲的快速下降也吸引了那些曾經持觀望態度的小型企業加入。
全球演算法交易市場趨勢與洞察
對亞毫秒訂單執行的需求日益成長
在美國和日本股市,延遲競賽的焦點正從微秒轉移到皮秒。各公司紛紛部署現場可編程閘陣列(FPGA)和客製化光纖線路,以縮短延遲,並試圖從每年價值50億美元的全球延遲套利市場中分一杯羹。專利訴訟凸顯了速度的策略價值。但資本密集的升級可能會使天平向資金雄厚的企業傾斜,並加劇市場集中度。
被動投資資產的快速成長推動了指數再平衡演算法的更新換代
到2024年,全球ETF資產規模將達到13.8兆美元。資金再平衡流動會形成龐大且時間緊迫的訂單簿,這需要複雜的演算法執行才能在不影響價格的情況下追蹤基準權重。過去十年,被動型UCITS基金在歐洲的佔有率成長了一倍以上,這增加了對能夠應對複雜相關性並最大限度減少市場衝擊的跨資產模型的需求。
交易所託管成本不斷上漲,對中型交易平台帶來壓力。
更高的費用,例如MIAX PEARL的10Gb超長距離光纖網路月費漲至13,500美元,可能會給中型自營網路營運商的資產負債表帶來壓力,並迫使它們縮減規模。高昂的進入門檻雖然保護了現有營運商,但也縮小了競爭範圍,並可能降低低銷售產品的價差。
細分市場分析
到2024年,機構投資者將佔據演算法交易市場61%的佔有率,這得益於雄厚的資本和完善的基礎設施。然而,隨著易於使用的平台不斷複製機構套件,散戶交易者正以10.8%的複合年成長率快速成長。經紀商入口網站現在將策略建構器、訂單路由演算法和回測庫捆綁在一起,降低了技術門檻。教育舉措將透過建立信任和普及自動化技術來促進其應用。監管機構將繼續保持警惕,確保為非專業用戶提供充分的保障。
零售參與能夠帶來新的訂單流,並促進價格競爭。然而,零售交易量的增加也提高了對穩健風險管理的需求,因為群眾外包模式可能導致意想不到的價格趨同。經紀商分析顯示,他們越來越傾向於利用日內微觀結構進行短週期交易的策略,這與機構的超短線交易策略類似。隨著時間的推移,零售交易量的湧入可能會削弱傳統交易部門在某些流動性熱點領域的主導地位。
到2024年,整合了執行引擎、分析儀錶板和連接適配器的解決方案將佔據演算法交易市場73.5%的佔有率。然而,服務領域的複合年成長率預計將達到11.6%,反映出市場對客製化模型調優、監管報告和自訂資料整合的需求。客戶擴大將強化學習策略校準和交易後場所分析等專業任務外包給兼具金融工程和特定領域人工智慧技能的專業顧問。
服務業的興起源自於規則的快速變化,需要持續不斷的重新編碼。缺乏內部量化能力的公司依賴諮詢團隊來維護程式碼庫、檢驗模型風險、審核可解釋性等等。隨著向雲端原生管道的轉變,同時具備DevOps和交易邏輯專業知識的服務公司正在獲得更廣泛的收入來源。
演算法交易市場按交易者類型(機構、零售、長期、短期)、組件(解決方案、服務)、部署類型(雲端、本地部署)、組織規模(小型、中型、大型企業)和地區進行細分。市場預測以美元(USD)計價。
區域分析
到2024年,北美將佔全球收入的47.3%。監管透明度的提高、密集的交易所網路以及資產管理公司與技術供應商之間的緊密合作,都為這一成長提供了支撐。美國證券交易委員會(SEC)對《全國市場體系監管條例》(Regulation NMS)的更新提高了透明度標準,並強化了演算法交易作為合規要求的條款。人工智慧驅動的情緒分析已經開始影響大型股的訂單簿,而對中點指標的機器學習研究正在催生新的流動性尋求策略。
亞太地區是最具活力的地區,預計到2030年將以12.4%的複合年成長率成長。日本成熟的證券交易所基礎設施支援皮秒交易實驗,而中國則在擴張的同時提高高頻交易費用,旨在抑制過度交易。東南亞的加密貨幣交易所正在輸出標準化應用程式介面(API),將數位資產流動性與股票和外匯交易流程整合。印度監管機構正在製定指導方針,在維持系統性保障措施的前提下,向更廣泛的零售用戶開放演算法交易。
由於MiFID II的實施,歐洲正處於關鍵地位。嚴格的透明度和熔斷機制要求推動了對審核程式碼的需求。被動投資資金流主導交易量,迫使服務提供者改進指數再平衡演算法以減少追蹤誤差。歐洲中央銀行(ECB)的穩定性評估報告警告稱,隨著自動資金流的退出,高估值可能會加劇風險,凸顯了情境測試的必要性。中東和非洲的多交易商外匯交易平台正開始彌合歷史性的流動性缺口,系統性基金正在部署先前難以企及的交叉貨幣利差。
其他福利:
- Excel格式的市場預測(ME)表
- 3個月的分析師支持
目錄
第1章 引言
- 研究假設和市場定義
- 調查範圍
第2章調查方法
第3章執行摘要
第4章 市場情勢
- 市場概覽
- 市場促進因素
- 美國和日本股票市場對亞毫秒訂單執行的需求日益成長
- 被動投資餘額激增推動歐洲指數再平衡演算法的發展
- 擴大東南亞加密貨幣交易所API流動性池
- 透過中東和非洲的多交易商平台整合分散的外匯流動性
- 人工智慧主導的情緒資訊來源(另類數據)在美國大型股票交易中的普及
- 加強最佳執行的監管(MiFID II、SEC Reg NMS現代化)
- 市場限制
- 交易所託管成本不斷上漲,對中型自營交易平台帶來壓力。
- 「閃崩」期間流動性瞬間喪失
- 歐盟對高頻交易欺騙行為處以嚴厲的市場監管罰款
- 新興交易所資料饋送的延遲差異
- 監理展望
- 波特五力分析
- 供應商的議價能力
- 買方/投資者的議價能力
- 新進入者的威脅
- 替代品的威脅
- 競爭對手之間的競爭
- 技術概覽
- 演算法交易策略
- 動量交易
- 套利
- 趨勢追蹤
- 執行導向型策略
- 情緒分析
- 指數型基金再平衡
- 基於數學模型
- 其他策略
- 演算法交易策略
- 宏觀經濟因素如何影響市場
第5章 市場規模與成長預測
- 按交易者類型
- 機構投資者
- 散戶投資者
- 長期交易者
- 短期交易者
- 按組件
- 解決方案
- 平台
- 軟體工具
- 服務
- 解決方案
- 透過部署
- 雲
- 本地部署
- 按公司規模
- 小型企業
- 主要企業
- 按地區
- 北美洲
- 美國
- 加拿大
- 墨西哥
- 南美洲
- 巴西
- 阿根廷
- 智利
- 秘魯
- 其他南美洲
- 歐洲
- 德國
- 英國
- 法國
- 義大利
- 西班牙
- 其他歐洲地區
- 亞太地區
- 中國
- 日本
- 韓國
- 印度
- 澳洲
- 紐西蘭
- 亞太其他地區
- 中東和非洲
- 阿拉伯聯合大公國
- 沙烏地阿拉伯
- 土耳其
- 南非
- 其他中東和非洲地區
- 北美洲
第6章 競爭情勢
- 策略發展
- 供應商定位分析
- 公司簡介
- Thomson Reuters Corp.
- Refinitiv Ltd
- Virtu Financial Inc.
- Jump Trading LLC
- Citadel Securities LLC
- Hudson River Trading LLC
- Tower Research Capital LLC
- XTX Markets Ltd
- Goldman Sachs Group Inc.
- JPMorgan Chase and Co.
- IG Group Holdings plc
- 63 Moons Technologies Ltd
- MetaQuotes Software Corp.
- Symphony Fintech Solutions Pvt Ltd
- InfoReach Inc.
- AlgoTrader AG
- ARGO SE
- Kuberre Systems Inc.
- KCG Holdings LLC
- DRW Holdings LLC
第7章 市場機會與未來展望
The algorithmic trading market size is estimated at USD 18.73 billion in 2025 and is forecast to reach USD 28.44 billion by 2030, expanding at an 8.71% CAGR.
Uptake is accelerating as artificial-intelligence techniques boost execution quality and allow traders to cope with volatile conditions. Exchanges in North America lead innovation, while robust demand from Asia-Pacific widens the addressable user base. Institutional desks still anchor volumes, yet retail access to low-code automation is reshaping competitive dynamics. Services linked to model design and compliance are outpacing platform revenues, counterbalancing heavier spending on secure on-premise infrastructure. At the same time, cloud latency is falling fast enough to tempt smaller firms that once sat on the sidelines.
Global Algorithmic Trading Market Trends and Insights
Rising demand for sub-millisecond order execution
Latency competition has moved from microseconds to picoseconds in US and Japanese equities. Firms deploy field-programmable gate arrays and bespoke fibre routes to shave time, aiming to capture part of the USD 5 billion global value tied to latency arbitrage each year . Litigation over patent rights underscores the strategic value of speed. Capital-intensive upgrades, however, tilt the advantages toward well-funded players and may heighten market concentration.
Surging passive-investment AUM fuelling index-rebalance algos
Global ETF assets touched USD 13.8 trillion in 2024 . Rebalancing flows trigger large, time-compressed orders that demand sophisticated algorithmic execution able to track benchmark weights without moving prices. Europe's share of passive UCITS funds more than doubled over the past decade, intensifying the need for cross-asset models that minimise market impact while coping with complex correlations.
Rising exchange colocation costs squeezing mid-tier desks
Fee hikes such as the increase to USD 13,500 per month for 10 Gb ULL fibre at MIAX PEARL weigh on balance sheets and may force mid-sized proprietary shops to scale back. High entry costs protect incumbents but thin the competitive field, potentially reducing spread tightness in less-traded instruments.
Other drivers and restraints analyzed in the detailed report include:
- Expansion of crypto-exchange API liquidity pools
- Regulatory push for best-execution
- Instant loss of liquidity during flash-crash events
For complete list of drivers and restraints, kindly check the Table Of Contents.
Segment Analysis
Institutional investors commanded 61% of the algorithmic trading market in 2024, anchored by deep capital and infrastructure. Retail traders, however, are growing fastest at a 10.8% CAGR as easy-to-use platforms replicate institutional toolkits. Brokerage portals now bundle strategy builders, order-routing algos, and back-testing libraries, lowering technical barriers. Educational initiatives reinforce adoption by boosting trust and demystifying automation. Regulatory bodies remain vigilant to ensure adequate safeguards for non-professional users.
Retail participation injects fresh order flow and fosters competitive quoting. Yet heavier retail turnover also magnifies the need for robust risk controls because crowd-sourced models can unintentionally converge. Brokerage analytics show rising preference for short-cycle strategies that exploit intraday micro-structure, often mirroring institutional scalping tactics. Over time, the influx of retail volumes can dilute traditional desk advantages in certain liquidity pockets.
Solutions captured 73.5% of the algorithmic trading market share in 2024, bundling execution engines, analytics dashboards, and connectivity adapters. Still, the services segment is on an 11.6% CAGR trajectory, reflecting appetite for bespoke model tuning, regulatory reporting, and custom data integration. Clients increasingly outsource niche tasks such as reinforcement-learning policy calibration or post-trade venue analysis to specialist consultants, who combine financial engineering with domain-specific AI skills.
The rise in services is reinforced by rapid rule changes that require continual recoding. Firms lacking in-house quant bandwidth lean on advisory teams to maintain code bases, validate model risk, and conduct explainability audits. Coupled with the shift to cloud-native pipelines, service firms that master both DevOps and trading logic find a widening revenue pool.
Algorithmic Trading Market is Segmented by Types of Traders (Institutional Investors, Retail Investors, Long-Term Traders, Short-Term Traders), Component (Solutions, Services), Deployment (Cloud, On-Premise), Organisation Size (Small and Medium Enterprises, Large Enterprises), Geography. The Market Forecasts are Provided in Terms of Value (USD).
Geography Analysis
North America contributed 47.3% of global turnover in 2024. Regulatory clarity, a dense exchange network, and close integration between asset managers and technology vendors sustain growth. The SEC's update to Regulation NMS raises transparency standards, reinforcing algorithmic execution as a compliance necessity. AI-based sentiment analytics already influence large-cap order books, while research into machine-learning midpoint indicators fosters novel liquidity-seeking strategies.
Asia-Pacific delivers the strongest momentum, projected at a 12.4% CAGR through 2030. Japan's mature equity venue infrastructure supports picosecond experimentation, whereas China balances expansion with higher HFT fees aimed at curbing excess churn. South-East Asian crypto venues export standardised APIs, blending digital-asset liquidity with equities and FX workflows. India's regulator is drafting guidelines to open algorithmic trading to a broader retail base while preserving systemic safeguards.
Europe occupies a pivotal position shaped by MiFID II. Stringent transparency and circuit-breaker obligations heighten demand for auditable code. Passive-investment flows dominate turnover, pushing providers to refine index-rebalance algos that mitigate tracking error. The European Central Bank's stability review warns that high valuations could amplify risks when automated flows unwind, underscoring the need for scenario testing . Multi-dealer FX portals in the Middle East and Africa begin to close historical liquidity gaps, inviting systematic funds to deploy cross-currency spreads previously deemed infeasible.
- Thomson Reuters Corp.
- Refinitiv Ltd
- Virtu Financial Inc.
- Jump Trading LLC
- Citadel Securities LLC
- Hudson River Trading LLC
- Tower Research Capital LLC
- XTX Markets Ltd
- Goldman Sachs Group Inc.
- JPMorgan Chase and Co.
- IG Group Holdings plc
- 63 Moons Technologies Ltd
- MetaQuotes Software Corp.
- Symphony Fintech Solutions Pvt Ltd
- InfoReach Inc.
- AlgoTrader AG
- ARGO SE
- Kuberre Systems Inc.
- KCG Holdings LLC
- DRW Holdings LLC
Additional Benefits:
- The market estimate (ME) sheet in Excel format
- 3 months of analyst support
TABLE OF CONTENTS
1 INTRODUCTION
- 1.1 Study Assumptions and Market Definition
- 1.2 Scope of the Study
2 RESEARCH METHODOLOGY
3 EXECUTIVE SUMMARY
4 MARKET LANDSCAPE
- 4.1 Market Overview
- 4.2 Market Drivers
- 4.2.1 Rising demand for sub-millisecond order execution across US and Japanese equity venues
- 4.2.2 Surging passive-investment AUM fuelling index-rebalance algos in Europe
- 4.2.3 Expansion of crypto-exchange API liquidity pools in South-East Asia
- 4.2.4 Consolidation of fragmented FX liquidity via multi-dealer platforms in ME and Africa
- 4.2.5 Proliferation of AI-driven sentiment feeds (alt-data) in US large-cap trading
- 4.2.6 Regulatory push for best-execution (MiFID II, SEC Reg NMS modernisation)
- 4.3 Market Restraints
- 4.3.1 Rising exchange colocation costs squeezing mid-tier prop desks
- 4.3.2 Instant loss of liquidity during "flash-crash" events
- 4.3.3 Stringent market-surveillance fines on HFT spoofing in EU
- 4.3.4 Data-feed latency differentials in emerging exchanges
- 4.4 Regulatory Outlook
- 4.5 Porter's Five Forces Analysis
- 4.5.1 Bargaining Power of Suppliers
- 4.5.2 Bargaining Power of Buyers / Investors
- 4.5.3 Threat of New Entrants
- 4.5.4 Threat of Substitutes
- 4.5.5 Intensity of Competitive Rivalry
- 4.6 Technology Snapshot
- 4.6.1 Algorithmic Trading Strategies
- 4.6.1.1 Momentum Trading
- 4.6.1.2 Arbitrage Trading
- 4.6.1.3 Trend Following
- 4.6.1.4 Execution-based Strategies
- 4.6.1.5 Sentiment Analysis
- 4.6.1.6 Index-fund Rebalancing
- 4.6.1.7 Mathematical-model-based
- 4.6.1.8 Other Strategies
- 4.6.1 Algorithmic Trading Strategies
- 4.7 Impact of Macroeconomic Factors on the Market
5 MARKET SIZE AND GROWTH FORECASTS (VALUE)
- 5.1 By Types of Traders
- 5.1.1 Institutional Investors
- 5.1.2 Retail Investors
- 5.1.3 Long-term Traders
- 5.1.4 Short-term Traders
- 5.2 By Component
- 5.2.1 Solutions
- 5.2.1.1 Platforms
- 5.2.1.2 Software Tools
- 5.2.2 Services
- 5.2.1 Solutions
- 5.3 By Deployment
- 5.3.1 Cloud
- 5.3.2 On-premise
- 5.4 By Organisation Size
- 5.4.1 Small and Medium Enterprises
- 5.4.2 Large Enterprises
- 5.5 By Geography
- 5.5.1 North America
- 5.5.1.1 United States
- 5.5.1.2 Canada
- 5.5.1.3 Mexico
- 5.5.2 South America
- 5.5.2.1 Brazil
- 5.5.2.2 Argentina
- 5.5.2.3 Chile
- 5.5.2.4 Peru
- 5.5.2.5 Rest of South America
- 5.5.3 Europe
- 5.5.3.1 Germany
- 5.5.3.2 United Kingdom
- 5.5.3.3 France
- 5.5.3.4 Italy
- 5.5.3.5 Spain
- 5.5.3.6 Rest of Europe
- 5.5.4 Asia-Pacific
- 5.5.4.1 China
- 5.5.4.2 Japan
- 5.5.4.3 South Korea
- 5.5.4.4 India
- 5.5.4.5 Australia
- 5.5.4.6 New Zealand
- 5.5.4.7 Rest of Asia-Pacific
- 5.5.5 Middle East and Africa
- 5.5.5.1 United Arab Emirates
- 5.5.5.2 Saudi Arabia
- 5.5.5.3 Turkey
- 5.5.5.4 South Africa
- 5.5.5.5 Rest of Middle East and Africa
- 5.5.1 North America
6 COMPETITIVE LANDSCAPE
- 6.1 Strategic Developments
- 6.2 Vendor Positioning Analysis
- 6.3 Company Profiles (includes Global level Overview, Market level overview, Core Segments, Financials as available, Strategic Information, Products and Services, and Recent Developments)
- 6.3.1 Thomson Reuters Corp.
- 6.3.2 Refinitiv Ltd
- 6.3.3 Virtu Financial Inc.
- 6.3.4 Jump Trading LLC
- 6.3.5 Citadel Securities LLC
- 6.3.6 Hudson River Trading LLC
- 6.3.7 Tower Research Capital LLC
- 6.3.8 XTX Markets Ltd
- 6.3.9 Goldman Sachs Group Inc.
- 6.3.10 JPMorgan Chase and Co.
- 6.3.11 IG Group Holdings plc
- 6.3.12 63 Moons Technologies Ltd
- 6.3.13 MetaQuotes Software Corp.
- 6.3.14 Symphony Fintech Solutions Pvt Ltd
- 6.3.15 InfoReach Inc.
- 6.3.16 AlgoTrader AG
- 6.3.17 ARGO SE
- 6.3.18 Kuberre Systems Inc.
- 6.3.19 KCG Holdings LLC
- 6.3.20 DRW Holdings LLC
7 MARKET OPPORTUNITIES AND FUTURE OUTLOOK
- 7.1 White-space and Unmet-need Assessment
 2026-2030年全球演算法交易市場
 全球演算法交易市場規模、佔有率、趨勢和成長分析報告(2026-2034)
 演算法交易市場規模、佔有率、趨勢和預測:按交易類型、組成部分、部署模式、組織規模和地區分類,2026-2034 年
 演算法交易市場分析及至2035年預測:按類型、產品類型、服務、技術、組件、應用、部署類型、最終用戶、功能及解決方案分類演算法交易市場規模、佔有率、成長及全球產業分析:按類型、應用和地區分類,並預測至2026-2034年
 金融交易軟體市場:按解決方案、資產類別、部署方式、組織規模和最終用戶分類,全球預測(2026-2032 年)
 演算法交易市場規模、佔有率和成長分析(按組件、公司規模、類型、部署類型、最終用戶和地區分類)—產業預測(2026-2033 年)演算法交易市場-2025-2030年預測全球演算法交易市場(按組件、部署、交易模型、應用程式和最終用戶分類)—2025-2032 年全球預測
 2025年全球演算法交易軟體市場報告