


 |
市場調查報告書
商品編碼
1851046
進階分析:市場佔有率分析、產業趨勢、統計數據、成長預測(2025-2030 年)Advanced Analytics - Market Share Analysis, Industry Trends & Statistics, Growth Forecasts (2025 - 2030) |
||||||
※ 本網頁內容可能與最新版本有所差異。詳細情況請與我們聯繫。
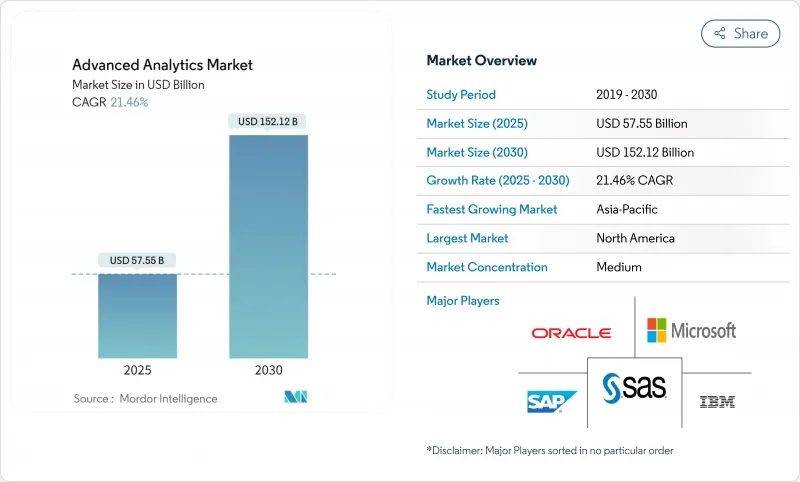
預計到 2025 年,高階分析市場規模將達到 575.5 億美元,到 2030 年將達到 1,522.2 億美元,複合年成長率為 21.46%。
資料量快速成長、人工智慧基礎設施成本下降以及對即時決策支援的迫切需求,持續推動各產業採用人工智慧技術。欺詐手段的日益複雜化加速了對預測分析、風險分析和圖分析的需求,而平台整合則降低了客戶轉換成本,並推動了多功能應用。邊緣處理如今對於延遲敏感型應用場景(例如自主系統和工業自動化)至關重要,其對邊緣分析成長的推動作用超過了其他領域。同時,歐盟可解釋人工智慧法規正引導投資流向透明且審核的模型,為合規供應商提供了先發優勢。
全球高階分析市場趨勢與洞察
對詐欺偵測的需求日益成長
金融機構面臨日益複雜的詐欺威脅,這些威脅已經超越了基於規則的系統所能應對的範圍。美國監管機構正在鼓勵使用人工智慧驅動的監控,機器學習模型已經將偵測準確率提高了40%,同時將誤報率降低了一半。 IBM的一項研究發現,幾乎即時分析大量交易資料可以達到95%的分類準確率。混合雲邊緣架構能夠滿足亞秒延遲的要求,為服務供應商創造了將詐欺分析、合規儀表板和模型管治整合到一個整合平台的機會。
巨量資料規模和複雜性的爆炸性成長
到2024年,企業每天將產生3.2877億TB的數據,這將使傳統商業智慧工具不堪負荷。目前,近一半的企業正在採用混合儲存和資料架構方法來整合孤立的資料來源,並拓展到高階分析市場。預計到2025年,超過50%的關鍵處理將在傳統資料中心之外進行,這將推動對自動化資料準備和增強型分析的需求,以便為非技術業務用戶提供洞察。
數據整合和連接差距
碎片化的架構常常導致資料分散在老舊的本地部署、雲端和操作技術系統中。企業64%的工程時間都花在整合而非分析上,這不僅降低了投資回報,也削弱了企業對大型計劃的熱情。工業企業也面臨專有通訊協定的困擾,這些協定使分析整合變得複雜,凸顯了資料架構和無程式碼整合解決方案的重要性。
細分市場分析
邊緣分析預計到2030年將以28.70%的複合年成長率成長,這反映了其在對延遲要求極高的物聯網場景中的重要作用。相較之下,預測分析到2024年將維持24.22%的市場佔有率,在預測期內佔據主導地位。邊緣設備執行本地推理,從而降低網路成本並確保資料主權。汽車、能源和製造業正在採用微型推理晶片來實現異常檢測和自主控制迴路。供應商正透過聯邦學習功能來凸顯自身優勢,該功能無需暴露原始資料即可訓練全局模型。在非結構化資料量呈指數級成長的情況下,文字和視覺化分析將保持穩定的應用,而規範性分析和風險分析將受到最佳化和場景建模需求的驅動。
隨著5G的廣泛應用,邊緣高級分析的市場規模預計將迅速擴大。關鍵基礎設施所有者正從集中式雲端轉向分散式網狀網路,將決策邏輯推送至渦輪機、變電站和車輛等設備。同時,現有的預測平台正在整合即時資料流以避免過時,這預示著市場正向混合雲邊緣架構轉變。
到2024年,銀行和公共部門機構青睞的本地部署架構將佔總收入的54%。然而,隨著企業尋求彈性擴展和計量型的經濟模式,雲端運算的採用率正以24.80%的複合年成長率成長。儘管超大規模資料中心營運商優先擴展其GPU集群,但間歇性的容量短缺為專注於分析的雲端和混合型託管邊緣部署創造了空間。
安全性和保密運算服務的提升正逐步降低客戶的抵觸情緒。可自動偵測漂移、版本控制和管治的託管模型維運套件進一步擴大了雲端工作負載高階分析的市場規模。混合方案將敏感的本地資料處理與突發式雲端訓練週期結合,既確保了合規性,又不阻礙創新。區域資料居住法正在影響服務提供者的架構佈局,尤其是在歐盟和亞太地區,這些地區的國家區域法規旨在解決隱私問題。
區域分析
預計到2024年,北美將佔高級分析市場收入的41%。創業投資投入1,091億美元,其中339億美元用於產生模型、拓展新興企業生態系統以及企業實驗。美國超大規模資料中心營運商正透過部署新的GPU叢集來解決先前的容量限制問題,亞馬遜在賓州投資200億美元的擴建計畫就充分體現了其投資規模。監管舉措眾多但仍分散,因此需要能夠解讀聯邦和州級不同要求的管治附加元件。
亞太地區以23.10%的複合年成長率領先,主要得益於製造業自動化、5G網路部署和政府智慧城市津貼。中國人工智慧模式的強化催生了具有競爭力的國內替代方案,而印度的IT服務出口則為區域製造商提供了實施人才。日本和韓國致力於將邊緣分析技術應用於工業機器人和自動駕駛領域。隨著東南亞國家整合電子商務、金融科技和物流平台,整體擁有成本的下降和公共部門數位化政策的推進將推動東南亞國家高階分析市場的發展。
在嚴格且不斷發展的政策框架下,歐洲將保持穩定成長。歐盟人工智慧立法將加速可解釋平台的普及,以滿足透明度規則,尤其是在關鍵領域。德國汽車和機械公司正在採用預測性和規範性分析來實現工業4.0,而北歐公用事業公司則正在整合永續性分析以最佳化再生能源的使用。英國金融機構正在脫歐後加大對風險模型管治的投入。歐洲高級分析市場的規模正受益於跨國資料空間計劃,該計劃協調了成員國之間的共用標準,但合規工作量正在延長引進週期。
其他福利:
- Excel格式的市場預測(ME)表
- 3個月的分析師支持
目錄
第1章 引言
- 研究假設和市場定義
- 調查範圍
第2章調查方法
第3章執行摘要
第4章 市場情勢
- 市場概覽
- 市場促進因素
- 對詐欺偵測的需求日益成長
- 巨量資料規模和複雜性的爆炸性成長
- 企業數位轉型浪潮
- 人工智慧/機器學習和雲端運算成本迅速下降
- 用於即時決策的邊緣分析
- 概述:人工智慧監管可能收緊
- 市場限制
- 數據整合和連接差距
- 資料科學人才短缺
- 計算能源永續性極限
- 供應商鎖定導致超大規模雲
- 價值/供應鏈分析
- 監管環境
- 技術展望
- 波特五力分析
- 供應商的議價能力
- 消費者議價能力
- 新進入者的威脅
- 替代品的威脅
- 競爭對手之間的競爭
第5章 市場規模與成長預測
- 按類型
- 統計分析
- 文字分析
- 風險分析
- 預測分析
- 指示性分析
- 視覺化分析
- 網路分析
- 地理空間分析
- 社群媒體分析
- 邊緣分析
- 其他類型
- 透過部署模式
- 本地部署
- 雲
- 混合
- 按組件
- 解決方案
- 服務
- 諮詢
- 託管服務
- 按業務職能
- 銷售與行銷
- 金融與風險
- 營運和供應鏈
- 人力資源
- 客戶支援
- 按最終用戶行業分類
- BFSI
- 零售和消費品
- 醫療保健和生命科學
- 資訊科技/通訊
- 運輸與物流
- 政府和國防部
- 製造業
- 能源與公共產業
- 媒體與娛樂
- 其他行業
- 按組織規模
- 主要企業
- 中小企業
- 按地區
- 北美洲
- 美國
- 加拿大
- 墨西哥
- 南美洲
- 巴西
- 阿根廷
- 其他南美洲
- 歐洲
- 英國
- 德國
- 法國
- 義大利
- 其他歐洲地區
- 亞太地區
- 中國
- 日本
- 印度
- 韓國
- 亞太其他地區
- 中東
- 以色列
- 沙烏地阿拉伯
- 阿拉伯聯合大公國
- 土耳其
- 其他中東地區
- 非洲
- 南非
- 埃及
- 其他非洲地區
- 北美洲
第6章 競爭情勢
- 市場集中度
- 策略趨勢
- 市佔率分析
- 公司簡介
- IBM Corporation
- Microsoft Corporation
- SAS Institute Inc.
- SAP SE
- Oracle Corporation
- Amazon Web Services(AWS)
- Google LLC
- Salesforce Inc.(Tableau)
- Teradata Corporation
- QlikTech International AB
- MicroStrategy Incorporated
- Alteryx Inc.
- KNIME AG
- RapidMiner Inc.
- TIBCO Software Inc.
- Altair Engineering Inc.
- Sisense Inc.
- Domo Inc.
- Fair Isaac Corporation(FICO)
- Avanade Inc.
第7章 市場機會與未來展望
The advanced analytics market stands at USD 57.55 billion in 2025 and is forecast to reach USD 152.22 billion by 2030, reflecting a 21.46% CAGR.
Surging data volumes, falling AI infrastructure costs, and urgent requirements for real-time decision support continue to expand adoption across industries. Rising fraud sophistication is accelerating demand for predictive, risk, and graph analytics, while platform consolidation is reducing customer switching costs and encouraging multi-function deployments. Edge processing is now critical for latency-sensitive use cases such as autonomous systems and industrial automation, lifting edge-analytics growth ahead of other segments. Simultaneously, explainable AI regulation in the EU is redirecting investment toward transparent, auditable models, granting compliant vendors an early-mover advantage.
Global Advanced Analytics Market Trends and Insights
Escalating Fraud-Detection Needs
Financial institutions face highly sophisticated fraud threats that outpace rule-based systems. U.S. regulators urge AI-driven monitoring, and machine-learning models already lift detection accuracy by 40% while halving false positives. IBM research shows 95% classification accuracy when large-scale transaction data is analysed in near real time. Hybrid cloud-edge architectures satisfy sub-second latency requirements and create opportunities for providers bundling fraud analytics, compliance dashboards, and model governance into unified platforms.
Big-Data Volume & Complexity Explosion
Enterprises generated 328.77 million TB daily in 2024, overwhelming traditional BI tooling. Nearly half now employ hybrid storage and data-fabric approaches to integrate siloed sources for advanced analytics market deployments. By 2025, more than 50% of critical processing is expected outside conventional data centers, reinforcing the need for automated data preparation and augmented analytics that expose insights to non-technical business users.
Data Integration & Connectivity Gaps
Fragmented architectures often trap data across aging on-premises, cloud, and operational-technology systems. Organizations allocate 64% of engineering time to integration rather than analysis, delaying returns and dampening enthusiasm for large-scale projects. Industrial firms battle proprietary protocols that complicate analytics linkages, reinforcing the premium placed on data-fabric and no-code integration solutions.
Other drivers and restraints analyzed in the detailed report include:
- Enterprise Digital-Transformation Wave
- Regulatory Push for Explainable AI
- Shortage of Data-Science Talent
For complete list of drivers and restraints, kindly check the Table Of Contents.
Segment Analysis
Edge Analytics owns a 28.70% CAGR to 2030, reflecting its role in latency-critical IoT scenarios. In contrast, Predictive Analytics retained 24.22% advanced analytics market share in 2024 as the mainstream choice for forecasting. Edge devices perform localized inference, cutting network costs and ensuring data sovereignty, which is vital for regulated verticals. Automotive, energy, and manufacturing players are embedding compact inference chips to enable anomaly detection and autonomous control loops. Vendors differentiate through federated-learning capabilities that train global models without raw-data egress. Text and Visual Analytics hold steady adoption as unstructured data volumes balloon, while Prescriptive and Risk Analytics are spurred by demand for optimization and scenario modelling.
The advanced analytics market size for Edge Analytics is poised to expand rapidly as 5G coverage broadens. Critical infrastructure owners shift from centralized clouds to distributed mesh fabrics that push decision logic to turbines, substations, and vehicles. Meanwhile, established predictive platforms are integrating real-time data streams to avoid obsolescence, illustrating the market's pivot toward hybrid cloud-edge designs
On-Premises architectures, favored by banks and public agencies, accounted for 54% revenue in 2024 largely due to data-sovereignty mandates. Still, Cloud deployment is rising at 24.80% CAGR as enterprises pursue elastic scaling and pay-as-you-go economics. Hyperscalers prioritize GPU fleet expansion, though intermittent capacity shortfalls create openings for specialized analytics clouds and colocation-edge hybrids.
Security improvements and confidential-compute services steadily erode customer objections. The advanced analytics market size for cloud workloads gains further lift from managed model-ops suites that automate drift detection, versioning, and governance. Hybrid scenarios blend sensitive on-premises data processing with burst-to-cloud training cycles, ensuring compliance without capping innovation. Regional data-residency laws now shape provider buildouts, particularly in the EU and APAC, where in-country zones address privacy statutes.
The Advanced Analytics Market is Segmented by Type (Statistical Analysis, Text Analytics, and More), Deployment Mode (On-Premises, Cloud, Hybrid), Component (Solutions and Services), Business Function (Sales & Marketing, Finance & Risk, and More), End-User Industry, Organization Size (Large Enterprises, Smes), and Geography. The Market Forecasts are Provided in Terms of Value (USD).
Geography Analysis
North America continued to command 41% of advanced analytics market revenue in 2024. Venture capital channelled USD 109.1 billion into AI, including USD 33.9 billion for generative models, expanding startup ecosystems and enterprise experimentation. U.S. hyperscalers address prior capacity constraints by injecting new GPU clusters, with Amazon's USD 20 billion Pennsylvania build-out illustrating the scale of investment. Regulatory initiatives, though numerous, remain fragmented, prompting demand for governance add-ons that interpret divergent federal and state requirements.
APAC posts the highest 23.10% CAGR, propelled by manufacturing automation, 5G rollouts, and government smart-city grants. Chinese AI-model enhancements create competitive domestic alternatives, while India's IT-services exports deliver implementation talent to regional manufacturers. Japan and South Korea push deep into edge-analytics applications for industrial robotics and autonomous mobility. Lower total-cost-of-ownership and public-sector digitalization policies expand the advanced analytics market across Southeast Asian nations integrating ecommerce, fintech, and logistics platforms.
Europe grows steadily under rigorously evolving policy. The EU AI Act accelerates purchases of explainable platforms to satisfy transparency rules, especially in critical sectors. Germany's automotive and machinery firms adopt predictive and prescriptive analytics for Industry 4.0, while Nordic utilities embed sustainability analytics to optimize renewables. United Kingdom financial institutions invest in risk-model governance post-Brexit. The advanced analytics market size in Europe benefits from cross-border data-space initiatives that harmonize sharing standards among member states, yet compliance workloads elongate deployment cycles.
- IBM Corporation
- Microsoft Corporation
- SAS Institute Inc.
- SAP SE
- Oracle Corporation
- Amazon Web Services (AWS)
- Google LLC
- Salesforce Inc. (Tableau)
- Teradata Corporation
- QlikTech International AB
- MicroStrategy Incorporated
- Alteryx Inc.
- KNIME AG
- RapidMiner Inc.
- TIBCO Software Inc.
- Altair Engineering Inc.
- Sisense Inc.
- Domo Inc.
- Fair Isaac Corporation (FICO)
- Avanade Inc.
Additional Benefits:
- The market estimate (ME) sheet in Excel format
- 3 months of analyst support
TABLE OF CONTENTS
1 INTRODUCTION
- 1.1 Study Assumptions and Market Definition
- 1.2 Scope of the Study
2 RESEARCH METHODOLOGY
3 EXECUTIVE SUMMARY
4 MARKET LANDSCAPE
- 4.1 Market Overview
- 4.2 Market Drivers
- 4.2.1 Escalating fraud-detection needs
- 4.2.2 Big-data volume and complexity explosion
- 4.2.3 Enterprise digital-transformation wave
- 4.2.4 Rapid AI/ML and cloud cost declines
- 4.2.5 Edge analytics for real-time decisions
- 4.2.6 Regulatory push for explainable AI
- 4.3 Market Restraints
- 4.3.1 Data integration and connectivity gaps
- 4.3.2 Shortage of data-science talent
- 4.3.3 Sustainability limits on compute energy
- 4.3.4 Vendor lock-in to hyperscale clouds
- 4.4 Value / Supply-Chain Analysis
- 4.5 Regulatory Landscape
- 4.6 Technological Outlook
- 4.7 Porter's Five Forces Analysis
- 4.7.1 Bargaining Power of Suppliers
- 4.7.2 Bargaining Power of Consumers
- 4.7.3 Threat of New Entrants
- 4.7.4 Threat of Substitutes
- 4.7.5 Intensity of Competitive Rivalry
5 MARKET SIZE AND GROWTH FORECASTS (VALUE)
- 5.1 By Type
- 5.1.1 Statistical Analysis
- 5.1.2 Text Analytics
- 5.1.3 Risk Analytics
- 5.1.4 Predictive Analytics
- 5.1.5 Prescriptive Analytics
- 5.1.6 Visual Analytics
- 5.1.7 Network Analytics
- 5.1.8 Geospatial Analytics
- 5.1.9 Social Media Analytics
- 5.1.10 Edge Analytics
- 5.1.11 Other Types
- 5.2 By Deployment Mode
- 5.2.1 On-Premise
- 5.2.2 Cloud
- 5.2.3 Hybrid
- 5.3 By Component
- 5.3.1 Solutions
- 5.3.2 Services
- 5.3.2.1 Consulting
- 5.3.2.2 Managed Services
- 5.4 By Business Function
- 5.4.1 Sales and Marketing
- 5.4.2 Finance and Risk
- 5.4.3 Operations and Supply-Chain
- 5.4.4 Human Resources
- 5.4.5 Customer Support
- 5.5 By End-User Industry
- 5.5.1 BFSI
- 5.5.2 Retail and Consumer Goods
- 5.5.3 Healthcare and Life Sciences
- 5.5.4 IT and Telecommunication
- 5.5.5 Transportation and Logistics
- 5.5.6 Government and Defense
- 5.5.7 Manufacturing
- 5.5.8 Energy and Utilities
- 5.5.9 Media and Entertainment
- 5.5.10 Other Industries
- 5.6 By Organization Size
- 5.6.1 Large Enterprises
- 5.6.2 Small and Mid-Sized Enterprises (SMEs)
- 5.7 By Geography
- 5.7.1 North America
- 5.7.1.1 United States
- 5.7.1.2 Canada
- 5.7.1.3 Mexico
- 5.7.2 South America
- 5.7.2.1 Brazil
- 5.7.2.2 Argentina
- 5.7.2.3 Rest of South America
- 5.7.3 Europe
- 5.7.3.1 United Kingdom
- 5.7.3.2 Germany
- 5.7.3.3 France
- 5.7.3.4 Italy
- 5.7.3.5 Rest of Europe
- 5.7.4 Asia-Pacific
- 5.7.4.1 China
- 5.7.4.2 Japan
- 5.7.4.3 India
- 5.7.4.4 South Korea
- 5.7.4.5 Rest of Asia-Pacific
- 5.7.5 Middle East
- 5.7.5.1 Israel
- 5.7.5.2 Saudi Arabia
- 5.7.5.3 United Arab Emirates
- 5.7.5.4 Turkey
- 5.7.5.5 Rest of Middle East
- 5.7.6 Africa
- 5.7.6.1 South Africa
- 5.7.6.2 Egypt
- 5.7.6.3 Rest of Africa
- 5.7.1 North America
6 COMPETITIVE LANDSCAPE
- 6.1 Market Concentration
- 6.2 Strategic Moves
- 6.3 Market Share Analysis
- 6.4 Company Profiles (includes Global level Overview, Market level overview, Core Segments, Financials as available, Strategic Information, Market Rank/Share for key companies, Products and Services, and Recent Developments)
- 6.4.1 IBM Corporation
- 6.4.2 Microsoft Corporation
- 6.4.3 SAS Institute Inc.
- 6.4.4 SAP SE
- 6.4.5 Oracle Corporation
- 6.4.6 Amazon Web Services (AWS)
- 6.4.7 Google LLC
- 6.4.8 Salesforce Inc. (Tableau)
- 6.4.9 Teradata Corporation
- 6.4.10 QlikTech International AB
- 6.4.11 MicroStrategy Incorporated
- 6.4.12 Alteryx Inc.
- 6.4.13 KNIME AG
- 6.4.14 RapidMiner Inc.
- 6.4.15 TIBCO Software Inc.
- 6.4.16 Altair Engineering Inc.
- 6.4.17 Sisense Inc.
- 6.4.18 Domo Inc.
- 6.4.19 Fair Isaac Corporation (FICO)
- 6.4.20 Avanade Inc.
7 MARKET OPPORTUNITIES AND FUTURE OUTLOOK
- 7.1 White-space and Unmet-Need Assessment
 進階分析市場規模、佔有率、趨勢和預測:按組件、類型、部署模式、業務功能、企業規模、行業和地區分類,2026-2034 年
 高階分析市場:按組件、分析類型、部署模式和產業分類-2026年至2032年全球市場預測
 2026-2030年全球水風險情報軟體市場
 2026年全球高階分析市場報告
 進階分析市場分析及預測(至 2035 年):按類型、產品、服務、技術、組件、應用、部署、最終用戶、功能和解決方案分類
 全球高階分析市場依產品及交付方式分類-預測至2031年
 全球高階分析市場規模、佔有率、趨勢和成長分析報告(2026-2034年)進階分析市場規模、佔有率、成長及全球產業分析:按類型、應用和地區分類,並提供 2026-2034 年的洞察和預測人工智慧分析:提升客戶體驗產業的決策智慧氣候風險分析與智慧軟體市場:按部署類型、組件、組織規模、應用和最終用戶產業分類的全球預測(2026-2032 年)