


 |
市場調查報告書
商品編碼
1851038
資料品質工具:市場佔有率分析、產業趨勢、統計資料和成長預測(2025-2030 年)Data Quality Tools - Market Share Analysis, Industry Trends & Statistics, Growth Forecasts (2025 - 2030) |
||||||
※ 本網頁內容可能與最新版本有所差異。詳細情況請與我們聯繫。
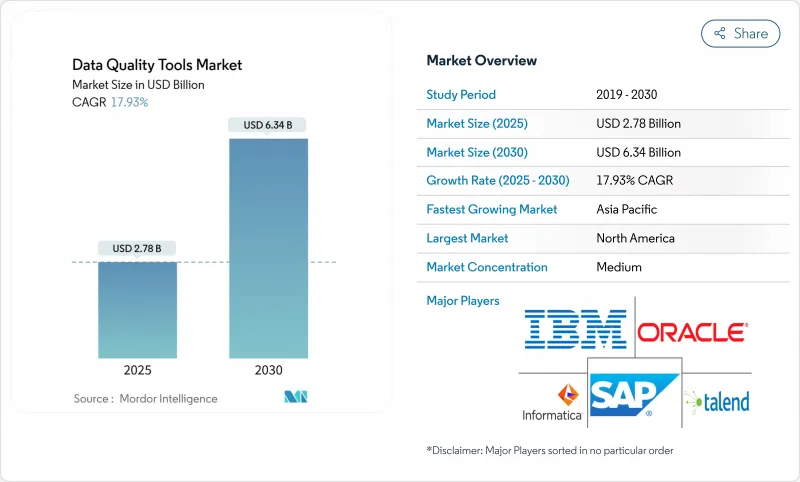
預計到 2025 年,數據品質工具市場規模將達到 27.8 億美元,到 2030 年將達到 63.4 億美元,複合年成長率為 17.93%。
監管審查力度加大、雲端運算快速普及以及即時分析技術的廣泛應用,使得高品質數據成為不可或缺的資產。由於模型準確性取決於乾淨可靠的數據,企業正將數據品質提升與人工智慧應用結合。能夠與資料湖和低程式碼工作流程整合的雲端對應平臺需求最為強勁,有助於緩解專業人才短缺的問題。供應商正將重心轉向自動化異常檢測、預測性資料清洗和特定領域規則,加速銀行、金融服務和保險 (BFSI)、零售和醫療保健等行業的部署。
全球數據品質工具市場趨勢與洞察
核心銀行平台加速向雲端遷移,推動了大規模資料修復計劃。
金融機構在將傳統核心系統遷移到雲端環境時,優先考慮自動化資料修復,以確保貸款和支付流程的線上運作。過去需要四到六個小時人工檢驗的核准房屋抵押貸款核准流程,現在幾乎可以即時完成,從而改善客戶體驗並降低營運風險。雲端原生資料品質引擎強化了資料擷取、分析和人工智慧主導的分析之間的回饋循環,形成一個良性循環:更優質的資料提升雲端投資報酬率,進而增強資料品質預算。
日益增加的ESG報告義務要求公司範圍內的資料品管
美國證券交易委員會的氣候變遷揭露要求、加州的SB-253/SB-261法案以及歐盟的CSRD指令將於2025年1月生效,屆時將對數千家公司產生影響。合規項目目前累計專案預算,用於追溯、檢驗和審核準備等工作。董事會正在將ESG數據不足與聲譽風險聯繫起來,並鼓勵永續性負責人採用能夠追蹤範圍3排放和檢驗供應商聲明的解決方案。
傳統本地資料倉儲遺留的持續性技術債會減緩現代工具的採用。
許多組織每年花費高達 300 萬美元維護老舊的 ETL 作業和專有資料庫。舊模式和現代 API 之間的整合差距減緩了採用速度,迫使金融和醫療保健行業的公司在完全釋放雲端原生品質功能之前,必須按照多年的藍圖逐步升級。
細分市場分析
到2024年,雲端部署將佔資料品質工具市場收入的64%,相當於2025年基準年的約17.8億美元。高達20.23%的複合年成長率表明,對於許多買家而言,擴充性、彈性定價以及接近性雲端資料儲存等因素比安全方面的擔憂更為重要。隨著API驅動的連接器簡化了從SaaS來源和串流平台導入資料的過程,雲端服務上的資料品質工具市場規模將迅速擴大。
在處理敏感的患者、支付和國防數據的行業中,本地部署仍然至關重要。預計到2024年,該領域將佔總營收的36%,目前正致力於增強其混合部署能力,將受監管的工作負載與公共雲端分析結合。醫療服務提供者正在努力平衡本地臨床記錄和在符合HIPAA標準的雲端進行實驗室資料清洗。
到2024年,大型企業將貢獻58%的總收入,這主要得益於其跨越數十個領域的複雜資料資產以及監管義務。許多大型企業都擁有企業管治方案,將資料分析、監控和修復整合到一個通用的控制平台中。大型企業的數據品質工具市場規模穩定,但呈現逐步成長的趨勢。
到2030年,該行業將以19.52%的複合年成長率成長,其中中小企業將是成長的主要驅動力。計量收費、消費積分和模組化包裝將降低准入門檻。一項針對英國製造商的案例研究發現,數據品質的提升加快了產品創新速度,並增強了其競爭優勢。
資料品質工具市場按部署類型(雲端基礎、本地部署)、組織規模(中小企業、大型企業)、元件(軟體、服務)、資料領域(客戶資料、產品資料、其他)、工具類型(資料分析、資料清洗/標準化、其他)、最終使用者產業(銀行、金融服務和保險、政府、其他)以及地區進行細分。市場預測以美元計價。
區域分析
北美地區將在2024年貢獻全球36%的收入,並在2025年接近10億美元,主要得益於大規模的雲端遷移以及金融服務領域人工智慧分析技術的廣泛應用。美國證券交易委員會(SEC)氣候報告規則的實施,進一步凸顯了企業資料管理合規的重要性。總部位於亞太地區的供應商將擁有更快的創新週期,並能更早獲得新功能。
亞太地區是成長最快的地區,預計2025年至2030年的複合年成長率將達到22.21%。對5G、電子商務和金融科技的投資將產生大量數據,因此需要進行品質保證。中國、印度和日本正將資料完整性作為其數位公共基礎設施的支柱,而亞太地區的零售商正在加強客戶360度全方位體驗的部署,並引入用戶畫像引擎以實現個人化行銷。
在嚴格的隱私和永續性法規的推動下,歐洲正經歷強勁成長。企業社會責任指令(CSRD)推動了對審核的ESG資訊揭露解決方案的需求。企業正在權衡雲端運算的優勢與資料主權,並採用區域節點和主權雲端來遵守區域化規則。歐洲企業董事會日益認知到,乾淨的數據是數位化競爭力的基石。
其他好處
- Excel格式的市場預測(ME)表
- 3個月的分析師支持
目錄
第1章 引言
- 研究假設和市場定義
- 調查範圍
第2章調查方法
第3章執行摘要
第4章 市場情勢
- 市場概覽
- 市場促進因素
- 北美核心銀行平台加速向雲端遷移,推動大規模資料修復計劃。
- 加強歐洲ESG報告義務需要公司範圍內的資料品管。
- 人工智慧驅動的客戶360度體驗計畫推動亞太零售業在數據分析和匹配工具方面的支出增加。
- 廠商原生自動化插件可降低SaaS工作負載的整體擁有成本。
- 金融服務業即時詐欺偵測管道推動了對串流數據品質引擎的需求
- 美國和歐盟的健康資料互通性法規加速了FHIR相容資料清洗解決方案的採用
- 市場限制
- 傳統本地資料倉儲中持續存在的技術債會減緩現代工具的採用。
- 區域資料居住法規的分散化使全球擴張變得複雜。
- 中小企業缺乏數據工程人才,阻礙了工具的有效利用。
- 由於一級ERP套件內建了ETL規則集,導致轉換成本高。
- 技術展望
- 波特五力分析
- 供應商的議價能力
- 消費者議價能力
- 新進入者的威脅
- 替代品的威脅
- 競爭對手之間的競爭
- 對影響市場的宏觀經濟因素進行評估
第5章 市場規模與成長預測
- 依部署類型
- 雲端基礎的
- 本地部署
- 按組織規模
- 小型企業
- 主要企業
- 按組件
- 軟體
- 服務
- 按數據區域
- 客戶數據
- 產品數據
- 財務數據
- 供應商和廠商數據
- 風險與合規數據
- 按工具類型
- 數據分析
- 資料清洗/標準化
- 資料匹配和去重
- 監控和警報
- 主資料管理為中心的工具
- 按行業
- BFSI
- 政府/公共部門
- 資訊科技和電信
- 零售與電子商務
- 醫療保健和生命科學
- 其他產業(製造業、公共產業、媒體)
- 按地區
- 北美洲
- 美國
- 加拿大
- 墨西哥
- 南美洲
- 巴西
- 阿根廷
- 智利
- 秘魯
- 其他南美洲
- 歐洲
- 德國
- 英國
- 法國
- 義大利
- 西班牙
- 其他歐洲地區
- 亞太地區
- 中國
- 日本
- 韓國
- 印度
- 澳洲
- 紐西蘭
- 亞太其他地區
- 中東和非洲
- 阿拉伯聯合大公國
- 沙烏地阿拉伯
- 土耳其
- 南非
- 其他中東和非洲地區
- 北美洲
第6章 競爭情勢
- 策略發展
- 供應商定位分析
- 公司簡介
- Informatica Inc.
- IBM Corporation
- SAP SE
- Oracle Corporation
- SAS Institute Inc.
- Precisely(Syncsort)
- Talend Inc.
- Experian PLC
- Ataccama Corp.
- Microsoft Corp.
- Collibra NV
- TIBCO Software Inc.
- Alteryx Inc.
- Dun and Bradstreet Holdings Inc.
- Moody's Analytics/Bureau van Dijk
- Information Builders(ibi/TIBCO)
- Data Ladder LLC
- Melissa Data Corp.
- Innovative Systems Inc.
- ASG Technologies
第7章 市場機會與未來展望
The data quality tools market size is currently valued at USD 2.78 billion in 2025 and is forecast to climb to USD 6.34 billion by 2030, reflecting a 17.93% CAGR.
Escalating regulatory scrutiny, rapid cloud adoption, and the surge in real-time analytics have positioned high-quality data as a non-negotiable asset. Enterprises are pairing data quality initiatives with AI deployments because model accuracy depends on clean, reliable data. Demand is strongest for cloud-ready platforms that integrate with data lakes and low-code workflows, helping firms offset shortages of specialist talent. Vendor focus has shifted toward automated anomaly detection, predictive cleansing, and domain-specific rules that accelerate implementation in sectors such as BFSI, retail, and healthcare.
Global Data Quality Tools Market Trends and Insights
Accelerated Migration of Core Banking Platforms to Cloud Driving High-Volume Data Remediation Projects
Financial institutions moving legacy cores to cloud environments are prioritizing automated data remediation to keep lending and payments processes online. Mortgage approval checks that once took 4-6 hours under manual validation now run in near real time after tool deployment, improving customer experience and reducing operational risk. Cloud-native data quality engines tighten feedback loops between data ingestion, profiling and AI-driven analytics, creating a cycle in which better data increases cloud ROI, which in turn reinforces quality budgets.
Intensifying ESG-Reporting Mandates Necessitating Enterprise-Wide Data Quality Controls
SEC climate disclosures, California SB-253/SB-261, and the EU CSRD begin in January 2025 and collectively affect thousands of firms. Compliance programmes now earmark dedicated budgets for lineage, validation, and audit-readiness functionality. Boards link poor ESG data to reputational risk, pushing sustainability officers to adopt solutions that track Scope 3 emissions and verify supplier declarations .
Persistent Technical Debt in Legacy On-Prem Data Warehouses Delaying Modern Tool Adoption
Many organisations divert budgets to maintain ageing ETL jobs and proprietary databases, spending USD 3 million yearly on upkeep. Integration gaps between old schemas and modern APIs slow rollouts, leading firms in finance and healthcare to phase upgrades over multi-year roadmaps before unlocking full cloud-native quality capabilities.
Other drivers and restraints analyzed in the detailed report include:
- AI-Driven Customer 360 Initiatives Boosting Spend on Data Profiling & Matching Tools
- Real-Time Fraud-Detection Pipelines in BFSI Catalysing Demand for Streaming Data Quality Engines
- Shortage of Data Engineering Talent Limiting Effective Tool Utilisation in SMEs
For complete list of drivers and restraints, kindly check the Table Of Contents.
Segment Analysis
Cloud deployments generated 64% of data quality tools market revenue in 2024, equal to roughly USD 1.78 billion in the 2025 baseline year. Exceptional 20.23% CAGR indicates that scalability, elastic pricing, and proximity to cloud data stores outweigh security concerns for most buyers. The data quality tools market size for cloud services is set to expand rapidly as API-driven connectors simplify ingestion from SaaS sources and streaming platforms.
On-premise installations remain critical for sectors handling sensitive patient, payment, or defence data. Accounting for 36% of revenue in 2024, this cohort is enhancing hybrid capabilities that bridge regulated workloads with public cloud analytics. Healthcare providers illustrate the balance, retaining clinical records on site while cleansing lab feeds in HIPAA-compliant clouds.
Large enterprises produced 58% of total revenue in 2024, thanks to complex data estates spanning dozens of domains and regulatory mandates. Many run enterprise governance programmes that integrate data profiling, monitoring, and remediation into common control planes. The data quality tools market size among large enterprises is stable yet incremental.
SMEs deliver the strongest momentum with 19.52% CAGR to 2030. Pay-as-you-go pricing, consumption credits, and modular packaging lower entry costs. Case studies from UK manufacturers show that improved data quality increased product innovation velocity and enhanced competitive positioning, fostering broader adoption beyond early tech adopters.
Data Quality Tools Market is Segmented by Deployment Type (Cloud-Based, On-Premise), Size of the Organization (SMEs, Large Enterprises), Component (Software, Services), Data Domain (Customer Data, Product Data, and More), Tool Type (Data Profiling, Data Cleansing/Standardisation, and More), End-User Vertical (BFSI, Government and Public Sector, and More), Geography. The Market Forecasts are Provided in Terms of Value (USD).
Geography Analysis
North America generated 36% of global revenue in 2024, or close to USD 1.00 billion in 2025, underpinned by heavy cloud migration in financial services and advanced adoption of AI-enabled analytics. The introduction of SEC climate reporting rules strengthens the compliance rationale for enterprise-wide data controls. Vendors headquartered in the region accelerate innovation cycles, providing early exposure to new features.
Asia-Pacific is the fastest mover with a projected 22.21% CAGR from 2025 to 2030. Investments in 5G, e-commerce, and fintech generate vast data volumes that require quality assurances. China, India, and Japan emphasise data integrity as a pillar of digital public infrastructure, while APAC retailers deploy profiling engines to enhance Customer 360 rollouts and personalise offers.
Europe's growth is steady, driven by stringent privacy and sustainability mandates. The CSRD drives demand for solutions that ensure auditable ESG disclosures. Organisations weigh cloud benefits against data sovereignty, adopting regional nodes or sovereign clouds to comply with localisation rules. Increasingly, European boards recognise clean data as foundational to digital competitiveness.
- Informatica Inc.
- IBM Corporation
- SAP SE
- Oracle Corporation
- SAS Institute Inc.
- Precisely (Syncsort)
- Talend Inc.
- Experian PLC
- Ataccama Corp.
- Microsoft Corp.
- Collibra NV
- TIBCO Software Inc.
- Alteryx Inc.
- Dun and Bradstreet Holdings Inc.
- Moody's Analytics/Bureau van Dijk
- Information Builders (ibi/TIBCO)
- Data Ladder LLC
- Melissa Data Corp.
- Innovative Systems Inc.
- ASG Technologies
Additional Benefits:
- The market estimate (ME) sheet in Excel format
- 3 months of analyst support
TABLE OF CONTENTS
1 INTRODUCTION
- 1.1 Study Assumptions and Market Definition
- 1.2 Scope of the Study
2 RESEARCH METHODOLOGY
3 EXECUTIVE SUMMARY
4 MARKET LANDSCAPE
- 4.1 Market Overview
- 4.2 Market Drivers
- 4.2.1 Accelerated Migration of Core Banking Platforms to Cloud Driving High-Volume Data Remediation Projects in North America
- 4.2.2 Intensifying ESG-Reporting Mandates in Europe Necessitating Enterprise-Wide Data Quality Controls
- 4.2.3 AI-Driven Customer 360 Initiatives Boosting Spend on Data Profiling and Matching Tools Across APAC Retail
- 4.2.4 Vendor-Native Automation Plug-Ins Reducing Total Cost-of-Ownership for SaaS Workloads
- 4.2.5 Real-Time Fraud-Detection Pipelines in BFSI Catalysing Demand for Streaming Data Quality Engines
- 4.2.6 Healthcare Interoperability Rules (US and EU) Accelerating FHIR-Compatible Data Cleansing Solutions
- 4.3 Market Restraints
- 4.3.1 Persistent Technical Debt in Legacy On-Prem Data Warehouses Delaying Modern Tool Adoption
- 4.3.2 Fragmented Regional Data-Residency Statutes Complicating Global Roll-Outs
- 4.3.3 Shortage of Data Engineering Talent Limiting Effective Tool Utilisation in SMEs
- 4.3.4 High Switching Costs from Embedded ETL Rule-Sets within Tier-1 ERP Suites
- 4.4 Technological Outlook
- 4.5 Porter's Five Forces Analysis
- 4.5.1 Bargaining Power of Suppliers
- 4.5.2 Bargaining Power of Consumers
- 4.5.3 Threat of New Entrants
- 4.5.4 Threat of Substitute Products
- 4.5.5 Intensity of Competitive Rivalry
- 4.6 Assessment of Macroeconomic Factors Impact on the Market
5 MARKET SIZE AND GROWTH FORECASTS (VALUE)
- 5.1 By Deployment Type
- 5.1.1 Cloud-based
- 5.1.2 On-Premise
- 5.2 By Size of the Organization
- 5.2.1 Small and Medium Enterprises
- 5.2.2 Large Enterprises
- 5.3 By Component
- 5.3.1 Software
- 5.3.2 Services
- 5.4 By Data Domain
- 5.4.1 Customer Data
- 5.4.2 Product Data
- 5.4.3 Financial Data
- 5.4.4 Supplier and Vendor Data
- 5.4.5 Risk and Compliance Data
- 5.5 By Tool Type
- 5.5.1 Data Profiling
- 5.5.2 Data Cleansing / Standardisation
- 5.5.3 Data Matching and De-Duplication
- 5.5.4 Monitoring and Alerting
- 5.5.5 Master Data Management-Centric Tools
- 5.6 By End-User Vertical
- 5.6.1 BFSI
- 5.6.2 Government and Public Sector
- 5.6.3 IT and Telecom
- 5.6.4 Retail and E-commerce
- 5.6.5 Healthcare and Life Sciences
- 5.6.6 Other Industries (Manufacturing, Utilities, Media)
- 5.7 By Geography
- 5.7.1 North America
- 5.7.1.1 United States
- 5.7.1.2 Canada
- 5.7.1.3 Mexico
- 5.7.2 South America
- 5.7.2.1 Brazil
- 5.7.2.2 Argentina
- 5.7.2.3 Chile
- 5.7.2.4 Peru
- 5.7.2.5 Rest of South America
- 5.7.3 Europe
- 5.7.3.1 Germany
- 5.7.3.2 United Kingdom
- 5.7.3.3 France
- 5.7.3.4 Italy
- 5.7.3.5 Spain
- 5.7.3.6 Rest of Europe
- 5.7.4 Asia-Pacific
- 5.7.4.1 China
- 5.7.4.2 Japan
- 5.7.4.3 South Korea
- 5.7.4.4 India
- 5.7.4.5 Australia
- 5.7.4.6 New Zealand
- 5.7.4.7 Rest of Asia-Pacific
- 5.7.5 Middle East and Africa
- 5.7.5.1 United Arab Emirates
- 5.7.5.2 Saudi Arabia
- 5.7.5.3 Turkey
- 5.7.5.4 South Africa
- 5.7.5.5 Rest of Middle East and Africa
- 5.7.1 North America
6 COMPETITIVE LANDSCAPE
- 6.1 Strategic Developments
- 6.2 Vendor Positioning Analysis
- 6.3 Company Profiles (includes Global level Overview, Market level overview, Core Segments, Financials as available, Strategic Information, Products and Services, and Recent Developments)
- 6.3.1 Informatica Inc.
- 6.3.2 IBM Corporation
- 6.3.3 SAP SE
- 6.3.4 Oracle Corporation
- 6.3.5 SAS Institute Inc.
- 6.3.6 Precisely (Syncsort)
- 6.3.7 Talend Inc.
- 6.3.8 Experian PLC
- 6.3.9 Ataccama Corp.
- 6.3.10 Microsoft Corp.
- 6.3.11 Collibra NV
- 6.3.12 TIBCO Software Inc.
- 6.3.13 Alteryx Inc.
- 6.3.14 Dun and Bradstreet Holdings Inc.
- 6.3.15 Moody's Analytics/Bureau van Dijk
- 6.3.16 Information Builders (ibi/TIBCO)
- 6.3.17 Data Ladder LLC
- 6.3.18 Melissa Data Corp.
- 6.3.19 Innovative Systems Inc.
- 6.3.20 ASG Technologies
7 MARKET OPPORTUNITIES AND FUTURE OUTLOOK
- 7.1 White-Space and Unmet-Need Assessment
 2026年全球數據品質工具市場報告
 資料品管工具市場規模、佔有率、趨勢和預測:按資料類型、功能、組件、部署模式、組織規模、產業和地區分類,2026-2034 年2026年全球LLM數據品質保證市場報告2026年全球數據版本控制工具市場報告2026年全球數據品質人工智慧(AI)市場報告
 資料品質工具市場:依工具類別、資料類型、資料來源環境、產業、組織規模與部署模式分類-2026-2032年全球預測
 資料品質工具市場 - 全球產業規模、佔有率、趨勢、機會、預測:按組件、部署方式、應用、地區和競爭對手分類,2021-2031年
 資料品管(DQM) 市場,全球預測至 2032 年:按元件、部署模式、組織規模、應用程式、最終使用者和地區分類全球資料品質工具市場:預測至 2032 年-按組件、部署方式、組織規模、功能、資料類型、最終使用者和地區進行分析
 2025-2029 年全球資料品質人工智慧市場