


 |
市場調查報告書
商品編碼
1851027
網路即服務:市場佔有率分析、產業趨勢、統計數據和成長預測(2025-2030 年)Network As A Service - Market Share Analysis, Industry Trends & Statistics, Growth Forecasts (2025 - 2030) |
||||||
※ 本網頁內容可能與最新版本有所差異。詳細情況請與我們聯繫。
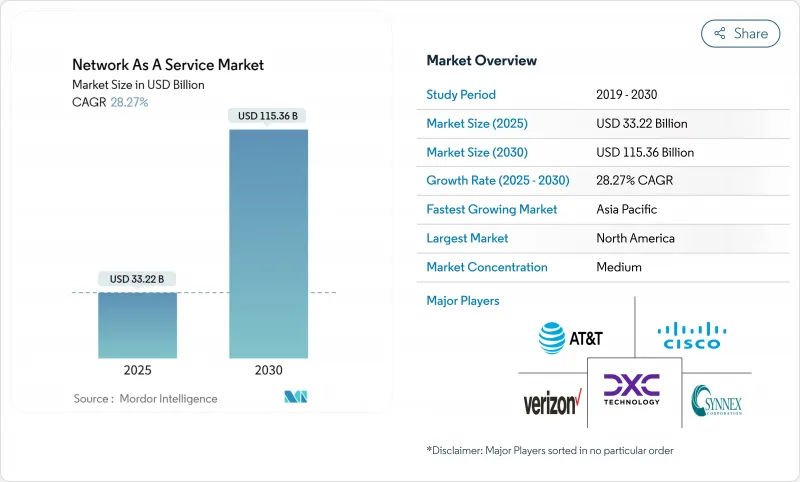
預計到 2025 年,網路即服務市場規模將達到 332.2 億美元,到 2030 年將達到 1,153.6 億美元,在此期間的複合年成長率將達到 28.3%。
這一擴張反映了企業從資本密集型硬體所有權向基於消費的服務模式的果斷轉變,這種模式使營運預算與敏捷性需求相匹配。雲端優先轉型藍圖、SD-WAN 和 SASE 的快速部署,以及將平均修復時間縮短至五分鐘以內的 AI主導網路保障引擎,共同推動了這一趨勢的強勁發展。北美憑藉強大的企業數位化和成熟的託管服務生態系統保持著領先優勢,而亞太地區則在大型現代化專案和嚴格的資料主權要求的支持下實現了快速成長。隨著傳統設備供應商重新調整其服務組合,以及通訊將私有 5G 切片商業化,競爭日益加劇。同時,資料駐留法規、供應商鎖定問題以及 IFRS 16/ASC 842 複雜的會計處理影響,正在抑制短期內的普及前景。
全球網路即服務市場趨勢與洞察
企業「雲端優先」網路轉型藍圖
隨著企業淘汰傳統硬體並採用雲端原生、軟體定義平台,實現基於意圖的自動化和整合安全,現代化專案正在重新定義基礎架構的消費模式。思科的數據顯示,91% 的技術長正在增加網路預算以支援人工智慧和物聯網工作負載,而整合式網路即服務 (NaaS) 框架正成為快速創新的首選途徑。在單一營運模式下緊密結合連線性、安全性和可觀測性,能夠實現快速部署、減少停機時間,並在多重雲端環境中執行一致的策略。由此帶來的敏捷性將網路從不斷折舊免稅額的資產轉變為一種彈性公用事業,從而增強了網路即服務市場。
從資本支出預算轉向營運支出預算再轉向訂閱預算
IFRS 16 和 ASC 842 要求公司在資產負債表中確認租賃,這使得傳統硬體採購的經濟效益變得複雜。基於消費的網路模式有助於公司避免大量資本投入,平滑現金流,並縮短更新周期,從而促進財務長主導的轉型計畫的實施。可預測的月度支出還能降低技術生命週期加速時的財務風險,使得訂閱模式對中階市場用戶尤其具有吸引力。
持久資料主權和居住合規性障礙
諸如歐洲資料法和中國網路安全法等區域性法規要求在本地進行資料處理,並限制跨境傳輸。這些框架使全球服務整合變得複雜,迫使服務供應商部署分散的部署模式,從而降低規模經濟效益,延長採購週期,並減緩受監管地區網路即服務市場的成長。
細分市場分析
預計到2024年,廣域網路即服務(WANaaS)市場規模將達到151億美元,佔總營收的45.5%,這主要得益於企業優先考慮彈性、應用感知型連接,以支援混合辦公和雲端採用。同時,受Wi-Fi 7部署的推動,校園交換機即服務(Campus-Switch-as-a-Service)市場預計將在2030年之前以29.8%的複合年成長率成長,而Wi-Fi 7部署需要先進的電源管理和射頻最佳化技術。
供應商正透過將交換器、網路基地台和保障軟體捆綁到訂閱協議中,降低中型園區網路的採購門檻。展望未來,區域網路即服務 (LANaaS) 和資料中心互連服務預計將透過園區網路、廣域網路 (WAN) 和雲端架構的整合合約獲得更大的市場佔有率。向單一平台營運的轉型將使服務類型的多樣化成為網路即服務 (NaaS) 市場擴張的核心。
到2024年,隨著企業以託管在白盒設備上的軟體鏡像取代硬體路由器,虛擬CPE將佔據42.8%的市場。整合網路安全即服務(Integrated Network Security as a Service)將呈現最強勁的成長勢頭,複合年成長率(CAGR)將達到29.3%,反映出企業越來越依賴融合連接性和威脅防禦的SASE框架。
隨選頻寬和託管 VPN 仍然相輔相成,能夠根據季節性工作負載動態擴展容量,並為低頻寬網站提供安全連線。預計到 2030 年,整合安全將超越虛擬 CPE。這一趨勢正在推動網路即服務 (NaaS) 市場的穩定擴張,並帶動對多功能服務層級的支出,這些服務層級將合規性、DDoS 防護和可觀測性整合到單一服務等級協定 (SLA) 中。
區域分析
到2024年,北美將佔據35.4%的市場佔有率,這反映出該地區擁有成熟的雲端生態系、早期採用SASE技術以及現有供應商內部能力的顯著整合。 HPE計畫以140億美元收購Juniper Networks,旨在使其網路業務收入翻番,這標誌著HPE正採取平台策略,挑戰思科的市場主導地位。聯邦和州的資料隱私法規將進一步推動缺乏內部合規資源的公司採用託管服務。
預計到2030年,亞太地區將以28.9%的複合年成長率成長,主要得益於各國政府對數位基礎建設的資金投入,以及通訊業者將私有5G切片技術商業化應用於工業園區。中國的數據在地化政策正在推動自主雲端網路即服務(NaaS)模式的發展,而印度的生產連結獎勵計畫則刺激了工廠數位化,從而帶動了該地區的需求。
在歐洲,儘管監管嚴格,但商業機會依然豐富。即將訂定的《數位營運彈性法案》正推動銀行和保險公司採用具備內建審核就緒報告功能的託管連線。服務供應商正在調整其產品以滿足GDPR、資料可攜性法案和新的網路彈性基準的要求,從而推動了相關技術的穩步普及。拉丁美洲和中東及非洲地區雖然仍處於起步階段,但隨著雲端服務可用性的提高和能源價格波動對可預測營運支出模式的需求,這些地區的雲端服務正在迅速發展。
其他福利:
- Excel格式的市場預測(ME)表
- 3個月的分析師支持
目錄
第1章 引言
- 研究假設和市場定義
- 調查範圍
第2章調查方法
第3章執行摘要
第4章 市場情勢
- 市場概覽
- 市場促進因素
- 企業「雲端優先」網路轉型藍圖
- 訂閱預算從資本支出轉向營運支出
- SD-WAN 和 SASE 的整合加速了託管廣域網路的轉型。
- 校園區域網路即服務需求計數器 Wi-Fi 7 功率峰值
- 人工智慧驅動的網路保障將平均修復時間縮短至 5 分鐘以內
- 通訊服務提供者以「服務」形式出售的私人 5G 網路切片
- 市場限制
- 持久資料主權和居住合規性障礙
- 因專有生命週期平台而導致的供應商鎖定問題
- IFRS 16/ASC 842 複雜租賃會計準則
- 邊緣站點電力成本的波動會影響網路即服務 (NaaS) 的總擁有成本 (TCO)。
- 價值鏈分析
- 監管環境
- 技術展望
- 波特五力分析
- 供應商的議價能力
- 買方的議價能力
- 新進入者的威脅
- 替代品的威脅
- 競爭對手之間的競爭
- 評估宏觀經濟趨勢對市場的影響
第5章 市場規模與成長預測
- 按類型
- 區域網路即服務
- 廣域網路服務
- 校園交換器即服務
- 資料中心互連即服務
- 透過使用
- 虛擬 CPE (vCPE)
- 按需頻寬(BoD)
- 整合網路安全即服務
- 虛擬私人網路(VPN)
- 按公司規模
- 主要企業
- 中小企業
- 按行業
- 資訊科技和電信
- BFSI
- 衛生保健
- 製造業
- 零售與電子商務
- 其他行業
- 按地區
- 北美洲
- 美國
- 加拿大
- 墨西哥
- 歐洲
- 德國
- 英國
- 法國
- 義大利
- 西班牙
- 其他歐洲地區
- 亞太地區
- 中國
- 日本
- 印度
- 韓國
- 澳洲
- 亞太其他地區
- 南美洲
- 巴西
- 阿根廷
- 其他南美洲
- 中東和非洲
- 中東
- 沙烏地阿拉伯
- 阿拉伯聯合大公國
- 土耳其
- 其他中東地區
- 非洲
- 南非
- 埃及
- 奈及利亞
- 其他非洲地區
- 北美洲
第6章 競爭情勢
- 市場集中度
- 策略趨勢
- 市佔率分析
- 公司簡介
- Cisco Systems Inc.
- Hewlett Packard Enterprise(Aruba/GreenLake)
- ATandT Inc.
- Verizon Communications Inc.
- IBM Corp.
- DXC Technology
- TD SYNNEX(Avnet)
- NEC Corp.
- Oracle Corp.
- GTT Communications
- VMware(Broadcom)
- Telstra Group
- Lumen Technologies
- Cato Networks
- Aryaka Networks
- Juniper Networks
- Nokia(Alcatel-Lucent Enterprise)
- Akamai Technologies
- Masergy(Comcast Business)
- Proofpoint/Meta Networks
- Extreme Networks
- Fortinet Inc.
第7章 市場機會與未來展望
The Network as a Service market size is valued at USD 33.22 billion in 2025 and is forecast to reach USD 115.36 billion in 2030, registering a 28.3% CAGR over the period.
This expansion reflects a decisive enterprise shift from capital-intensive hardware ownership toward consumption-based service models that align operating budgets with agility needs. Strong momentum comes from cloud-first transformation roadmaps, rapid SD-WAN and SASE rollouts, and AI-driven network-assurance engines that cut mean time to repair to under five minutes. North America retains primacy through robust enterprise digitalization and a mature managed-services ecosystem, while Asia-Pacific posts the fastest growth, supported by large-scale modernization programs and strict data-sovereignty mandates. Competitive intensity is rising as legacy equipment vendors reposition around service portfolios and telecom carriers monetize private-5G slicing. At the same time, data-residency rules, vendor-lock-in anxieties, and IFRS 16/ASC 842 accounting complexity temper near-term adoption prospects.
Global Network As A Service Market Trends and Insights
Enterprises' "cloud-first" network-transformation roadmaps
Modernization programs are redefining infrastructure consumption as organizations retire legacy hardware in favor of cloud-native, software-defined platforms that deliver intent-based automation and integrated security. Cisco notes that 91% of technology executives have boosted networking budgets to underpin AI and IoT workloads, with unified NaaS frameworks emerging as the preferred path to rapid innovation. Tight coupling of connectivity, security, and observability under a single operational model enables quicker provisioning, lower downtime, and consistent policy enforcement across multi-cloud estates. The resulting agility strengthens the Network as a Service market by turning networking into an elastic utility rather than a depreciating asset.
Shift from CapEx to OpEx subscription budgeting pressure
IFRS 16 and ASC 842 compel enterprises to recognize leases on balance sheets, complicating traditional hardware-procurement economics. Consumption-based networking helps firms sidestep large capital allocations, smooth cash-flow profiles, and shorten refresh cycles, driving uptake among CFO-led transformation initiatives. Predictable monthly spend also reduces financial risk when technology lifecycles accelerate, making subscription models especially attractive for mid-market adopters.
Persistent data-sovereignty and residency compliance barriers
Regional mandates such as the European Data Act and China's cybersecurity law require local processing and impose cross-border transfer restrictions. These frameworks complicate global service uniformity, forcing providers to deploy fragmented footprints that dilute economies of scale and extend procurement cycles, thereby slowing the Network as a Service market in regulated sectors.
Other drivers and restraints analyzed in the detailed report include:
- SD-WAN and SASE convergence accelerating managed WAN refresh
- Campus-LAN NaaS demand to counter Wi-Fi 7 power spikes
- Vendor lock-in fears around proprietary lifecycle platforms
For complete list of drivers and restraints, kindly check the Table Of Contents.
Segment Analysis
The Network as a Service market size for WAN-as-a-Service reached USD 15.10 billion in 2024 and accounted for 45.5% of revenue. Enterprises prioritize resilient, application-aware connectivity that supports hybrid work and cloud adoption. Campus-Switch-as-a-Service, however, is forecast to expand at 29.8% CAGR to 2030, propelled by Wi-Fi 7 rollouts that demand sophisticated power-management and RF optimization.
Vendors bundle switching, access points, and assurance software into subscription contracts, flattening the procurement barrier for mid-sized campuses. Over the forecast horizon, LAN-as-a-Service and data-center interconnect offerings are expected to gain share as organizations converge campus, WAN, and cloud fabrics under unified contracts. The push toward single-platform operations will keep service-type diversification at the forefront of Network as a Service market expansion.
Virtual CPE held 42.8% share in 2024 as enterprises replaced hardware routers with software images hosted on white-box devices. Integrated network-security-as-a-service exhibits the strongest trajectory with a 29.3% CAGR, reflecting growing reliance on SASE frameworks that blend connectivity and threat defense.
Bandwidth-on-Demand and managed VPN remain complementary, enabling dynamic capacity scaling for seasonal workloads and secure connectivity to low-bandwidth sites. By 2030, integrated security is expected to overtake virtual CPE as enterprises regard secure connectivity as baseline. The trend underpins steady increases in Network as a Service market size, channeling spend toward multi-function service tiers that bake compliance, DDoS protection, and observability into a single SLA.
The Network As A Service Market Report is Segmented by Type (LAN-As-A-Service, WAN-As-A-Service, and More), Application (Virtual CPE (vCPE), Bandwidth-On-Demand (BoD), and More), Organization Size (Large Enterprises and Small and Medium Enterprises (SMEs)), Industry Vertical (IT and Telecom, BFSI, Healthcare, and More), and Geography. The Market Forecasts are Provided in Terms of Value (USD).
Geography Analysis
North America held the lion's share at 35.4% in 2024, reflecting a sophisticated cloud ecosystem, early SASE adoption, and an active MandA landscape that consolidates capabilities within incumbent vendors. HPE's planned USD 14 billion acquisition of Juniper Networks intends to double networking revenue contribution, signaling a platform play to challenge Cisco's dominance. Federal and state data-privacy rules further spur managed-service uptake by enterprises that lack compliance resources in-house.
Asia-Pacific is poised for a 28.9% CAGR through 2030 as governments fund digital-infrastructure build-outs and telcos commercialize private-5G slicing for industrial campuses. China's data-localization mandates encourage sovereign-cloud NaaS models, while India's Production-Linked Incentive program stimulates factory digitization, together bolstering regional demand.
Europe remains opportunity-rich despite tight regulations; the upcoming Digital Operational Resilience Act drives banks and insurers toward managed connectivity that embeds audit-ready reporting. Service providers tailor offerings to satisfy GDPR, data-act portability, and emerging cyber-resilience benchmarks, promoting steady uptake. Latin America, the Middle East, and Africa are still nascent but gaining traction as cloud-service availability rises and energy-price volatility increases appetite for predictable OpEx consumption models.
- Cisco Systems Inc.
- Hewlett Packard Enterprise (Aruba/GreenLake)
- ATandT Inc.
- Verizon Communications Inc.
- IBM Corp.
- DXC Technology
- TD SYNNEX (Avnet)
- NEC Corp.
- Oracle Corp.
- GTT Communications
- VMware (Broadcom)
- Telstra Group
- Lumen Technologies
- Cato Networks
- Aryaka Networks
- Juniper Networks
- Nokia (Alcatel-Lucent Enterprise)
- Akamai Technologies
- Masergy (Comcast Business)
- Proofpoint / Meta Networks
- Extreme Networks
- Fortinet Inc.
Additional Benefits:
- The market estimate (ME) sheet in Excel format
- 3 months of analyst support
TABLE OF CONTENTS
1 INTRODUCTION
- 1.1 Study Assumptions and Market Definition
- 1.2 Scope of the Study
2 RESEARCH METHODOLOGY
3 EXECUTIVE SUMMARY
4 MARKET LANDSCAPE
- 4.1 Market Overview
- 4.2 Market Drivers
- 4.2.1 Enterprises' "cloud-first" network transformation roadmaps
- 4.2.2 Shift from CapEx to OpEx subscription budgeting pressure
- 4.2.3 SD-WAN and SASE convergence accelerating managed WAN refresh
- 4.2.4 Campus-LAN NaaS demand to counter Wi-Fi 7 power spikes
- 4.2.5 AI-driven network assurance reducing MTTR below 5 min
- 4.2.6 Private-5G network slicing sold "as-a-service" by CSPs
- 4.3 Market Restraints
- 4.3.1 Persistent data-sovereignty and residency compliance barriers
- 4.3.2 Vendor lock-in fears around proprietary lifecycle platforms
- 4.3.3 Complex lease-accounting rules under IFRS 16/ASC 842
- 4.3.4 Edge-site power cost volatility impacting NaaS TCO
- 4.4 Value Chain Analysis
- 4.5 Regulatory Landscape
- 4.6 Technological Outlook
- 4.7 Porter's Five Forces Analysis
- 4.7.1 Bargaining Power of Suppliers
- 4.7.2 Bargaining Power of Buyers
- 4.7.3 Threat of New Entrants
- 4.7.4 Threat of Substitutes
- 4.7.5 Intensity of Competitive Rivalry
- 4.8 Assessment of the Impact of Macroeconomic Trends on the Market
5 MARKET SIZE AND GROWTH FORECASTS (VALUE)
- 5.1 By Type
- 5.1.1 LAN-as-a-Service
- 5.1.2 WAN-as-a-Service
- 5.1.3 Campus-Switch-as-a-Service
- 5.1.4 Data-Centre-Interconnect-as-a-Service
- 5.2 By Application
- 5.2.1 Virtual CPE (vCPE)
- 5.2.2 Bandwidth-on-Demand (BoD)
- 5.2.3 Integrated Network-Security-as-a-Service
- 5.2.4 Virtual Private Network (VPN)
- 5.3 By Organisation Size
- 5.3.1 Large Enterprises
- 5.3.2 Small and Medium Enterprises (SMEs)
- 5.4 By Industry Vertical
- 5.4.1 IT and Telecom
- 5.4.2 BFSI
- 5.4.3 Healthcare
- 5.4.4 Manufacturing
- 5.4.5 Retail and E-commerce
- 5.4.6 Other Industry Verticals
- 5.5 By Geography
- 5.5.1 North America
- 5.5.1.1 United States
- 5.5.1.2 Canada
- 5.5.1.3 Mexico
- 5.5.2 Europe
- 5.5.2.1 Germany
- 5.5.2.2 United Kingdom
- 5.5.2.3 France
- 5.5.2.4 Italy
- 5.5.2.5 Spain
- 5.5.2.6 Rest of Europe
- 5.5.3 Asia-Pacific
- 5.5.3.1 China
- 5.5.3.2 Japan
- 5.5.3.3 India
- 5.5.3.4 South Korea
- 5.5.3.5 Australia
- 5.5.3.6 Rest of Asia-Pacific
- 5.5.4 South America
- 5.5.4.1 Brazil
- 5.5.4.2 Argentina
- 5.5.4.3 Rest of South America
- 5.5.5 Middle East and Africa
- 5.5.5.1 Middle East
- 5.5.5.1.1 Saudi Arabia
- 5.5.5.1.2 United Arab Emirates
- 5.5.5.1.3 Turkey
- 5.5.5.1.4 Rest of Middle East
- 5.5.5.2 Africa
- 5.5.5.2.1 South Africa
- 5.5.5.2.2 Egypt
- 5.5.5.2.3 Nigeria
- 5.5.5.2.4 Rest of Africa
- 5.5.1 North America
6 COMPETITIVE LANDSCAPE
- 6.1 Market Concentration
- 6.2 Strategic Moves
- 6.3 Market Share Analysis
- 6.4 Company Profiles (includes Global level Overview, Market level overview, Core Segments, Financials as available, Strategic Information, Market Rank/Share for key companies, Products and Services, and Recent Developments)
- 6.4.1 Cisco Systems Inc.
- 6.4.2 Hewlett Packard Enterprise (Aruba/GreenLake)
- 6.4.3 ATandT Inc.
- 6.4.4 Verizon Communications Inc.
- 6.4.5 IBM Corp.
- 6.4.6 DXC Technology
- 6.4.7 TD SYNNEX (Avnet)
- 6.4.8 NEC Corp.
- 6.4.9 Oracle Corp.
- 6.4.10 GTT Communications
- 6.4.11 VMware (Broadcom)
- 6.4.12 Telstra Group
- 6.4.13 Lumen Technologies
- 6.4.14 Cato Networks
- 6.4.15 Aryaka Networks
- 6.4.16 Juniper Networks
- 6.4.17 Nokia (Alcatel-Lucent Enterprise)
- 6.4.18 Akamai Technologies
- 6.4.19 Masergy (Comcast Business)
- 6.4.20 Proofpoint / Meta Networks
- 6.4.21 Extreme Networks
- 6.4.22 Fortinet Inc.
7 MARKET OPPORTUNITIES AND FUTURE OUTLOOK
- 7.1 White-space and Unmet-Need Assessment
 網路即服務 (NaaS) 市場:按服務類型、組織規模和產業分類 - 2026-2032 年全球市場預測
 網路即服務 (NaaS) 市場預測至 2034 年:全球分析(按組件、部署類型、組織規模、最終用戶和地區分類)
 2026年全球網路即服務市場報告
 網路即服務市場分析及至 2035 年預測:按類型、產品類型、服務、技術、組件、應用、部署類型、最終用戶和解決方案分類
 日本網路即服務市場報告(按類型、應用、最終用戶產業和地區分類,2026-2034 年)
 作為服務的網路(NaaS):全球市場的預測(2025年~2029年)
 網路API的全球市場:預測(2024年~2030年)
 全球 NaaS(網路即服務)市場規模、佔有率、趨勢分析報告:2024 年至 2031 年按類型、最終用戶、應用、公司類型、行業垂直和地區分類的展望和預測
 網路即服務 (NaaS) 市場:2025-2029 年全球
 網路即服務 (NaaS) 解決方案:電信案例研究與分析