


 |
市場調查報告書
商品編碼
1850996
合成石墨:市場佔有率分析、產業趨勢、統計數據和成長預測(2025-2030 年)Synthetic Graphite - Market Share Analysis, Industry Trends & Statistics, Growth Forecasts (2025 - 2030) |
||||||
※ 本網頁內容可能與最新版本有所差異。詳細情況請與我們聯繫。
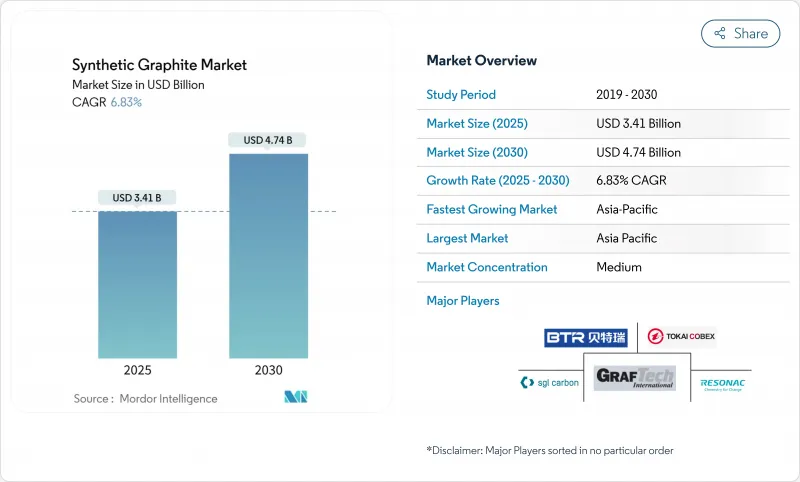
預計到 2025 年,合成石墨市場規模將達到 34.1 億美元,到 2030 年將達到 47.4 億美元,2025 年至 2030 年的複合年成長率為 6.83%。
高性能電動車和電網儲能電池需要能夠實現更快充電、更長續航里程和更穩定循環壽命的負極材料,這推動了市場需求。同時,電弧爐(EAF)煉鋼企業依賴能夠承受3000°C高溫的石墨電極,為合成石墨市場奠定了高產量的基準。製造商也將目光投向小型模組化核子反應爐的核能級部件,從而推動特種鋼材開闢新的收入來源。儘管目前的產能和終端消費量主要集中在亞太地區,但北美正在推動公共資金支持的計劃,以建立國內供應鏈。能源轉型和冶金現代化的雙重拉動正在推動合成石墨市場持續擴張,即便生產商面臨著不斷上漲的成本上漲和脫碳壓力。
全球合成石墨市場趨勢與洞察
電動車需求不斷成長
隨著汽車製造商為滿足排放氣體嚴格的排放法規而加大電池產能,對合成石墨陽極的需求也隨之飆升。這種材料具有粒徑均勻、雜質含量低、循環數千次性能穩定等優點。美國能源局預測,到2035年,美國國內電池產能將成長六倍,並為此向Novonix位於田納西州的年產能3.15萬噸的工廠提供了7.54億美元的有條件貸款。Panasonic能源公司已簽署一項為期四年的北美材料採購協議,採購1萬噸北美材料,以縮短供應鏈並減少範圍3排放。能夠實現4°C以上充電速率的新型電池化學體係依賴於具有客製化孔隙率的超純合成顆粒,這重振了合成石墨市場的高階細分領域。圍繞中國供應的地緣政治風險日益加劇,促使歐洲和韓國也加大了投資,從而增強了電池級材料生產的多區域成長勢頭。
擴大電弧爐煉鋼製程在鋼鐵生產的應用
全球鋼鐵生產商正從高爐煉鋼轉向電弧爐煉鋼,以降低生產過程中的二氧化碳排放強度,而這兩種煉鋼方式都依賴消耗性石墨電極。印度、越南和波灣合作理事會( GCC)等地區的資本投資項目正在新增數十座單爐煉鋼能力超過150噸的電弧爐,這將確保未來十年電極需求的穩定成長。正確的處理、檢驗和校準仍然至關重要,因為裂縫和氧化會增加單位消耗量並降低熔煉車間的產量比率。電極供應商透過將產品與維護和諮詢服務捆綁銷售,在提高收入的同時增強了客戶忠誠度。這種冶金現代化為合成石墨市場提供了一個穩定的長期週期,即使電池需求推動了強勁成長。
石墨生產成本高
合成石墨的價格仍接近每噸2萬美元,這反映了其高能耗、高溫石墨化過程(需要在3000 度C下進行數週)。電池設計人員正在透過將天然石墨和合成石墨混合來降低負極成本,同時保持關鍵的倍率性能。生產商正在探索新的、低溫催化劑路線,例如美國國家能源技術實驗室(NETL)的煤廢棄物衍生工藝,該工藝可在1500 度C下形成紊亂層狀碳,有望在未來產能方面實現更平緩的成本曲線。目前,合成石墨與天然片狀石墨之間巨大的成本Delta將給中階電池製造商帶來利潤壓力,尤其是那些在大眾市場汽車領域展開價格競爭的製造商。
細分市場分析
到2024年,冶金產業將維持49%的合成石墨市場佔有率,主要得益於長循環鋼生產中穩定的電極消耗量。每噸電弧爐鋼水消耗1.8-2.2公斤電極,確保了電極的定期更換需求。然而,電池是成長最快的應用領域,其複合年成長率高達8.39%,這主要得益於電動車和固定式儲能技術的興起。電池需求推動了對負極材料品質要求的提高,加速了合成石墨工廠在連續混合和微米級分級方面的投資。
區域分析
亞太地區將佔合成石墨市場56%的佔有率,到2030年將以7.67%的複合年成長率成長,這主要得益於中國在2023年佔全球石墨產量的77%,以及各地區電弧爐產能的擴張。然而,北京將於2023年底實施的高純度石墨出口許可證制度加劇了供應鏈風險,促使韓國、日本和印度的電池製造商尋求替代貨源。
北美正經歷前所未有的資源共享浪潮。美國能源局向Novonix公司提供了一筆7.54億美元的有條件貸款,用於在田納西州建造一座年產能3.15萬噸的工廠,該工廠每年可為32.5萬輛電動車提供服務,從而降低對進口的依賴。同時,國家能源技術實驗室也正在進行相關研發工作,利用低溫將煤炭廢棄物轉化為電池級石墨,這顯示北美正在建造一條具有成本競爭力的垂直整合供應鏈。
歐洲正致力於引領永續性:Vianord 在挪威的可再生能源試點生產線目前記錄的排放為 1.9 kg-CO2 kg-1,目標是到 2030 年達到 1.0 kg-CO2。德國和法國正在培育木質素製碳項目,這些項目有可能引入生物基原料,分散原料風險,並加強合成石墨市場的低碳化。
其他福利:
- Excel格式的市場預測(ME)表
- 3個月的分析師支持
目錄
第1章 引言
- 研究假設和市場定義
- 調查範圍
第2章調查方法
第3章執行摘要
第4章 市場情勢
- 市場概覽
- 市場促進因素
- 電動車需求不斷成長
- 擴大電弧爐煉鋼製程在鋼鐵生產的應用
- 適用於需要超高純度陽極的高階電動車的快速充電
- 亞洲、中東和非洲超高高功率電爐安裝量迅速成長
- 先進模組化反應器重振了對核能級石墨的需求
- 市場限制
- 石墨生產成本高
- 天然石墨的價格差異決定了OEM陽極的混合物。
- 嚴格的環境法規
- 價值鏈分析
- 波特五力模型
- 供應商的議價能力
- 買方的議價能力
- 新進入者的威脅
- 替代品的威脅
- 競爭程度
第5章 市場規模及成長預測(價值及數量)
- 透過使用
- 電池
- 冶金
- 零件
- 核
- 其他
- 依產品類型
- 石墨陽極
- 石墨塊
- 其他類型
- 按最終用戶行業分類
- 車
- 鋼鐵和金屬
- 能源與電力
- 電子與電機工程
- 化工和石油化工
- 航太與國防
- 其他
- 按地區
- 亞太地區
- 中國
- 印度
- 日本
- 韓國
- 印尼
- 馬來西亞
- 泰國
- 越南
- 亞太其他地區
- 北美洲
- 美國
- 加拿大
- 墨西哥
- 歐洲
- 德國
- 英國
- 法國
- 義大利
- 西班牙
- 北歐國家
- 俄羅斯
- 其他歐洲地區
- 南美洲
- 巴西
- 阿根廷
- 哥倫比亞
- 中東和非洲
- 沙烏地阿拉伯
- 阿拉伯聯合大公國
- 南非
- 奈及利亞
- 埃及
- 其他中東和非洲地區
- 亞太地區
第6章 競爭情勢
- 市場集中度
- 策略趨勢
- 市佔率分析
- 公司簡介
- Anovion LLC
- Asbury Carbons
- BTR New Material Group Co., Ltd.
- GrafTech International
- Graphit Kropfmuhl GmbH
- Graphite India Limited
- HEG Limited
- Imerys
- Mersen
- Mitsubishi Chemical Group Corporation
- Nippon Carbon Co Ltd.
- NOVONIX Ltd.
- Resonac Holdings Corporation
- SGL Carbon
- Shanghai PTL New Energy Technology Co., Ltd.
- Shanghai Shanshan Technology Co., Ltd.
- Superior Graphite
- Tokai COBEX GmbH
- Vianode
第7章 市場機會與未來展望
The synthetic graphite market size is valued at USD 3.41 billion in 2025 and is forecast to reach USD 4.74 billion by 2030, reflecting a 6.83% CAGR over 2025-2030.
Demand is advancing because high-performance electric vehicles and grid storage batteries require anode materials that permit faster charging, longer range, and consistent cycle life. At the same time, electric-arc-furnace (EAF) steelmakers rely on graphite electrodes that tolerate 3,000 °C process temperatures, locking in a large volume baseline for the synthetic graphite market. Manufacturers also target small modular reactors' nuclear-grade components, pushing specialty grades into new revenue pools. Asia-Pacific dominates current production capacity and end-use consumption, while North America is mobilizing public-funded projects to build domestic supply chains. The dual pull of energy transition and metallurgical modernization keeps the synthetic graphite market expanding even though producers face cost inflation and mounting decarbonization pressure.
Global Synthetic Graphite Market Trends and Insights
Increasing Demand for Electric Vehicles
Automakers are ramping battery output to meet tightening emissions rules, driving a steep demand for synthetic graphite anodes that deliver uniform particle size, low impurity levels, and stable performance across thousands of cycles. The U.S. Department of Energy projects a six-fold increase in domestic battery capacity by 2035, a trajectory underpinning NOVONIX's 31,500 t pa Tennessee plant backed by a USD 754 million conditional loan. Panasonic Energy has already locked in a four-year off-take for 10,000 t of North American material to shorten supply lines and curb Scope 3 emissions. New cell chemistries that raise charging rates above 4C count on ultra-pure synthetic particles with tailored porosity, invigorating the premium sub-segment of the synthetic graphite market. Heightened geopolitical risk around Chinese supply is prompting parallel investments in Europe and South Korea, reinforcing multi-regional growth momentum in battery-grade output.
Growing Utilization of Electric ARC Furnace Process for Steel Production
Steelmakers worldwide are shifting away from blast furnaces to electric-arc furnaces to cut operational CO2 intensity, and each EAF relies on consumable graphite electrodes. Regional capex pipelines in India, Vietnam, and the Gulf Cooperation Council add dozens of furnaces rated above 150 t per heat, translating to steady electrode off-take over the next decade. Proper handling, inspection, and alignment remain critical because cracks or oxidation raise specific consumption rates and hinder melt shop yields. Electrode vendors are bundling maintenance advisory services, deepening customer lock-in while capturing incremental revenue. This metallurgical modernization anchors a stable, long-cycle foundation under the synthetic graphite market even as battery demand injects high-growth upside.
High Cost of Production of Graphite
Synthetic graphite prices hover near USD 20,000 t, reflecting the high-temperature graphitization step that consumes energy at 3,000 °C over several weeks. Battery cell designers have responded by blending natural and synthetic grades to cap anode cost while retaining critical rate capability. Producers are investigating new low-temperature catalytic routes such as NETL's coal-waste-derived process that forms turbostratic carbon at 1,500 °C, promising sharper cost curves for future capacity. In the interim, the steep cost delta with natural flake graphite creates margin pressure, especially for mid-tier cell makers competing on price in mass-market vehicles.
Other drivers and restraints analyzed in the detailed report include:
- Faster-Charging Premium EV Models Requiring Ultra-High-Purity Anodes
- Surge in Ultra-High-Power EAF Installations in Asia and the Middle-East and Africa
- Strict Environmental Regulations
For complete list of drivers and restraints, kindly check the Table Of Contents.
Segment Analysis
Metallurgy retained 49% of the synthetic graphite market size in 2024, underpinned by steady electrode consumption in long-cycle steel production. Each tonne of liquid steel in an EAF consumes 1.8-2.2 kg of electrodes, guaranteeing recurrent replacement demand. Yet batteries represent the fastest-growing application, posting an 8.39% CAGR outlook as EV and stationary storage installations rise. Battery demand is moving anode quality specifications higher, accelerating continuous-mixing and micron-level classification investments at synthetic graphite plants.
The Synthetic Graphite Market Report Segments the Industry by Application (Batteries, Metallurgy, and More ), Product Type (Graphite Anode, Graphite Block, and Other Types), End-User Industry (Automotive, Steel and Metals, Energy and Power, Electronics and Electrical, and More), and Geography (Asia-Pacific, North America, Europe, South America, and Middle-East and Africa).
Geography Analysis
Asia-Pacific commands 56% of the synthetic graphite market and is expanding at a 7.67% CAGR through 2030, sustained by China's 77% share of global graphite output in 2023 and regional EAF expansions. Beijing's late-2023 export licensing regime for high-purity graphite has heightened supply-chain risk, motivating South Korean, Japanese, and Indian cell makers to secure alternative sources.
North America is experiencing an unprecedented re-shoring wave. The U.S. Department of Energy's conditional USD 754 million loan to NOVONIX enables a 31,500-t pa Tennessee plant that can serve 325,000 EVs annually, reducing import reliance. Parallel research and development at the National Energy Technology Laboratory converts coal waste to battery-grade graphite at lower temperatures, hinting at a cost-competitive, vertically-integrated supply chain.
Europe focuses on sustainability leadership. Vianode's renewable-powered pilot line in Norway records emissions of 1.9 kg CO2 kg-1 today and targets 1.0 kg by 2030. Germany and France are nurturing lignin-to-carbon programs that could introduce bio-based feedstocks, diversifying raw-material risk and reinforcing the synthetic graphite market's low-carbon pivot.
- Anovion LLC
- Asbury Carbons
- BTR New Material Group Co., Ltd.
- GrafTech International
- Graphit Kropfmuhl GmbH
- Graphite India Limited
- HEG Limited
- Imerys
- Mersen
- Mitsubishi Chemical Group Corporation
- Nippon Carbon Co Ltd.
- NOVONIX Ltd.
- Resonac Holdings Corporation
- SGL Carbon
- Shanghai PTL New Energy Technology Co., Ltd.
- Shanghai Shanshan Technology Co., Ltd.
- Superior Graphite
- Tokai COBEX GmbH
- Vianode
Additional Benefits:
- The market estimate (ME) sheet in Excel format
- 3 months of analyst support
TABLE OF CONTENTS
1 Introduction
- 1.1 Study Assumptions and Market Definition
- 1.2 Scope of the Study
2 Research Methodology
3 Executive Summary
4 Market Landscape
- 4.1 Market Overview
- 4.2 Market Drivers
- 4.2.1 Increasing Demand for Electric Vehicles
- 4.2.2 Growing Utilization of Electric ARC Furnace Process for Steel Production
- 4.2.3 Faster-Charging Premium EV Models Requiring Ultra-High-Purity Anodes
- 4.2.4 Surge in Ultra-High-Power EAF Installations in Asia and Middle East Africa
- 4.2.5 Advanced Modular Reactors Reviving Nuclear-Grade Graphite Demand
- 4.3 Market Restraints
- 4.3.1 High Cost of Production of Graphite
- 4.3.2 Price Gap with Natural Graphite Driving OEM Anode Blends
- 4.3.3 Strict Environmental Regulations
- 4.4 Value Chain Analysis
- 4.5 Porter's Five Forces
- 4.5.1 Bargaining Power of Suppliers
- 4.5.2 Bargaining Power of Buyers
- 4.5.3 Threat of New Entrants
- 4.5.4 Threat of Substitutes
- 4.5.5 Degree of Competition
5 Market Size and Growth Forecasts (Value and Volume)
- 5.1 By Application
- 5.1.1 Batteries
- 5.1.2 Metallurgy
- 5.1.3 Parts and Components
- 5.1.4 Nuclear
- 5.1.5 Others
- 5.2 By Product Type
- 5.2.1 Graohite Anode
- 5.2.2 Graphite Block
- 5.2.3 Other Types
- 5.3 By End-User Industry
- 5.3.1 Automotive
- 5.3.2 Steel and Metals
- 5.3.3 Energy and Power
- 5.3.4 Electronics and Electrical
- 5.3.5 Chemical and Petrochemical
- 5.3.6 Aerospace and Defense
- 5.3.7 Others
- 5.4 By Geography
- 5.4.1 Asia-Pacific
- 5.4.1.1 China
- 5.4.1.2 India
- 5.4.1.3 Japan
- 5.4.1.4 South Korea
- 5.4.1.5 Indonesia
- 5.4.1.6 Malaysia
- 5.4.1.7 Thailand
- 5.4.1.8 Vietnam
- 5.4.1.9 Rest of Asia-Pacific
- 5.4.2 North America
- 5.4.2.1 United States
- 5.4.2.2 Canada
- 5.4.2.3 Mexico
- 5.4.3 Europe
- 5.4.3.1 Germany
- 5.4.3.2 United Kingdom
- 5.4.3.3 France
- 5.4.3.4 Italy
- 5.4.3.5 Spain
- 5.4.3.6 Nordics
- 5.4.3.7 Russia
- 5.4.3.8 Rest of Europe
- 5.4.4 South America
- 5.4.4.1 Brazil
- 5.4.4.2 Argentina
- 5.4.4.3 Colombia
- 5.4.5 Middle-East and Africa
- 5.4.5.1 Saudi Arabia
- 5.4.5.2 United Arab Emirates
- 5.4.5.3 South Africa
- 5.4.5.4 Nigeria
- 5.4.5.5 Egypt
- 5.4.5.6 Rest of Middle-East and Africa
- 5.4.1 Asia-Pacific
6 Competitive Landscape
- 6.1 Market Concentration
- 6.2 Strategic Moves
- 6.3 Market Share Analysis
- 6.4 Company Profiles (includes Global level Overview, Market level overview, Core Segments, Financials as available, Strategic Information, Market Rank/Share, Products and Services, and Recent Developments)
- 6.4.1 Anovion LLC
- 6.4.2 Asbury Carbons
- 6.4.3 BTR New Material Group Co., Ltd.
- 6.4.4 GrafTech International
- 6.4.5 Graphit Kropfmuhl GmbH
- 6.4.6 Graphite India Limited
- 6.4.7 HEG Limited
- 6.4.8 Imerys
- 6.4.9 Mersen
- 6.4.10 Mitsubishi Chemical Group Corporation
- 6.4.11 Nippon Carbon Co Ltd.
- 6.4.12 NOVONIX Ltd.
- 6.4.13 Resonac Holdings Corporation
- 6.4.14 SGL Carbon
- 6.4.15 Shanghai PTL New Energy Technology Co., Ltd.
- 6.4.16 Shanghai Shanshan Technology Co., Ltd.
- 6.4.17 Superior Graphite
- 6.4.18 Tokai COBEX GmbH
- 6.4.19 Vianode
7 Market Opportunities and Future Outlook
- 7.1 White-Space and Unmet-Need Assessment
- 7.2 Bio-graphite as a Sustainable Resource for Battery Material
 全球合成石墨市場規模、佔有率、趨勢和成長分析報告(2026-2034)合成石墨市場規模、佔有率、成長及全球產業分析:按類型和應用分類,區域洞察及2026-2034年預測
 2026年全球合成石墨材料市場報告
 石墨石油焦市場按產品類型、純度等級、應用和終端用戶產業分類-2026-2032年全球預測
 合成石墨市場規模、佔有率及成長分析(按產品、應用、等級、最終用戶及地區分類)-2026-2033年產業預測
 美國合成石墨市場規模、佔有率和趨勢分析報告:按產品、應用和細分市場預測(2025-2033 年)合成石墨市場規模、佔有率、趨勢分析報告:按產品、應用、地區、細分市場預測,2025-2030 年
 人造石墨市場,規模,佔有率,趨勢,產業分析報告:各產品,各用途,各地區,2025年~2034年的市場預測
 2025-2029年全球合成石墨市場全球合成石墨市場規模(按產品類型、最終用戶產業、應用、區域範圍和預測)