


 |
市場調查報告書
商品編碼
1850987
第三方物流:市場佔有率分析、行業趨勢、統計數據和成長預測(2025-2030 年)3PL - Market Share Analysis, Industry Trends & Statistics, Growth Forecasts (2025 - 2030) |
||||||
※ 本網頁內容可能與最新版本有所差異。詳細情況請與我們聯繫。
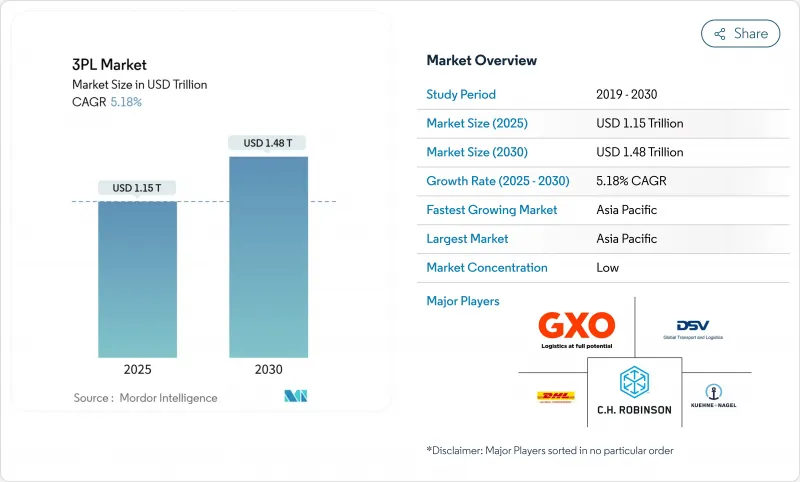
預計到 2025 年,第三方物流市場規模將達到 1.15 兆美元,到 2030 年將達到 1.48 兆美元。
目前,近55%的收入來自輕資產供應商,這些供應商透過合作夥伴而非擁有車輛或倉庫來建立網路。這種模式降低了資本風險,並使營運商能夠根據貿易流量的波動靈活調整運力。亞太地區佔全球第三方物流市場41.3%的佔有率,這主要得益於電子商務的擴張以及生產向印度、越南和印尼的轉移。整合即時視覺性、數位化貨運匹配和倉儲自動化的供應商擁有速度和成本優勢,從而削弱了速度較慢的競爭對手。墨西哥的近岸外包、歐洲的綠色物流法規以及北美對生命科學的關注,都在提高服務要求,推動該行業縮短合約期限並加大對數據豐富型平台的投資。
全球第三方物流市場趨勢與洞察
隨著電子商務規模的擴大,當日履約加快。
新興市場的線上零售蓬勃發展,消費者越來越希望在數小時內而非數天內收到商品。為了因應這一趨勢,物流供應商正在人口密集的社區建立在超當地語系化配送中心,縮短幹線運輸距離,並提高配送密度。這種轉變迫使第三方物流 (3PL) 營運商最佳化路線規劃系統,增加二輪車輛以緩解擁塞路段,並採用雲端訂單管理系統實現即時分類。一些專業的房地產信託公司正在將小型街區改造成配備穿梭巴士系統和協作機器人的多層履約中心。
原始設備製造商的近岸外包策略催生了跨境穿梭貨運
2022年至2023年間,墨西哥將超越中國,成為美國最大的貿易夥伴,每月貨物吞吐量將達到4,756億美元,貨運卡車運輸量約20,900輛。蒙特雷附近和巴希奧走廊沿線正在建造新的工業,預計到2025年以後,貨運交通仍將保持暢通。連接供應商工廠和美國配送中心的短途高頻環線——穿梭車道——如今已支援邊境兩側的專用牽引車、拖車和短途運輸服務的年度合約。第三方物流市場領導者正在增設雙語控制塔、即時邊境滯留追蹤系統和雙重合規報關服務,以縮短貨物停留時間。鐵路和公路聯運也日益增多,這不僅降低了每次運輸的二氧化碳排放,也確保了可預測的運輸時間表。
港口擁塞導致成本波動
主要港口的積壓導致海運即期運價和底盤滯期費顯著波動。托運人現在更傾向於簽訂季度合約而非多年期協議,這為緩解港口堵塞留出了空間。第三方物流供應商透過預留內陸溢流堆場空間和部署臨時轉運站來規避風險,以便當天將貨物轉運至鐵路。來自碼頭操作系統的即時數據流指導動態艙位預訂,確保卡車僅在集裝箱準備就緒後才到達。
細分市場分析
2024年,國內運輸管理將佔第三方物流市場規模的45%(約5,220億美元),預計2030年將以每年5.9%的速度成長。基於應用程式的貨運平台將即時價格資訊輸入競標引擎,提高了首次驗收率,降低了空開率。電子商務當日配送路線和區域化履約配送中心的推出,正在推動對點對點幹線運輸和跨境循環取貨的需求。
第三方物流 (3PL) 市場在國際運輸管理領域的成長也放緩,地緣政治風險和不穩定的海運時刻表使規劃變得複雜。增值倉儲和配送受惠於庫存分散化。零售商將庫存放置在更靠近客戶群的地方,迫使營運商對現有建築物維修,配備高密度穿梭式貨架和現場退貨處理線。雖然公路運輸仍然是主要的運輸方式,但多式聯運鐵路的佔有率正在不斷成長,其線路總長超過 900 公里,可靠性也開始與公路運輸相媲美。
區域分析
亞太地區佔第三方物流市場收入的41.3%,年複合成長率高達6.0%,位居該地區之首。製造地持續向中國以外地區多元化發展,形成一條從胡志明市延伸至曼谷和深水港的多式聯運走廊。新加坡的數位化清關平台已將清關時間縮短至兩小時以內,印尼的電子商務小包裹量預計自2022年以來將成長三倍,因此需要新建自動化分類中心。日本綠色港口計畫下的資本計劃將增加低溫運輸泊位,並實現疫苗有效載荷的直接進口。
北美是第三方物流 (3PL) 的第二大市場,近岸外包正在再形成其格局。德州德克薩斯州的倉庫庫存量如今已超過薩凡納港。短途多式聯運鏈正在消除空車運輸,而透過 CPKC 網路提供的統一鐵路服務則使單程運輸節省了一整天的時間。司機短缺促使車隊採用滑單調度和遠端控制的場內牽引車,節省工時並提高周轉率。
歐洲第三方物流市場正努力應對歐盟擴大後的排放交易體系所帶來的排放壓力。航運公司必須購買排放,以涵蓋其2025年70%的貨運量。而使用零排放電力火車頭的短程航線,正將貨物從海運轉移到鐵路運輸。 FuelEU海事法規和ReFuelEU航空法規進一步收緊了監管,迫使承運商採用低碳燃料混合物。能夠提供經認證的減排記錄的供應商,可以與那些面臨氣候變遷資訊揭露壓力的品牌簽訂合約。
其他福利:
- Excel格式的市場預測(ME)表
- 3個月的分析師支持
目錄
第1章 引言
- 研究假設和市場定義
- 調查範圍
第2章調查方法
第3章執行摘要
第4章 市場情勢
- 市場概覽
- 市場促進因素
- 電子商務的擴張推動了新興國家對當日配送的需求。
- OEM廠商的離岸外包策略為北美跨境貨運創造了機會
- 已開發國家藥品低溫運輸外包業務快速成長
- 政府的綠色物流法規(例如歐盟的「Fit-for-55」標準)將推動對碳中和解決方案的需求。
- 科技業轉向直接面對消費者模式的轉變需要多租戶資料中心
- 全通路雜貨店的興起推動了都市區的微型倉配交易。
- 市場限制
- 港口堵塞導致的成本波動會縮短合約期限。
- 經合組織國家駕駛人和倉庫工人短缺推高了營業利潤率
- 一線物流中心工業地產成本上漲,對利潤率帶來壓力。
- 跨境資料儲存規則限制了雲端WMS部署
- 價值/供應鏈分析
- 技術概覽(物聯網、人工智慧等)
- 主要政府法規和舉措
- 電子商務業務洞察
- 倉儲市場趨勢
- 需求趨勢分析(CEP、最後一公里、低溫運輸等)
- 波特五力模型
- 新進入者的威脅
- 買方的議價能力
- 供應商的議價能力
- 替代品的威脅
- 競爭對手之間的競爭
- 地緣政治事件如何影響市場
第5章 市場規模與成長預測
- 透過服務
- 國內運輸管理(DTM)
- 路
- 鐵路
- 航空
- 水道
- 國際運輸管理(ITM)
- 路
- 鐵路
- 航空
- 水道
- 加值倉儲及配送 (VAWD)
- 國內運輸管理(DTM)
- 最終用戶
- 車
- 能源與公共產業
- 製造業
- 生命科學與醫療保健
- 技術與電子
- 零售與電子商務
- 消費品和快速消費品
- 飲食
- 其他
- 透過物流模型
- 輕資產(管理型)
- 資產導向型(自有車隊和倉庫)
- 混合
- 按地區
- 北美洲
- 美國
- 加拿大
- 墨西哥
- 南美洲
- 巴西
- 阿根廷
- 智利
- 其他南美洲
- 歐洲
- 德國
- 英國
- 法國
- 西班牙
- 義大利
- 荷蘭
- 俄羅斯
- 其他歐洲地區
- 亞太地區
- 中國
- 印度
- 日本
- 韓國
- 新加坡
- 越南
- 印尼
- 澳洲
- 亞太其他地區
- 中東
- 阿拉伯聯合大公國
- 沙烏地阿拉伯
- 土耳其
- 以色列
- 其他中東地區
- 非洲
- 南非
- 埃及
- 奈及利亞
- 肯亞
- 其他非洲地區
- 北美洲
第6章 競爭情勢
- 策略趨勢
- 市佔率分析
- 公司簡介
- DHL Supply Chain and Global Forwarding
- Kuehne+Nagel International AG
- GXO Logistics
- CH Robinson Worldwide Inc.
- DSV A/S
- Nippon Express Holdings
- Sinotrans Ltd.
- CEVA Logistics(CMA CGM)
- XPO Logistics Inc.
- FedEx Logistics
- UPS Supply Chain Solutions
- GEODIS
- Kerry Logistics Network
- Yusen Logistics(NYK)
- Hitachi Transport System(LOGISTEED)
- JB Hunt Transport Services Inc.
- CJ Logistics
- Samsung SDS
- Americold Logistics LLC
- Penske Logistics
- Expeditors
第7章 市場機會與未來展望
The 3PL market size is valued at USD 1.15 trillion in 2025 and is forecast to climb to USD 1.48 trillion by 2030, delivering a steady 5.18% CAGR over the period.
Close to 55% of current revenue sits with asset-light providers that orchestrate networks through partners rather than owning fleets or warehouses. This model reduces capital risk and lets operators flex capacity when trade flows swing. Asia-Pacific anchors the global 3PL market with 41.3% of revenue, propelled by e-commerce expansion and outward shifts in manufacturing that draw production to India, Vietnam, and Indonesia. Technology remains the decisive lever: providers that integrate real-time visibility, digital freight matching, and warehouse automation gain speed and cost advantages hard for slower rivals to match. Near-shoring into Mexico, green logistics mandates in Europe, and specialized life-science flows in North America together tighten service requirements, pushing the sector toward shorter contracts and deeper investment in data-rich platforms.
Global 3PL Market Trends and Insights
E-commerce scale-up accelerating same-day fulfillment
Online retail in emerging economies is rapidly growing, and shoppers are increasingly expecting delivery in hours rather than days. Providers answer by planting hyperlocal hubs beside dense neighborhoods, trimming linehaul distance, and raising delivery density. These shifts force 3PL market operators to fine-tune route planning engines, expand two-wheeler fleets for congested streets, and adopt cloud order-management capable of real-time slot scheduling. Capital flows follow the demand: specialty real-estate trusts are converting small city plots into multi-story micro-fulfillment sites outfitted with shuttle systems and collaborative robots.
OEM near-shoring strategies creating cross-border shuttle freight
Mexico surpassed China as the United States' top trading partner between 2022 and 2023, handling USD 475.6 billion in goods and driving roughly 20,900 loaded truck crossings each month. New industrial parks under construction near Monterrey and along the Bajio corridor will keep freight taps open well past 2025. Shuttle lanes-short, high-frequency loops linking supplier plants to U.S. distribution centers-now underpin annual contracts for dedicated tractors, trailers, and dray service on both sides of the border. 3PL market leaders add bilingual control towers, real-time border-wait tracking, and dual-compliance customs brokerage to squeeze dwell times. Rail-truck intermodal pairings are rising too, reducing CO2 emissions per move and locking in predictable transit schedules.
Port congestion-induced cost volatility
Backlogs at major gateways spur wide swings in ocean spot rates and chassis detention fees. Shippers now prefer rolling quarterly agreements instead of multi-year pacts, keeping room to maneuver when port dwell blows out. 3PL market providers hedge by securing overflow yard space inland and deploying pop-up trans-load sites to flip cargo to rail the same day. Real-time data feeds from terminal operating systems guide dynamic slot booking, so trucks arrive only when a container sits wheels-ready.
Other drivers and restraints analyzed in the detailed report include:
- Pharmaceutical cold-chain outsourcing surge
- Government green-logistics mandates boosting carbon-neutral solutions
- Driver and warehouse labor scarcity
For complete list of drivers and restraints, kindly check the Table Of Contents.
Segment Analysis
Domestic Transportation Management captured 45% of the 3PL market size in 2024-equal to nearly USD 522 billion-and is forecast to grow 5.9% annually through 2030. App-based freight platforms feed real-time prices into tender engines, raising primary acceptance rates and shaving empty-mile percentages. The launch of same-day e-commerce routes and regionalized micro-fulfillment footprints intensifies demand for point-to-point linehauls and milk-run collections inside national borders.
The 3PL market also sees International Transportation Management weather softer growth as geopolitical risk and volatile ocean schedules complicate planning. Value-Added Warehousing and Distribution gains from inventory decentralization: retailers place stock closer to customer clusters, pushing operators to retrofit buildings with high-density shuttle racking and on-site returns processing lines. Road remains the dominant mode, but intermodal rails capture share on lanes longer than 900 kilometers where reliability now rivals trucking.
The 3PL Market Report is Segmented by Service (Domestic Transportation Management, International Transportation Management, and More), by End User (Automotive, Energy and Utilities, Manufacturing and More), by Logistics Model (Asset-Light, Asset-Heavy, and Hybrid), by Region (North America, South America, Europe, Asia-Pacific and More). The Market Forecasts are Provided in Terms of Value (USD).
Geography Analysis
Asia-Pacific retains 41.3% of 3PL market revenue and posts a region-best 6.0% CAGR. Manufacturing bases continue to diversify beyond China, sparking multimodal corridors from Ho Chi Minh City to Bangkok and onward to deepwater ports. Digital customs platforms in Singapore cut clearance time to under two hours, while Indonesia's e-commerce parcel volumes have tripled since 2022, demanding new automated sortation centers. Capital projects under Japan's Green Ports plan add cold-chain berth space, enabling direct imports of vaccine payloads.
North America ranks second in the 3PL market size and is being reshaped by near-shoring. Laredo, Texas, now hosts more warehouse stock than the Port of Savannah as shippers stage goods for rapid continental distribution. Short-haul intermodal chains reduce empty chassis runs, and unified rail service via the CPKC network trims single-crossing transit by a full day. Driver shortages push fleets toward slip-seat scheduling and remote-controlled yard tractors, lifting asset turns while saving labor hours.
Europe's 3PL market wrestles with emissions costs under the expanded EU Emissions Trading System. Shipping lines must purchase allowances covering 70% of vessel output in 2025, nudging cargo from ocean to rail on short-sea routes where electric locomotives claim zero-emission credits. The FuelEU Maritime and ReFuelEU Aviation regulations add further discipline, compelling carriers to blend low-carbon fuels. Providers that document certified reductions secure contracts with brands under pressure to meet climate disclosures.
- DHL Supply Chain and Global Forwarding
- Kuehne + Nagel International AG
- GXO Logistics
- C.H. Robinson Worldwide Inc.
- DSV A/S
- Nippon Express Holdings
- Sinotrans Ltd.
- CEVA Logistics (CMA CGM)
- XPO Logistics Inc.
- FedEx Logistics
- UPS Supply Chain Solutions
- GEODIS
- Kerry Logistics Network
- Yusen Logistics (NYK)
- Hitachi Transport System (LOGISTEED)
- J.B. Hunt Transport Services Inc.
- CJ Logistics
- Samsung SDS
- Americold Logistics LLC
- Penske Logistics
- Expeditors
Additional Benefits:
- The market estimate (ME) sheet in Excel format
- 3 months of analyst support
TABLE OF CONTENTS
1 Introduction
- 1.1 Study Assumptions and Market Definition
- 1.2 Scope of the Study
2 Research Methodology
3 Executive Summary
4 Market Landscape
- 4.1 Market Overview
- 4.2 Market Drivers
- 4.2.1 E-commerce Scale-up Accelerating Same-Day Fulfilment Demands in Developing Countries
- 4.2.2 OEM Near-shoring Strategies Creating Cross-Border Shuttle Freight Opportunities in North America
- 4.2.3 Pharmaceutical Cold-Chain Outsourcing Surge in Developed Economies
- 4.2.4 Government Green-Logistics Mandates (e.g., EU Fit-for-55) Boosting 3PL Demand for Carbon-Neutral Solutions
- 4.2.5 High-tech Sector's Shift to Direct-to-Consumer (D2C) Models Requiring Multi-Tenant DCs
- 4.2.6 Rise of Omni-channel Grocery Driving Micro-Fulfilment Contracts in Urban Zones
- 4.3 Market Restraints
- 4.3.1 Port Congestion-Induced Cost Volatility Reducing Contract Durations
- 4.3.2 Driver and Warehouse Labor Scarcity in OECD Economies Inflating Operating Margins
- 4.3.3 Soaring Industrial Real-Estate Costs in Tier-1 Logistics Hubs Compressing 3PL Margins
- 4.3.4 Cross-border Data-Residency Rules Limiting Cloud WMS Roll-outs
- 4.4 Value / Supply-Chain Analysis
- 4.5 Technology Snapshot (IoT, AI, etc.)
- 4.6 Key Government Regulations and Initiatives
- 4.7 Insights into E-commerce Business
- 4.8 Warehousing Market Trends
- 4.9 Demand Trend Analysis (CEP, Last-Mile, Cold-Chain etc.)
- 4.10 Porter's Five Forces
- 4.10.1 Threat of New Entrants
- 4.10.2 Bargaining Power of Buyers
- 4.10.3 Bargaining Power of Suppliers
- 4.10.4 Threat of Substitutes
- 4.10.5 Intensity of Competitive Rivalry
- 4.11 Impact of Geopolitical Events on the Market
5 Market Size & Growth Forecasts (Value)
- 5.1 By Service
- 5.1.1 Domestic Transportation Management (DTM)
- 5.1.1.1 Roadways
- 5.1.1.2 Railways
- 5.1.1.3 Airways
- 5.1.1.4 Waterways
- 5.1.2 International Transportation Management (ITM)
- 5.1.2.1 Roadways
- 5.1.2.2 Railways
- 5.1.2.3 Airways
- 5.1.2.4 Waterways
- 5.1.3 Value-Added Warehousing and Distribution (VAWD)
- 5.1.1 Domestic Transportation Management (DTM)
- 5.2 By End User
- 5.2.1 Automotive
- 5.2.2 Energy and Utilities
- 5.2.3 Manufacturing
- 5.2.4 Life Sciences and Healthcare
- 5.2.5 Technology and Electronics
- 5.2.6 Retail and E-commerce
- 5.2.7 Consumer Goods and FMCG
- 5.2.8 Food and Beverages
- 5.2.9 Others
- 5.3 By Logistics Model
- 5.3.1 Asset-Light (Management-Based)
- 5.3.2 Asset-Heavy (Own Fleet and Warehouses)
- 5.3.3 Hybrid
- 5.4 By Region
- 5.4.1 North America
- 5.4.1.1 United States
- 5.4.1.2 Canada
- 5.4.1.3 Mexico
- 5.4.2 South America
- 5.4.2.1 Brazil
- 5.4.2.2 Argentina
- 5.4.2.3 Chile
- 5.4.2.4 Rest of South America
- 5.4.3 Europe
- 5.4.3.1 Germany
- 5.4.3.2 United Kingdom
- 5.4.3.3 France
- 5.4.3.4 Spain
- 5.4.3.5 Italy
- 5.4.3.6 Netherlands
- 5.4.3.7 Russia
- 5.4.3.8 Rest of Europe
- 5.4.4 Asia-Pacific
- 5.4.4.1 China
- 5.4.4.2 India
- 5.4.4.3 Japan
- 5.4.4.4 South Korea
- 5.4.4.5 Singapore
- 5.4.4.6 Vietnam
- 5.4.4.7 Indonesia
- 5.4.4.8 Australia
- 5.4.4.9 Rest of Asia-Pacific
- 5.4.5 Middle East
- 5.4.5.1 United Arab Emirates
- 5.4.5.2 Saudi Arabia
- 5.4.5.3 Turkey
- 5.4.5.4 Israel
- 5.4.5.5 Rest of Middle East
- 5.4.6 Africa
- 5.4.6.1 South Africa
- 5.4.6.2 Egypt
- 5.4.6.3 Nigeria
- 5.4.6.4 Kenya
- 5.4.6.5 Rest of Africa
- 5.4.1 North America
6 Competitive Landscape
- 6.1 Strategic Moves
- 6.2 Market Share Analysis
- 6.3 Company Profiles (includes Global level Overview, Market level overview, Core Segments, Financials as available, Strategic Information, Market Rank/Share for key companies, Products and Services, and Recent Developments)
- 6.3.1 DHL Supply Chain and Global Forwarding
- 6.3.2 Kuehne + Nagel International AG
- 6.3.3 GXO Logistics
- 6.3.4 C.H. Robinson Worldwide Inc.
- 6.3.5 DSV A/S
- 6.3.6 Nippon Express Holdings
- 6.3.7 Sinotrans Ltd.
- 6.3.8 CEVA Logistics (CMA CGM)
- 6.3.9 XPO Logistics Inc.
- 6.3.10 FedEx Logistics
- 6.3.11 UPS Supply Chain Solutions
- 6.3.12 GEODIS
- 6.3.13 Kerry Logistics Network
- 6.3.14 Yusen Logistics (NYK)
- 6.3.15 Hitachi Transport System (LOGISTEED)
- 6.3.16 J.B. Hunt Transport Services Inc.
- 6.3.17 CJ Logistics
- 6.3.18 Samsung SDS
- 6.3.19 Americold Logistics LLC
- 6.3.20 Penske Logistics
- 6.3.21 Expeditors
7 Market Opportunities and Future Outlook
- 7.1 White-space and Unmet-Need Assessment
- 7.2 Emergence of 4PL and Digital Freight Marketplaces
- 7.3 Sustainability and Green Logistics Initiatives
- 7.4 Automation and Robotics in Warehouses
- 7.5 Near-shoring and Regionalisation Impact on Contract Structures
 第三方化學品分銷市場:依產品類型、實體形態、服務及最終用途產業分類-2026-2032年全球市場預測第三方物流(3PL) 軟體市場:2026-2032 年全球市場預測(按應用、部署類型、服務類型、組織規模和最終用戶產業分類)
 第三方化學品分銷市場:按類型、應用和地區分類(2026-2034 年)第三方物流市場:依產品/服務、服務模式、定價模式、運輸方式、應用領域及最終用戶產業分類-2026-2032年全球市場預測
 2026年全球第三方物流(3PL)市場報告
 2026-2030年全球汽車第三者物流市場
 第三方物流軟體市場分析及預測(至2035年):依類型、產品類型、服務、技術、組件、應用、部署類型、最終用戶、功能及解決方案分類
 美國第三方物流:市場佔有率分析、產業趨勢與統計、成長預測(2026-2031)英國第三方物流(3PL):市場佔有率分析、產業趨勢與統計、成長預測(2026-2031)西班牙第三方物流(3PL) 市場:佔有率分析、產業趨勢與統計、成長預測 (2026-2031)