


 |
市場調查報告書
商品編碼
1850399
資料角力:市場佔有率分析、產業趨勢、統計資料、成長預測(2025-2030)Data Wrangling - Market Share Analysis, Industry Trends & Statistics, Growth Forecasts (2025 - 2030) |
||||||
※ 本網頁內容可能與最新版本有所差異。詳細情況請與我們聯繫。
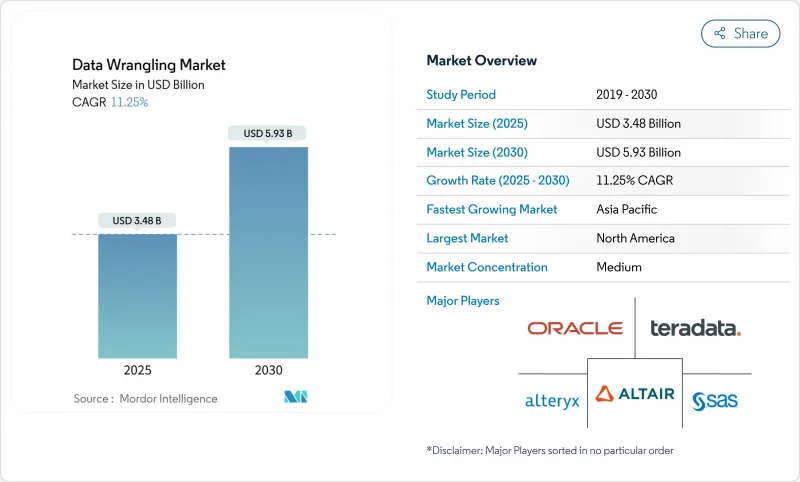
預計到 2025 年,資料角力市場規模將達到 34.8 億美元,到 2030 年將達到 59.3 億美元,年複合成長率為 11.3%。
在整個預測期內,企業數據的加速成長、對即時分析日益成長的需求以及從傳統 ETL 套件向 AI 就緒平台的轉型,仍將是關鍵的成長引擎。供應商正在整合生成式 AI、低程式碼轉換流程和 Lakehouse 連接器,以加快洞察速度,並支援財務、行銷和營運團隊的自助服務。隨著超大規模雲端供應商整合原生資料整理功能,競爭日益激烈,迫使純粹的資料準備公司透過特定領域的自動化和多模態支援來脫穎而出。要求建立強力的管治和血緣關係彙報的新法規,進一步推動了這一趨勢。
全球資料角力市場趨勢與洞察
各行業數據量不斷成長
麥肯錫預測,到2030年,全球資料中心投資將達到6.7兆美元,其中5.2兆美元將直接用於人工智慧工作負載。邊緣設備、5G部署和生產線數位化正在推動資料生成,其處理能力已遠超傳統ETL(提取、轉換和載入)流程。亞太地區到2024年將有12206兆瓦的資料中心投入運作,另有14338兆瓦正在建設中。因此,企業將轉向能夠處理多樣化、高頻次資料流的平台,以因應地方政府制定的各項監管規定。
人工智慧和巨量資料技術的進步推動了自動化。
Alteryx 等供應商正在整合生成式助手,這些助手可以推薦轉換步驟並以自然語言產生摘要。 Gartner 發布的《2025 年代理分析分類法》指出,自主管道能夠自動修正模式漂移並最佳化運算資源分配。 Databricks 收購 Lilac AI 後加速了這一趨勢,在其 Lakehouse 堆疊中添加了基於 LLM 的資料品質評分功能。雖然人工智慧可以提高生產力,但企業為了應對飆升的運算成本,正在透過混合部署策略來限制其應用。
中小企業對資料組織工具的認知度較低
在中亞和西亞,中小企業佔所有企業的98.9%,但由於缺乏數位化技能和預算限制,許多企業仍然依賴電子表格。政策機構正在倡導提供培訓補貼和雲端服務券以提高數位化應用率,而供應商則透過提供免費增值服務和與本地經銷商夥伴關係來打入這一價格敏感型市場。
細分市場分析
至2024年,結構化資料將為資料角力市場貢獻20.2億美元(佔58.2%)。關係表對於事務完整性和核心彙報仍然至關重要。然而,現代資料管道必須將日誌、點選流和感測器資料整合到資料倉儲和湖倉環境中。隨著資料行數的激增,能夠自動產生使用者旅程圖的以SQL為中心的視覺化建置工具可以幫助企業維護管治。
預計2025年至2030年間,非結構化資料市場規模將成長11.6億美元,複合年成長率達12.7%。基於LLM的分類和電腦視覺技術釋放合約、工程圖和視訊幀中的資訊。服務提供者透過提供整合的向量索引、多模態元資料提取以及符合跨境法規的隱私保護型重新編輯模組來脫穎而出。
到2024年,軟體工具將佔據資料角力市場69.5%的佔有率,帶來24.1億美元的授權和訂閱費用。雲端原生套件將資料準備、編目和管治整合到統一的工作空間。供應商將資料準備功能與分析和機器學習工作負載捆綁在一起,使資料角力一種工作流程,而非一項獨立任務,從而提高了其普及率。
預計業務收益將以每年 13.0% 的速度成長,這反映了市場對架構設計、遷移和託管營運的需求。德勤和 Databricks 在銀行業資料即服務 (Data as a Service) 方面的合作,凸顯了專家合作夥伴在現代化舉措中所扮演的重要角色。隨著湖倉和分散式架構的日益成熟,許多公司正在將管道監控外包給專家,由他們根據基於結果的合約提供全天候支援。
區域分析
到2024年,北美將佔全球收入的37.5%,這反映了雲端運算的普及、超大規模資料中心網路的建立以及對人工智慧優先平台的持續創業融資。美國公司是支出的主力軍,微軟2025年第一季。加拿大正在調整自身以適應技能和法律規範,而墨西哥的製造業叢集則正在採用本地湖畔資料中心配置,以符合資料居住法。成本壓力正促使許多公司轉向基於工作負載的分層存儲,將頻繁存取的資料集放置在高速物件存儲中,並將冷資料歸檔在本地。
亞太地區預計將以11.9%的複合年成長率成長,成為資料角力市場成長最快的地區。亞太地區的企業受惠於12,206兆瓦的資料中心、不斷成長的5G用戶群以及中國、印度和印尼的自主雲端服務。本地供應商正與全球平台合作,提供滿足延遲和監管限制的智慧優勢。新加坡和香港強大的電子商務和金融科技生態系統對即時客戶360度解決方案的需求不斷成長,推動了對可擴展就緒引擎的需求。
歐洲是一個成熟但監管嚴格的市場環境,GDPR 和營運風險需求對採購標準做出了明確規定。德國汽車製造商正在實施數位雙胞胎,將工廠遙測資料與企業資源規劃 (ERP) 資料整合。英國銀行正在實現資料溯源自動化,以滿足審慎監理局 (PRA) 的要求。同時,南美洲和中東及非洲地區仍在發展中,但前景廣闊。巴西的開放銀行計畫正在推動 API 流量的成長,而這些流量必須進行標準化;沙烏地阿拉伯的「雲端優先」政策則推動了對兼顧文化和法律因素的在地化資料架構的需求。
其他福利:
- Excel格式的市場預測(ME)表
- 3個月的分析師支持
目錄
第1章 引言
- 研究假設和市場定義
- 調查範圍
第2章調查方法
第3章執行摘要
第4章 市場情勢
- 市場概覽
- 市場促進因素
- 各行業產生的數據量日益增加
- 人工智慧和巨量資料技術的進步推動了自動化。
- 企業用戶對自助式資料準備的需求日益成長。
- 更嚴格的數據品質和管治法規
- 向資料湖屋架構的轉變推動了跨格式資料整理。
- 無程式碼LLM協同駕駛模式的出現加速了變革
- 市場限制
- 中小企業對資料角力工具的認知度較低
- 出於資料安全主導,對敏感資料集實施存取限制
- 大規模雲端資料工程人才短缺。
- 人工智慧增強型資料處理工作負載的雲端運算成本不斷上漲
- 價值鏈分析
- 監管環境
- 技術展望
- 波特五力分析
- 供應商的議價能力
- 買方的議價能力
- 新進入者的威脅
- 替代品的威脅
- 競爭對手之間的競爭
- 投資分析
- 評估宏觀經濟趨勢對市場的影響
第5章 市場規模與成長預測
- 依資料類型
- 結構化資料
- 半結構化數據
- 非結構化數據
- 按組件
- 軟體
- 自助式資料準備平台
- BI/AI 套件中內建了準備模組
- 服務
- 託管服務
- 專業服務/諮詢服務
- 軟體
- 按業務職能
- 金融
- 行銷與銷售
- 手術
- 人力資源
- 法律與合規
- 按最終用戶行業分類
- 資訊科技/通訊
- BFSI
- 零售與電子商務
- 衛生保健
- 政府和公共部門
- 其他終端用戶產業
- 按地區
- 北美洲
- 美國
- 加拿大
- 墨西哥
- 歐洲
- 德國
- 英國
- 法國
- 義大利
- 西班牙
- 其他歐洲地區
- 亞太地區
- 中國
- 日本
- 印度
- 韓國
- 澳洲
- 亞太其他地區
- 南美洲
- 巴西
- 阿根廷
- 其他南美洲
- 中東和非洲
- 中東
- 沙烏地阿拉伯
- 阿拉伯聯合大公國
- 土耳其
- 其他中東地區
- 非洲
- 南非
- 埃及
- 奈及利亞
- 其他非洲地區
- 北美洲
第6章 競爭情勢
- 市場集中度
- 策略趨勢
- 市佔率分析
- 公司簡介
- Alteryx Inc.
- TIBCO Software Inc.
- Altair Engineering Inc.
- Teradata Corporation
- Oracle Corporation
- SAS Institute Inc.
- Datameer Inc.
- DataRobot Inc.
- Cloudera Inc.
- Cambridge Semantics Inc.
- Informatica Inc.
- Microsoft Corporation
- IBM Corporation
- QlikTech International AB(Talend)
- Databricks Inc.
- KNIME GmbH
- Dataiku SAS
- Matillion Ltd.
- Paxata(DataRobot)
- Tamr Inc.
- Astera Software
- Savant Labs
- Airbyte Inc.
第7章 市場機會與未來展望
The data wrangling market size stood at USD 3.48 billion in 2025 and is on track to expand at an 11.3% CAGR to reach USD 5.93 billion by 2030.
Over the forecast period, the accelerating growth of enterprise data, mounting demand for real-time analytics, and the pivot from traditional ETL suites to AI-enabled preparation platforms will remain the principal growth engines. Vendors are embedding generative AI, low-code transformation flows, and lakehouse connectors to shorten time-to-insight and support self-service across finance, marketing, and operations teams. Competitive intensity is rising as hyperscale cloud providers integrate native wrangling features, forcing pure-play data preparation firms to differentiate through domain-specific automation and multimodal support. Emerging regulations that mandate strong governance frameworks and lineage reporting further reinforce adoption momentum, even as escalating compute costs push enterprises toward hybrid deployment models.
Global Data Wrangling Market Trends and Insights
Growing Volumes of Data Generated Across Industries
McKinsey estimates that global data-center outlays will reach USD 6.7 trillion by 2030, of which USD 5.2 trillion relates directly to AI workloads. Edge devices, 5G rollouts, and digitization of manufacturing lines are fueling data creation that outpaces legacy ETL capacity. Asia-Pacific exemplifies this trajectory with 12,206 MW of operational data-center power and 14,338 MW under development in 2024. Enterprises therefore pivot to platforms capable of processing diverse, high-frequency feeds in local jurisdictions that impose sovereignty guardrails.
Advancement in AI and Big-Data Technologies Enabling Automation
Vendors such as Alteryx have embedded generative assistants that recommend transformation steps and generate summaries in natural language. Gartner's 2025 taxonomy of agentic analytics points to autonomous pipelines that self-correct for schema drift and optimize compute allocation. Databricks accelerated this trend by acquiring Lilac AI, adding LLM-based data-quality scoring to its lakehouse stack. While AI raises productivity, organizations temper adoption with hybrid deployment strategies that mitigate compute cost spikes.
Limited Awareness of Data-Wrangling Tools Among SMEs
MSMEs account for 98.9% of all businesses in Central and West Asia, yet scarce digital skills and budget constraints leave many reliant on spreadsheets. Policy bodies advocate training subsidies and cloud vouchers to broaden adoption, while vendors pursue freemium tiers and local reseller partnerships to penetrate this price-sensitive segment.
Other drivers and restraints analyzed in the detailed report include:
- Rising Demand for Self-Service Data Preparation Among Business Users
- Stricter Data-Quality and Governance Regulations
- Escalating Cloud-Compute Costs for Gen-AI-Enhanced Wrangling Workloads
For complete list of drivers and restraints, kindly check the Table Of Contents.
Segment Analysis
Structured data contributed USD 2.02 billion to the data wrangling market size in 2024, equal to 58.2% revenue. Relational tables remain pivotal for transactional integrity and core reporting. Even so, modern pipelines must fuse logs, clickstreams, and sensor feeds into warehouse and lakehouse environments. SQL-centric visual builders that auto-generate lineage maps help enterprises maintain governance as row counts surge.
The unstructured segment is projected to add USD 1.16 billion in incremental revenue between 2025 and 2030 at a 12.7% CAGR, the highest pace among data types. LLM-powered classification and computer vision capabilities unlock insights within contracts, engineering drawings, and video frames. Providers differentiate by offering integrated vector indexing, multimodal metadata extraction, and privacy-aware redaction modules that comply with cross-border regulations.
Software tools held 69.5% of the data wrangling market in 2024, translating to USD 2.41 billion in license and subscription fees. Cloud-native suites weave preparation, cataloging, and governance into one workspace. Vendors cement stickiness by bundling prep functionality inside analytics or ML workloads, turning data wrangling into a workflow rather than a standalone task.
Services revenue, forecast to grow 13.0% annually, reflects demand for architecture design, migration, and managed operations. Deloitte's collaboration with Databricks on Data as a Service for Banking underscores the lift that expert partners provide during modernization initiatives. As lakehouses and distributed fabrics mature, many firms outsource pipeline monitoring to specialists who deliver 24 X 7 support under outcome-based contracts.
The Data Wrangling Market Report is Segmented by Data Type (Structured Data, Semi-Structured Data, and Unstructured Data), Component (Software and Services), Business Function (Finance, Marketing and Sales, Operations, and More), End-User Industry (IT and Telecommunication, BFSI, Retail and E-Commerce, and More), and Geography. The Market Forecasts are Provided in Terms of Value (USD).
Geography Analysis
North America held 37.5% of global revenue in 2024, reflecting deep cloud penetration, established hyperscale data-center networks, and sustained venture funding for AI-first platforms. United States enterprises drive the bulk of spend, illustrated by Microsoft's USD 42.4 billion cloud revenue in Q1 2025 and Fabric's 80% customer surge. Canada aligns with skills and regulatory frameworks, whereas Mexico's manufacturing clusters embrace local lakehouse deployments to comply with data-residency laws. Cost pressures are pushing many firms toward workload-aware tiering that keeps frequently accessed datasets on fast object storage and archives cold data on-premises.
Asia-Pacific is forecast to log an 11.9% CAGR, making it the fastest-growing theater for the data wrangling market. Regional enterprises benefit from the 12,206 MW operational data-center footprint, an expanding 5G user base, and sovereign cloud offerings in China, India, and Indonesia. Local providers collaborate with global platforms to offer in-territory edges that satisfy latency and regulation constraints. Strong e-commerce and fintech ecosystems in Singapore and Hong Kong demand real-time customer 360 solutions, intensifying the call for scalable preparation engines.
Europe holds a mature but regulation-heavy environment where GDPR and operational risk mandates dictate procurement criteria. German automotive manufacturers deploy digital twins that blend plant telemetry with enterprise resource planning data. United Kingdom banks advance lineage automation to satisfy Prudential Regulation Authority expectations. Meanwhile, South America, and Middle East, and Africa remain nascent but promising. Brazil's open banking initiative stimulates API traffic that must be standardized, and Saudi Arabia's cloud-first directives increase demand for localized data fabrics that balance cultural and legal considerations.
- Alteryx Inc.
- TIBCO Software Inc.
- Altair Engineering Inc.
- Teradata Corporation
- Oracle Corporation
- SAS Institute Inc.
- Datameer Inc.
- DataRobot Inc.
- Cloudera Inc.
- Cambridge Semantics Inc.
- Informatica Inc.
- Microsoft Corporation
- IBM Corporation
- QlikTech International AB (Talend)
- Databricks Inc.
- KNIME GmbH
- Dataiku SAS
- Matillion Ltd.
- Paxata (DataRobot)
- Tamr Inc.
- Astera Software
- Savant Labs
- Airbyte Inc.
Additional Benefits:
- The market estimate (ME) sheet in Excel format
- 3 months of analyst support
TABLE OF CONTENTS
1 INTRODUCTION
- 1.1 Study Assumptions and Market Definition
- 1.2 Scope of the Study
2 RESEARCH METHODOLOGY
3 EXECUTIVE SUMMARY
4 MARKET LANDSCAPE
- 4.1 Market Overview
- 4.2 Market Drivers
- 4.2.1 Growing volumes of data generated across industries
- 4.2.2 Advancement in AI and big-data technologies enabling automation
- 4.2.3 Rising demand for self-service data preparation among business users
- 4.2.4 Stricter data-quality and governance regulations
- 4.2.5 Migration to data-lakehouse architectures driving cross-format wrangling
- 4.2.6 Emergence of no-code LLM co-pilots that accelerate transformations
- 4.3 Market Restraints
- 4.3.1 Limited awareness of data-wrangling tools among SMEs
- 4.3.2 Data-security driven access restrictions on sensitive datasets
- 4.3.3 Shortage of cloud data-engineering talent for large-scale wrangling
- 4.3.4 Escalating cloud-compute costs for Gen-AI-enhanced wrangling workloads
- 4.4 Value Chain Analysis
- 4.5 Regulatory Landscape
- 4.6 Technological Outlook
- 4.7 Porter's Five Forces Analysis
- 4.7.1 Bargaining Power of Suppliers
- 4.7.2 Bargaining Power of Buyers
- 4.7.3 Threat of New Entrants
- 4.7.4 Threat of Substitutes
- 4.7.5 Intensity of Competitive Rivalry
- 4.8 Investment Analysis
- 4.9 Assessment of the Impact of Macroeconomic Trends on the Market
5 MARKET SIZE AND GROWTH FORECASTS (VALUE)
- 5.1 By Data Type
- 5.1.1 Structured Data
- 5.1.2 Semi-structured Data
- 5.1.3 Unstructured Data
- 5.2 By Component
- 5.2.1 Software
- 5.2.1.1 Self-service data-preparation platforms
- 5.2.1.2 Embedded prep modules in BI/AI suites
- 5.2.2 Services
- 5.2.2.1 Managed Services
- 5.2.2.2 Professional / Consulting Services
- 5.2.1 Software
- 5.3 By Business Function
- 5.3.1 Finance
- 5.3.2 Marketing and Sales
- 5.3.3 Operations
- 5.3.4 Human Resources
- 5.3.5 Legal and Compliance
- 5.4 By End-user Industry
- 5.4.1 IT and Telecommunication
- 5.4.2 BFSI
- 5.4.3 Retail and E-commerce
- 5.4.4 Healthcare
- 5.4.5 Government and Public Sector
- 5.4.6 Other End-user Industries
- 5.5 By Geography
- 5.5.1 North America
- 5.5.1.1 United States
- 5.5.1.2 Canada
- 5.5.1.3 Mexico
- 5.5.2 Europe
- 5.5.2.1 Germany
- 5.5.2.2 United Kingdom
- 5.5.2.3 France
- 5.5.2.4 Italy
- 5.5.2.5 Spain
- 5.5.2.6 Rest of Europe
- 5.5.3 Asia-Pacific
- 5.5.3.1 China
- 5.5.3.2 Japan
- 5.5.3.3 India
- 5.5.3.4 South Korea
- 5.5.3.5 Australia
- 5.5.3.6 Rest of Asia-Pacific
- 5.5.4 South America
- 5.5.4.1 Brazil
- 5.5.4.2 Argentina
- 5.5.4.3 Rest of South America
- 5.5.5 Middle East and Africa
- 5.5.5.1 Middle East
- 5.5.5.1.1 Saudi Arabia
- 5.5.5.1.2 United Arab Emirates
- 5.5.5.1.3 Turkey
- 5.5.5.1.4 Rest of Middle East
- 5.5.5.2 Africa
- 5.5.5.2.1 South Africa
- 5.5.5.2.2 Egypt
- 5.5.5.2.3 Nigeria
- 5.5.5.2.4 Rest of Africa
- 5.5.1 North America
6 COMPETITIVE LANDSCAPE
- 6.1 Market Concentration
- 6.2 Strategic Moves
- 6.3 Market Share Analysis
- 6.4 Company Profiles (includes Global-level Overview, Market-level overview, Core Segments, Financials as available, Strategic Information, Market Rank/Share for key companies, Products and Services, and Recent Developments)
- 6.4.1 Alteryx Inc.
- 6.4.2 TIBCO Software Inc.
- 6.4.3 Altair Engineering Inc.
- 6.4.4 Teradata Corporation
- 6.4.5 Oracle Corporation
- 6.4.6 SAS Institute Inc.
- 6.4.7 Datameer Inc.
- 6.4.8 DataRobot Inc.
- 6.4.9 Cloudera Inc.
- 6.4.10 Cambridge Semantics Inc.
- 6.4.11 Informatica Inc.
- 6.4.12 Microsoft Corporation
- 6.4.13 IBM Corporation
- 6.4.14 QlikTech International AB (Talend)
- 6.4.15 Databricks Inc.
- 6.4.16 KNIME GmbH
- 6.4.17 Dataiku SAS
- 6.4.18 Matillion Ltd.
- 6.4.19 Paxata (DataRobot)
- 6.4.20 Tamr Inc.
- 6.4.21 Astera Software
- 6.4.22 Savant Labs
- 6.4.23 Airbyte Inc.
7 MARKET OPPORTUNITIES AND FUTURE OUTLOOK
- 7.1 White-space and Unmet-Need Assessment
 資料整理市場:2026-2032年全球市場預測(依產品類型、通路、應用及最終用戶分類)
 資料整理市場規模、佔有率、趨勢和預測:按組件、部署類型、組織規模、業務職能、行業和地區分類(2026-2034 年)
 2026年全球數據格式化平台市場報告2026年全球資料角力市場報告
 全球資料角力市場規模、佔有率、趨勢和成長分析報告(2026-2034)
 資料角力市場-全球產業規模、佔有率、趨勢、機會和預測:按組件、部署模型、企業模型、最終用戶、地區和競爭格局分類,2021-2031年
 2026-2030年全球資料角力市場
 資料角力市場規模、佔有率和趨勢分析報告:按組件、部署、公司規模、最終用戶、地區和細分市場進行預測,2025 年至 2033 年
 資料角力市場規模、佔有率及成長分析(按組件、部署模型、垂直產業、組織規模、業務功能和地區)-2025 年至 2032 年產業預測
 全球資料角力市場規模、佔有率、趨勢分析報告:按部署模式、組件、業務功能、組織規模、垂直和地區分類的展望和預測,2024 年至 2031 年