


 |
市場調查報告書
商品編碼
1850346
欺敵技術:市場佔有率分析、行業趨勢、統計數據和成長預測(2025-2030 年)Deception Technology - Market Share Analysis, Industry Trends & Statistics, Growth Forecasts (2025 - 2030) |
||||||
※ 本網頁內容可能與最新版本有所差異。詳細情況請與我們聯繫。
預計到 2025 年,欺敵技術市場規模將累計24.1 億美元,到 2030 年將擴大到 45 億美元,複合年成長率為 13.3%。
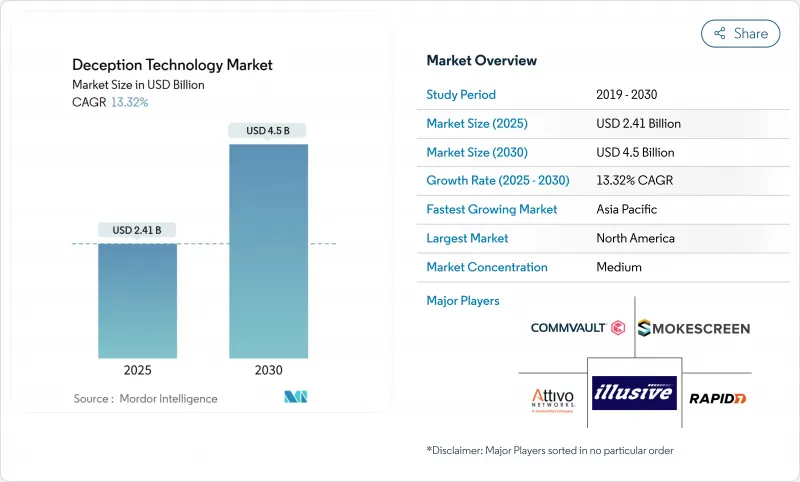
零時差攻擊、人工智慧驅動的深度造假詐騙的興起,以及雲端原生工作負載的擴展,正迫使安全團隊採用預警控制措施,以便在攻擊者造成損害之前將其從網路內部發現。供應商現在正將誘餌整合到零信任微隔離中,為防禦者提供即使身分或終端遭到洩漏也能正常運作的「絆線」。隨著網路保險公司將主動橫向移動偵測作為保費的先決條件,市場需求也正在加速成長。雖然北美仍引領市場,但隨著多重雲端採用率的激增以及各國監管機構加強資料外洩通知的監管,欺敵技術市場在亞太地區正迅速發展。
全球欺敵技術市場趨勢與洞察
零日漏洞利用和定向高級持續性威脅的激增
國家支持的組織正在利用人工智慧實現自動化偵察,以遠超基於特徵碼的防禦機制適應速度發現新的漏洞。安全與技術研究所指出,自動化偵察縮短了攻擊者的潛伏時間,迫使防禦者重新思考其被動應對策略。欺騙平台利用使用者的好奇心,植入看似可信但實則虛假的資產。欺敵技術市場透過基於攻擊者行為而非威脅情報來源進行偵測,能夠有效抵禦繞過哈希匹配控制的客製化惡意軟體。供應商現在提供預先包裝的誘餌程序,用於工業控制系統和SaaS API,這反映出攻擊者越來越注重操作技術。
不斷擴展的雲端原生工作負載擴大了攻擊面
容器化的無伺服器應用程式可以在幾分鐘內快速啟動和關閉,使安全營運中心無法監控東西向流量。 Zscaler 部署生成式 AI 誘餌,模擬大規模語言模型端點,將攻擊者引誘到儀器的沙箱中。這些誘餌可在 Kubernetes 命名空間內自動擴展,即使底層微服務發生變化,也能為防禦者提供持續的保護。欺敵技術市場利用雲端提供者的元資料API,無需安裝代理程式即可在虛擬私有雲端中部署陷阱。隨著企業採用多重雲端策略,跨供應商的誘餌編配正成為採購標準,尤其是在日誌無法集中儲存在單一區域的受監管行業。
對傳統誘餌系統的持續依賴
許多公司仍在運行幾年前部署的靜態誘餌系統。攻擊者現在可以透過通訊協定特性和運作模式識別此類資產,從而輕鬆繞過它們。這種沉沒成本偏好阻礙了升級到自適應誘餌的進程,而自適應誘餌可以改變操作系統橫幅或自動輪換憑證。傳統的誘餌系統也需要手動分析日誌,消耗了本應集中用於實際攻擊途徑的資源。這些工具很少能產生可操作的警報,導致董事會質疑其投資回報率,並阻礙了新的投資,從而抑制了欺敵技術市場的成長。
細分市場分析
到2024年,本地部署的欺敵技術將佔據67.9%的市場佔有率,這反映出企業需要將高互動的誘餌系統部署在其核心系統附近,以滿足合規性和取證管理的需求。然而,這種管理方式引入了硬體更新周期和變更管理開銷,限制了系統的靈活性。目前規模較小的雲端部署預計到2030年將以15.2%的複合年成長率成長,成為欺敵技術市場中成長最快的領域。雲端基礎的主機對於全球分店部署極具吸引力,因為它們允許在幾分鐘內跨區域啟動誘餌系統。
混合模型應運而生,成為一種切實可行的橋樑,使團隊能夠在本地保留敏感資料庫誘餌,同時將分析和擴展任務卸載到公有雲。隨著多重雲端採用率的提高,買家要求能夠在 AWS、Azure 和 Google Cloud 之間實現統一的視圖,而服務供應商則增加對身分聯合和不可變基礎架構藍圖的投入。這些功能將擴大雲端模組欺敵技術的市場,並使受監管部門相信,即使在責任共用模式下,也能滿足審核控制要求。
大型企業在2024年之前將維持70.2%的收入佔有率,並將繼續專注於API深度、MITRE ATT&CK架構一致性和進階分析,從而完善其功能藍圖。然而,中小企業目前正經歷著14.9%的成長,在欺敵技術市場支出方面超過了大型企業。按資產收費的訂閱式託管欺騙服務降低了准入門檻,並提供適合小型團隊頻寬的客製化警報。
由於雲端主機無需購買硬體,中小企業可以將資金重新投入意識提升計劃中,從而進一步節省成本。對供應商而言,該領域的規模優勢極具吸引力:數千家中型客戶的授權收入相當於少數幾家財富 500 強企業的授權收入。因此,藍圖的重點現在包括低程式碼劇本和自動化誘餌部署,這些功能旨在將新用戶入職時間從數週縮短到數小時,從而擴大中小企業對欺敵技術的市場規模。
欺敵技術市場報告按配置(本地部署和雲端部署)、組織規模(大型企業和中小企業)、服務(託管服務和專業服務)、欺騙技術堆疊(資料安全、應用程式安全、其他)、最終用戶(政府、國防、銀行、金融服務和保險、IT 和通訊、其他)以及地區進行細分。
區域分析
到2024年,北美將佔全球收入的41.8%,這主要得益於諸如CISA關於事件報告的嚴格規定,以及財富100強企業總部在該地區的高度集中,這些企業有能力為專門的控制措施提供資金。聯邦政府合約中對欺騙能力的日益重視,進一步鞏固了該地區在欺敵技術市場的領先地位。
在歐洲,NIS2 指令正穩步推進,不斷擴大需要維護主動威脅偵測程序的營業單位範圍。新興的歐盟雲端服務供應商現在提供符合規範的捆綁產品,這些產品原生整合了欺騙功能,對中型工業設備製造商極具吸引力。
亞太地區持續快速成長,複合年成長率高達13.8%。日本、印度和新加坡政府已啟動津貼計劃,共同資助包含欺騙技術的零信任試點計畫。通訊業者部署5G獨立核心網路擴大了攻擊面,促使通訊業者安裝信令通訊協定誘餌來偵測詐欺性基地台註冊嘗試。這些措施正在擴大該地區欺敵技術的市場。同時,拉丁美洲和中東及非洲地區也開始將欺騙技術融入關鍵基礎設施升級,但預算限制和人才短缺使得短期內難以全面應用。
其他福利:
- Excel格式的市場預測(ME)表
- 3個月的分析師支持
目錄
第1章 引言
- 研究假設和市場定義
- 調查範圍
第2章調查方法
第3章執行摘要
第4章 市場情勢
- 市場概覽
- 市場促進因素
- 零時差攻擊和定向高級持續性威脅(APT)激增
- 雲端原生工作負載的擴展擴大了攻擊面
- 首席資訊安全長 (CISO) 更傾向於使用低摩擦、無代理的發現工具
- 人工智慧生成的深度造假身分攻擊的興起
- 欺騙與零信任微隔離的融合
- 網路保險政策要求主動進行橫向移動檢測
- 市場限制
- 對傳統誘餌系統的深度依賴
- 缺乏具備欺騙技能的保全人員
- 對手利用大規模語言模型偵察來發現誘餌(隱藏在雷達之下)。
- 捆綁式 EDR/XDR 平台會佔用您的預算
- 價值鏈分析
- 監管格局
- 技術展望
- 波特五力分析
- 新進入者的威脅
- 供應商的議價能力
- 買方的議價能力
- 替代品的威脅
- 競爭對手之間的競爭
- 投資分析
- 評估宏觀經濟趨勢對市場的影響
第5章 市場規模與成長預測
- 透過部署
- 本地部署
- 雲
- 按組織規模
- 主要企業
- 小型企業
- 透過服務
- 託管服務
- 專業服務
- 欺騙堆疊
- 資料安全
- 應用程式安全
- 端點安全
- 網路安全
- 最終用戶
- 政府
- 防禦
- BFSI
- 資訊科技/通訊
- 衛生保健
- 其他最終用戶
- 按地區
- 北美洲
- 美國
- 加拿大
- 墨西哥
- 歐洲
- 德國
- 英國
- 法國
- 義大利
- 西班牙
- 俄羅斯
- 其他歐洲地區
- 亞太地區
- 中國
- 日本
- 印度
- 韓國
- 澳洲和紐西蘭
- 其他亞太地區
- 南美洲
- 巴西
- 阿根廷
- 其他南美
- 中東和非洲
- 中東
- 沙烏地阿拉伯
- 阿拉伯聯合大公國
- 土耳其
- 其他中東地區
- 非洲
- 南非
- 奈及利亞
- 其他非洲國家
- 北美洲
第6章 競爭情勢
- 市場集中度
- 策略趨勢
- 市佔率分析
- 公司簡介
- Illusive Networks
- Attivo Networks(SentinelOne)
- Rapid7
- Acalvio Technologies
- CounterCraft
- CyberTrap
- TrapX Security
- Smokescreen Technologies
- Ridgeback Network Defense
- LogRhythm
- WatchGuard Technologies
- Broadcom(Symantec)
- Morphisec
- Fortinet(FortiDeceptor)
- Zscaler
- Microsoft(Security Honeytokens)
- Akamai
- Palo Alto Networks
- Fidelis Cybersecurity
- Commvault(TrapX integration)
第7章 市場機會與未來展望
The deception technology market posted USD 2.41 billion in 2025 and is set to advance at a 13.3% CAGR to USD 4.50 billion by 2030.
Rising zero-day exploits, AI-driven deepfake fraud, and cloud-native workload expansion compel security teams to adopt early-warning controls that spot attackers inside the network before damage occurs. Vendors now weave decoys into zero-trust micro-segmentation, giving defenders tripwires that work even when identities or endpoints are compromised. Demand also accelerates because cyber-insurance carriers require proactive lateral-movement detection as a condition for favorable premiums. Although North America keeps spending leadership, the deception technology market gains rapid momentum in Asia-Pacific as multicloud adoption surges and local regulators tighten breach-notification rules.
Global Deception Technology Market Trends and Insights
Surge in Zero-Day Exploits and Targeted APTs
State-sponsored collectives automate reconnaissance with AI, finding novel vulnerabilities faster than signature-based defenses adapt. The Institute for Security and Technology notes that automated reconnaissance compresses attacker dwell time, forcing defenders to rethink reactive playbooks. Deception platforms insert believable but fake assets that weaponize curiosity; once probed, alerts trigger in seconds while production systems stay untouched. Because detection is based on attacker behavior rather than threat-intelligence feeds, the deception technology market provides resilience against bespoke malware that evades hash-matching controls. Vendors now pre-package decoys for industrial control systems and SaaS APIs, reflecting attacker pivot toward operational technology.
Escalating Cloud-Native Workloads Broaden Attack Surface
Containerized and serverless applications can spin up and down within minutes, leaving security operations centers blind to east-west traffic. Zscaler deploys generative-AI decoys that mimic large-language-model endpoints, luring attackers into instrumented sandboxes. Because decoys scale automatically inside Kubernetes namespaces, defenders gain continuous coverage even as underlying microservices change. The deception technology market capitalizes on cloud providers' metadata APIs to place traps inside virtual private clouds without installing agents. As organizations adopt multi-cloud strategies, cross-provider decoy orchestration becomes a buying criterion, especially in regulated industries that cannot centralize logs in a single region.
Entrenched Reliance on Legacy Honeypots
Many firms still run static honeypots deployed years ago. Attackers now fingerprint such assets through protocol quirks or uptime patterns, bypassing them with ease. This sunk-cost bias delays upgrades to adaptive decoys able to morph operating-system banners or rotate credentials automatically. Legacy honeypots also demand manual log parsing, consuming resources that should focus on real attack paths. Because these tools produce few actionable alerts, boards question ROI, thereby constraining new investment and dampening growth of the deception technology market.
Other drivers and restraints analyzed in the detailed report include:
- CISO Preference for Low-Friction, Agent-Less Detection Tools
- Rise of AI-Generated Deepfake Identity Attacks
- Scarcity of Deception-Skilled SecOps Staff
For complete list of drivers and restraints, kindly check the Table Of Contents.
Segment Analysis
On-premises deployment commanded 67.9% of deception technology market share in 2024, illustrating enterprises' need to keep high-interaction decoys close to crown-jewel systems for compliance and forensic control. That control, however, brings hardware refresh cycles and change-management overhead that limit agility. Cloud deployment contributes a modest slice today but is slated to rise at a 15.2% CAGR through 2030, the fastest pace within the deception technology market. Cloud-based consoles spin up decoys across regions within minutes, making them attractive for global branch rollouts.
Hybrid models emerge as a pragmatic bridge, letting teams place sensitive database decoys on-premises while offloading analysis and scaling tasks to public clouds. As multicloud adoption rises, buyers demand single-pane views across AWS, Azure, and Google Cloud, pushing providers to invest in identity federation and immutable infrastructure blueprints. These capabilities enhance the deception technology market size for cloud modules and convince regulation-bound sectors that shared-responsibility models can still satisfy audit controls.
Large enterprises retained 70.2% revenue share in 2024 and continue shaping feature roadmaps by insisting on API depth, MITRE ATT&CK alignment, and advanced analytics. Yet SMEs now register a 14.9% growth trajectory, outpacing big-company spending within the deception technology market. Subscription-based managed deception services, billed per asset, cut entry barriers and deliver curated alerts that fit smaller teams' bandwidth.
Savings compound because cloud consoles eliminate hardware purchase, allowing SMEs to reallocate capital toward employee awareness programs. For vendors, the segment's scale effect is compelling; thousands of mid-sized customers can equal the license revenue of a handful of Fortune 500 accounts. Consequently, roadmap priorities now include low-code playbooks and automated decoy placement, features designed to compress onboarding from weeks to hours and thereby expand deception technology market size among smaller firms.
The Deception Technology Market Report is Segmented by Deployment (On-Premises and Cloud), Organization Size (Large Enterprises and Small and Medium Enterprises (SMEs)), Service (Managed Services and Professional Services), Deception Stack (Data Security, Application Security, and More), End-User (Government, Defense, BFSI, IT and Telecommunication, and More), and Geography.
Geography Analysis
North America generated 41.8% of revenue in 2024, buoyed by stringent mandates such as CISA's directive on incident reporting and a concentration of Fortune 100 headquarters that can fund specialized controls. Federal contracts increasingly specify deception capabilities, further cementing the region's leadership within the deception technology market.
Europe advances steadily as the NIS2 Directive broadens the scope of entities required to maintain proactive threat-detection programs Local vendors stress data-sovereignty features, ensuring logs stay inside EU borders. Emerging EU cloud providers now embed deception natively, offering compliance-ready bundles that appeal to mid-market industrial manufacturers.
Asia-Pacific remains the fastest-growing territory at 13.8% CAGR. Governments in Japan, India, and Singapore launch grant programs that co-fund zero-trust pilots incorporating deception. Telecom rollouts of 5G standalone cores enlarge attack surfaces, pushing operators to install signaling-protocol decoys that detect rogue base-station registration attempts. These initiatives collectively enlarge deception technology market size in the region. Meanwhile, Latin America and Middle East and Africa start integrating deception into critical-infrastructure revamps, although budget constraints and talent gaps temper near-term uptake.
- Illusive Networks
- Attivo Networks (SentinelOne)
- Rapid7
- Acalvio Technologies
- CounterCraft
- CyberTrap
- TrapX Security
- Smokescreen Technologies
- Ridgeback Network Defense
- LogRhythm
- WatchGuard Technologies
- Broadcom (Symantec)
- Morphisec
- Fortinet (FortiDeceptor)
- Zscaler
- Microsoft (Security Honeytokens)
- Akamai
- Palo Alto Networks
- Fidelis Cybersecurity
- Commvault (TrapX integration)
Additional Benefits:
- The market estimate (ME) sheet in Excel format
- 3 months of analyst support
TABLE OF CONTENTS
1 INTRODUCTION
- 1.1 Study Assumptions and Market Definition
- 1.2 Scope of the Study
2 RESEARCH METHODOLOGY
3 EXECUTIVE SUMMARY
4 MARKET LANDSCAPE
- 4.1 Market Overview
- 4.2 Market Drivers
- 4.2.1 Surge in zero-day exploits and targeted APTs
- 4.2.2 Escalating cloud-native workloads broaden attack surface
- 4.2.3 CISO preference for low-friction, agent-less detection tools
- 4.2.4 Rise of AI-generated deepfake identity attacks
- 4.2.5 Convergence of deception with zero-trust micro-segmentation
- 4.2.6 Cyber-insurance policies demanding proactive lateral-movement detection
- 4.3 Market Restraints
- 4.3.1 Entrenched reliance on legacy honeypots
- 4.3.2 Scarcity of deception-skilled SecOps staff
- 4.3.3 Adversary use of large-language-model recon to spot decoys (under-the-radar)
- 4.3.4 Budget cannibalization by bundled EDR/XDR platforms
- 4.4 Value Chain Analysis
- 4.5 Regulatory Landscape
- 4.6 Technological Outlook
- 4.7 Porter's Five Forces Analysis
- 4.7.1 Threat of New Entrants
- 4.7.2 Bargaining Power of Suppliers
- 4.7.3 Bargaining Power of Buyers
- 4.7.4 Threat of Substitutes
- 4.7.5 Intensity of Competitive Rivalry
- 4.8 Investment Analysis
- 4.9 Assessment of the Impact of Macroeconomic Trends on the Market
5 MARKET SIZE AND GROWTH FORECASTS (VALUE)
- 5.1 By Deployment
- 5.1.1 On-premises
- 5.1.2 Cloud
- 5.2 By Organization Size
- 5.2.1 Large Enterprises
- 5.2.2 Small and Medium Enterprises (SMEs)
- 5.3 By Service
- 5.3.1 Managed Services
- 5.3.2 Professional Services
- 5.4 By Deception Stack
- 5.4.1 Data Security
- 5.4.2 Application Security
- 5.4.3 Endpoint Security
- 5.4.4 Network Security
- 5.5 By End-User
- 5.5.1 Government
- 5.5.2 Defense
- 5.5.3 BFSI
- 5.5.4 IT and Telecommunication
- 5.5.5 Healthcare
- 5.5.6 Other End-Users
- 5.6 By Geography
- 5.6.1 North America
- 5.6.1.1 United States
- 5.6.1.2 Canada
- 5.6.1.3 Mexico
- 5.6.2 Europe
- 5.6.2.1 Germany
- 5.6.2.2 United Kingdom
- 5.6.2.3 France
- 5.6.2.4 Italy
- 5.6.2.5 Spain
- 5.6.2.6 Russia
- 5.6.2.7 Rest of Europe
- 5.6.3 Asia-Pacific
- 5.6.3.1 China
- 5.6.3.2 Japan
- 5.6.3.3 India
- 5.6.3.4 South Korea
- 5.6.3.5 Australia and New Zealand
- 5.6.3.6 Rest of Asia-Pacific
- 5.6.4 South America
- 5.6.4.1 Brazil
- 5.6.4.2 Argentina
- 5.6.4.3 Rest of South America
- 5.6.5 Middle East and Africa
- 5.6.5.1 Middle East
- 5.6.5.1.1 Saudi Arabia
- 5.6.5.1.2 United Arab Emirates
- 5.6.5.1.3 Turkey
- 5.6.5.1.4 Rest of Middle East
- 5.6.5.2 Africa
- 5.6.5.2.1 South Africa
- 5.6.5.2.2 Nigeria
- 5.6.5.2.3 Rest of Africa
- 5.6.1 North America
6 COMPETITIVE LANDSCAPE
- 6.1 Market Concentration
- 6.2 Strategic Moves
- 6.3 Market Share Analysis
- 6.4 Company Profiles (includes Global level Overview, Market level overview, Core Segments, Financials as available, Strategic Information, Market Rank/Share for key companies, Products and Services, and Recent Developments)
- 6.4.1 Illusive Networks
- 6.4.2 Attivo Networks (SentinelOne)
- 6.4.3 Rapid7
- 6.4.4 Acalvio Technologies
- 6.4.5 CounterCraft
- 6.4.6 CyberTrap
- 6.4.7 TrapX Security
- 6.4.8 Smokescreen Technologies
- 6.4.9 Ridgeback Network Defense
- 6.4.10 LogRhythm
- 6.4.11 WatchGuard Technologies
- 6.4.12 Broadcom (Symantec)
- 6.4.13 Morphisec
- 6.4.14 Fortinet (FortiDeceptor)
- 6.4.15 Zscaler
- 6.4.16 Microsoft (Security Honeytokens)
- 6.4.17 Akamai
- 6.4.18 Palo Alto Networks
- 6.4.19 Fidelis Cybersecurity
- 6.4.20 Commvault (TrapX integration)
7 MARKET OPPORTUNITIES AND FUTURE OUTLOOK
- 7.1 White-space and Unmet-need Assessment
 欺騙技術市場-2026-2032年全球市場預測
 欺騙技術市場報告:按欺騙技術堆疊、服務、部署模式、組織規模、最終用戶和地區分類(2026-2034 年)
 全球欺騙技術市場規模、佔有率、趨勢和成長分析報告(2026-2034)欺騙技術市場規模、佔有率、成長及全球產業分析:按類型、應用和地區的洞察,2026-2034年的預測
 欺騙技術市場:按組件、欺騙技術棧和地區分類
 2026年全球欺騙技術市場報告
 欺騙技術市場分析及預測(至2035年):依類型、產品類型、服務、技術、組件、應用、部署類型、最終用戶及功能分類
 欺騙科技市場 - 全球產業規模、佔有率、趨勢、機會、預測:按部署方式、組件、欺騙技術堆疊、最終用戶、地區和競爭對手分類,2021-2031 年
 欺騙技術市場規模、佔有率和成長分析(按組件、欺騙技術棧、部署模式、公司類型、垂直產業和地區分類)-2026-2033年產業預測
 全球欺騙技術市場規模研究,按產品、欺騙堆疊、企業規模、產業垂直和區域預測 2022-2032