


 |
市場調查報告書
商品編碼
1850321
固態硬碟(SSD):市場佔有率分析、產業趨勢、統計數據和成長預測(2025-2030 年)Solid State Drive (SSD) - Market Share Analysis, Industry Trends & Statistics, Growth Forecasts (2025 - 2030) |
||||||
※ 本網頁內容可能與最新版本有所差異。詳細情況請與我們聯繫。
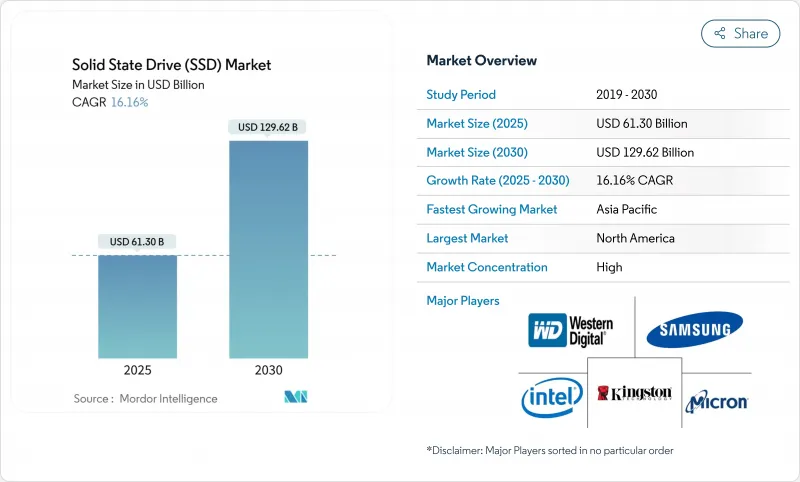
預計到 2025 年,固態硬碟市場規模將達到 613 億美元,到 2030 年將達到 1,296.2 億美元,年複合成長率為 16.16%。
企業級人工智慧訓練叢集需求激增、超大規模資料中心創紀錄的資本支出,以及機械儲存介質向高性能固態陣列的持續轉型,共同推動了這一發展勢頭。隨著資料中心架構師將密度、效率和低延遲置於優先地位,那些能夠將高層NAND快閃記憶體、先進的PCIe介面和精密的散熱設計相結合的供應商將從中受益。目前,NAND快閃記憶體製造商正在調整晶圓生產週期和層間轉換以維持利潤率,因此價格仍處於波動狀態,但強勁的需求訊號允許他們進行選擇性漲價。同時,競爭也在加劇,中國供應商正在擴大國內市場佔有率,而現有供應商則在加速推出高容量QLC快閃記憶體產品和服務導向的韌體更新。
全球固態硬碟 (SSD) 市場趨勢與洞察
資料中心快速採用 NVMe 和 PCIe Gen4-5
PCIe Gen4 和 Gen5 通道能夠提供 AI 加速器和即時分析所需的頻寬,促使企業架構師果斷轉向 NVMe。超大規模資料中心正在採用 EDSFF E1.S 機箱,每個 1U 機架最多可容納 64 個硬碟,密度比傳統的 U.2 陣列高出 10 倍,同時保持熱插拔維護功能。 Meta、微軟和其他雲端營運商正在將這種新型外形規格作為標準,以簡化叢集維護和散熱。對 Corsair MP700 等消費級 Gen5 硬碟的測試表明,如果散熱不當,它們會在三分鐘內關閉,這凸顯了伺服器底盤內氣流的重要性。基於韌體的 PCIe 6.0 限速功能已進入原型階段,這證實了只有主動管理散熱預算,才能將更高的介面速度轉換為應用程式效能。
雲端超大規模資料中心建置推動了對固態硬碟 (SSD) 的需求。
這些超大規模雲端計劃與Petabyte硬碟(SSD)的競標直接相關,因為人工智慧服務需要全快閃層來確保GPU的滿載運作。一家東南亞銀行透過遷移到全NVMe架構,在滿足嚴格的RAID容錯要求的同時,將資料庫延遲降低了60%。這類案例研究進一步強化了全快閃架構的趨勢,尤其是在整合能夠減少機架數量並簡化電源調度的情況下。
NAND供應鏈和價格波動
為了遏制價格持續下跌,生產商在2024年全年都減少了晶圓出貨量,然後在2024年第三季有意將合約價格上調15-20%,以調整盈利。這種週期性波動給依賴可預測成本曲線的買家帶來了預算不確定性。產業整合加劇了價格波動:SK海力士以19億美元完成了對英特爾NAND資產的收購,將產能集中在少數決策者手中。同時,中國長江儲存加速推進232層QLC的生產,即使在出口限制的情況下,也將其位密度提升至19.8 Gb/mm²。因此,供需關係的突然調整(無論是正向調整或反向調整)都可能擴大季度價格分佈,並使長期總體擁有成本(TCO)規劃變得更加複雜。
細分市場分析
M.2 憑藉其纖薄的外形,適用於客戶端設備和入門級伺服器,在 2024 年佔據了 SSD 市場 42.70% 的佔有率。然而,受雲端服務供應商對免工具熱插拔、可安裝在高密度機架中並能有效散熱的 SSD 托架的青睞,EDSFF E1.S 預計到 2030 年將以 16.9% 的複合年成長率成長。 U.2 主要應用於需要雙埠 PCIe 的場景,例如優先考慮高可用性拓樸結構的金融交易中心。 E3.S 已在超大規模資料中心業者進行試點,以滿足其對 PCIe 5.0 效能和 EDSFF 可維護性的需求。消費級主機板仍然依賴 M.2,因為它無需托架,從而降低了物料清單成本,但隨著 QLC 快閃記憶體成本的下降,筆記型電腦 OEM 廠商已經開始嘗試使用 CAMM 和焊接式 BGA 快閃記憶體。在預測期內,各公司將逐步擴大其採購政策,將 E1.S 納入其中,並最終透過 Gen6 部署將 E3.S 納入其中。
儘管到 2024 年企業工作負載將佔 SSD 市場佔有率的 45.1%,但 AI 最佳化部署的成長速度將超過更廣泛的企業存儲,年成長率將達到 17.5%。金融分析、風險建模和生成式 AI 推理正推動儲存架構師將快閃記憶體與加速器共存,使機架方案只需更少、更大容量的硬碟即可降低交叉開關延遲。隨著 GPU 在各行業的普及,預計到 2030 年,AI 最佳化儲存的 SSD 市佔率將超過 30%。
客戶端設備仍然是出貨量最大的類別,但產品同質化正在限制利潤空間。智慧型手機正在採用讀取速度高達 4200 MB/s 的 UFS 4.0 NAND 快閃記憶體,而輕薄筆記型電腦則轉向 4TB 模組,以滿足內容創作者對 8K計劃快取的需求。這些應用的工作環境溫度範圍為 -40 度C至 85 度C,並需要 15 萬次的插拔循環,因此像 ATP Electronics 這樣的廠商需要利用 pSLC 模式和 ECC 演算法來滿足長期使用的要求。
固態硬碟以外形尺寸(2.5吋、M.2、其他)、應用領域(企業/資料中心、客戶/消費設備、其他)、儲存容量(小於1TB、1-2TB、其他)、終端用戶產業(雲端服務供應商、遊戲和電競、其他)以及地區進行細分。市場預測以美元計價。
區域分析
北美地區預計在2024年將佔全球收入的26.7%,這主要得益於高密度超大規模資料中心園區以及金融和醫療保健產業對人工智慧的早期應用。北美固態硬碟市場預計到2030年將成長至314億美元,但由於其龐大的裝置量,其複合年成長率將落後於亞太地區,僅約15%。投資稅收優惠和完善的託管生態系統正在推動新模組的部署,並平衡通路庫存。該地區的企業高度重視資料主權,因此營運商在多個城市園區部署區域儲存集群,以確保資料居住合規性。
亞太地區將以18.2%的複合年成長率成為成長最快的地區,這主要得益於中國、韓國和日本的晶圓廠,它們在出口限制收緊的情況下仍能確保本地供應。目前,全球十大固態硬碟品牌中有四個來自中國,這兩家公司合計將在2024年雙十一購物節期間佔據23%的全球市場佔有率。阿里雲和騰訊雲等國內超大規模資料中心營運商正在將這些固態硬碟整合到白盒伺服器中,加速銷售成長。政府為半導體投資提供的稅收優惠政策進一步刺激了比特產量,而印度和印尼的區域性資料中心營運商正在開設新的資料中心區域,將國內運算和低延遲儲存相結合。
隨著歐洲將重點放在碳預算和循環經濟目標上,營運商更傾向於選擇具備耐久性分析、功率損耗保護和檢驗的回收途徑的固態硬碟 (SSD) 產品線。由於能源上限和位置許可限制了超大規模待開發區的建設,市場成長依然穩健但速度放緩。目前,大部分出貨量來自現有資料中心的維修,即在現有機房中用快閃記憶體替換棕地硬碟 (HDD)。中東地區,沙烏地阿拉伯和阿拉伯聯合大公國的資料中心計劃正在增加,而非洲仍處於早期應用階段,電信應用的邊緣快取是其首個應用案例。
其他福利:
- Excel格式的市場預測(ME)表
- 3個月的分析師支持
目錄
第1章 引言
- 研究假設和市場定義
- 調查範圍
第2章調查方法
第3章執行摘要
第4章 市場情勢
- 市場概覽
- 市場促進因素
- 資料中心快速採用 NVMe 和 PCIe Gen4-5
- 雲端超大規模資料中心業者中心建置推動了對固態硬碟 (SSD) 的需求。
- OEM整合到智慧型手機和平板電腦中
- 隨著美元/GB價格下跌,NAND快閃記憶體的可尋址基數擴大
- AI/ML訓練伺服器對高耐久性QLC和TLC的需求
- 邊緣運算向可熱插拔 E1.S/EDSFF 的過渡
- 市場限制
- 在冷資料儲存領域,固態硬碟比機械硬碟更貴。
- NAND供應鏈及價格波動
- 就資料歸檔而言,其寫入壽命與硬碟相比是有限的。
- PCIe Gen5熱感節流與電力消耗挑戰
- 供應鏈分析
- 監管格局
- 技術展望
- 波特五力分析
- 供應商的議價能力
- 消費者議價能力
- 新進入者的威脅
- 替代品的威脅
- 競爭對手之間的競爭
- 評估市場中的宏觀經濟因素
第5章 市場規模與成長預測
- 按外形規格
- 2.5英寸
- M.2
- U.2
- 其他
- 透過使用
- 企業/資料中心
- 客戶端/消費設備
- 工業和汽車
- 其他(邊緣運算、監控、物聯網)
- 按儲存容量
- 小於 1TB
- 1~2TB
- 其他
- 按最終用戶產業
- 雲端服務供應商
- 遊戲和電子競技
- 金融服務
- 政府和國防部
- 其他
- 按地區
- 北美洲
- 美國
- 加拿大
- 墨西哥
- 南美洲
- 巴西
- 阿根廷
- 哥倫比亞
- 歐洲
- 德國
- 英國
- 法國
- 義大利
- 西班牙
- 其他歐洲地區
- 亞太地區
- 中國
- 日本
- 韓國
- 印度
- 台灣
- 其他亞太地區
- 中東和非洲
- 中東
- 沙烏地阿拉伯
- 阿拉伯聯合大公國
- 土耳其
- 其他中東地區
- 非洲
- 南非
- 奈及利亞
- 埃及
- 其他非洲國家
- 北美洲
第6章 競爭情勢
- 市場集中度
- 策略趨勢
- 市佔率分析
- 公司簡介
- Samsung Electronics Co. Ltd.
- Western Digital Corporation
- SK hynix Inc.(incl. Solidigm)
- Micron Technology Inc.
- Kioxia Holdings Corporation
- Seagate Technology LLC
- Kingston Technology Corporation
- ADATA Technology Co. Ltd.
- Transcend Information Inc.
- Crucial(Micron Consumer)
- Silicon Motion Technology Corp.
- Marvell Technology Group
- Phison Electronics Corp.
- Corsair Memory Inc.
- Patriot Memory LLC
- Team Group Inc.
- PNY Technologies Inc.
- G.SKILL International Enterprise
- Intel Corporation
- Sabrent
第7章 市場機會與未來展望
The SSD market commands USD 61.30 billion in 2025 and is on course to touch USD 129.62 billion by 2030, advancing at a 16.16% CAGR.
Sharply rising demand for enterprise AI training clusters, record hyperscaler capital outlays, and an ongoing migration from mechanical media toward high-performance solid-state arrays underpin this momentum. Vendors that combine high-layer NAND, advanced PCIe interfaces, and sophisticated thermal designs are positioned to benefit as data-center architects prioritise density, efficiency, and low latency. Pricing remains fluid because NAND producers now calibrate wafer starts and layer transitions to preserve margins, yet healthy demand signals enable them to pass through selective increases. Competitive intensity also rises; Chinese suppliers gain domestic share, prompting incumbents to accelerate high-capacity QLC offerings and service-oriented firmware updates.
Global Solid State Drive (SSD) Market Trends and Insights
Rapid NVMe and PCIe Gen4-5 Penetration in Data Centers
Enterprise architects move decisively toward NVMe because PCIe Gen4 and Gen5 lanes supply the bandwidth that AI accelerators and real-time analytics now require. Hyperscalers adopt EDSFF E1.S enclosures that fit up to 64 drives per 1U, lifting density tenfold versus legacy U.2 arrays while maintaining hot-swap serviceability. Meta, Microsoft, and other cloud operators standardise on the newer form factor to simplify fleet service and cooling. Yet thermal loads escalate; tests on consumer Gen5 drives such as Corsair's MP700 show shutdown within three minutes when cooling is inadequate, highlighting the importance of server chassis airflow. Firmware-based throttling for PCIe 6.0 is already in prototype, confirming that interface speed gains will only translate to application performance when heat budgets are proactively managed.
Cloud-Hyperscaler Build-outs Boosting SSD Demand
These cloud hyperscale projects translate directly into petabyte-scale SSD tenders because AI services require all-flash tiers to keep GPUs saturated. Transactional proof points emerge in enterprise settings as well: a Southeast Asian bank cut database latency by 60% by shifting to an all-NVMe fabric, while still meeting stringent RAID tolerance.Such case studies reinforce a preference for flash-only architectures, especially where consolidation lowers rack count and eases power scheduling.
NAND Supply-Chain and Price Volatility
Producers curtailed wafer starts throughout 2024 to arrest a prolonged price slide, then deliberately raised contract pricing by 15-20% in Q3 2024 to realign profitability. The cycle injects budgeting uncertainty for buyers that depend on predictable cost curves. Industry consolidation exacerbates swings: SK Hynix closed its USD 1.9 billion acquisition of Intel's NAND assets, concentrating output under fewer decision makers. China's YMTC simultaneously accelerates 232-layer QLC, pushing bit density to 19.8 Gb/mm2 even under export controls. Sudden alignment or misalignment between supply and hyperscale demand can therefore widen quarterly price bands and complicate long-range TCO planning.
Other drivers and restraints analyzed in the detailed report include:
- AI/ML Training Servers' Need for High-Endurance QLC and TLC
- Thermal Throttling and Power-Draw Challenges in PCIe Gen5
For complete list of drivers and restraints, kindly check the Table Of Contents.
Segment Analysis
M.2 preserved 42.70% of SSD market share in 2024 because its slim profile aligns with client devices and entry-level servers. EDSFF E1.S, however, is on track for a 16.9% CAGR through 2030 as cloud providers favor tool-less hot-swap sleds that fit denser racks while managing thermals. U.2 lingers where dual-port PCIe is mandatory, chiefly in financial trading hubs that prize HA topologies. E3.S variants enter pilot at hyperscalers that want PCIe 5.0 performance with EDSFF serviceability. Consumer boards continue to rely on M.2 because its absence of a caddy keeps BOM costs down, yet laptop OEMs already test CAMM and soldered BGA flash as QLC cost curves sink. Over the forecast period, enterprises will progressively widen procurement policies to include E1.S and, eventually, E3.S for Gen6 deployments.
Enterprise workloads held 45.1% of the SSD market size in 2024, yet AI-tuned deployments are slated to out-run broader enterprise storage, advancing at 17.5% annually. Financial analytics, risk modelling, and generative AI inference push storage architects to co-locate flash with accelerators, so rack plans now require fewer, larger drives to reduce cross-bar latency. The SSD market share for AI-optimised storage is set to exceed 30% by 2030 as GPUs proliferate across verticals.
Client devices still ship the largest unit volumes, but commoditisation suppresses margin. Smartphones adopt UFS 4.0 NAND that posts 4,200 MB/s reads, and thin-and-light laptops jump to 4TB modules as creators demand 8K project caches. Industrial controls and autonomous robots make up a small but growing niche; these applications run in -40 °C to 85 °C envelopes and expect 150k P/E cycles, so vendors like ATP Electronics leverage pSLC modes and ECC algorithms to satisfy extended duty requirements.
Solid State Drive is Segmented by Form Factor (2. 5-Inch, M. 2, and More), Application (Enterprise/Data-Center, Client/Consumer Devices, and More), Storage Capacity (less Than 1 TB, 1 - 2 TB, and Others), End-User Industry (Cloud Service Providers, Gaming and Esports, and More), by Geography. The Market Forecasts are Provided in Terms of Value (USD).
Geography Analysis
North America controlled 26.7% of 2024 revenue, a position built on dense hyperscaler campuses and early AI adoption in financial and healthcare domains. The SSD market size for North America is forecast to grow to USD 31.4 billion by 2030, but its mid-teens CAGR lags Asia-Pacific because the installed base is already large. Investment tax incentives and an abundant colocation ecosystem sustain new module rollouts and keep channel inventory balanced. Enterprises in the region emphasise data-sovereignty; as a result, operators deploy zonal storage clusters across multiple metropolitan campuses to tighten data-residency compliance.
Asia-Pacific exhibits the fastest CAGR at 18.2% thanks to Chinese, South Korean, and Japanese fabs that secure local supply even when export controls tighten. Four of the ten largest SSD brands are now Chinese, and together they captured 23% global unit share during Singles' Day 2024 promotions. Domestic hyperscalers such as Alibaba Cloud and Tencent Cloud integrate those drives into white-box servers, accelerating volume ramp. Government programmes offering tax holidays for semiconductor investments further stimulate bit output, and regional colocation players in India and Indonesia open new zones that pair domestic compute with low-latency storage.
Europe concentrates on carbon budgeting and circular-economy targets, so operators favour SSD lines with endurance analytics, power-loss protection, and verified recycling paths. Market growth remains healthy but modest because energy caps and site permitting slow hyperscale green-field builds. Instead, brown-field retrofits that replace HDDs with flash in existing shells form the bulk of shipments. Middle East data-center projects in Saudi Arabia and UAE add incremental upside, whereas Africa stays early in the adoption curve, with edge caching for telco applications as the first use case.
- Samsung Electronics Co. Ltd.
- Western Digital Corporation
- SK hynix Inc. (incl. Solidigm)
- Micron Technology Inc.
- Kioxia Holdings Corporation
- Seagate Technology LLC
- Kingston Technology Corporation
- ADATA Technology Co. Ltd.
- Transcend Information Inc.
- Crucial (Micron Consumer)
- Silicon Motion Technology Corp.
- Marvell Technology Group
- Phison Electronics Corp.
- Corsair Memory Inc.
- Patriot Memory LLC
- Team Group Inc.
- PNY Technologies Inc.
- G.SKILL International Enterprise
- Intel Corporation
- Sabrent
Additional Benefits:
- The market estimate (ME) sheet in Excel format
- 3 months of analyst support
TABLE OF CONTENTS
1 INTRODUCTION
- 1.1 Study Assumptions and Market Definition
- 1.2 Scope of the Study
2 RESEARCH METHODOLOGY
3 EXECUTIVE SUMMARY
4 MARKET LANDSCAPE
- 4.1 Market Overview
- 4.2 Market Drivers
- 4.2.1 Rapid NVMe and PCIe Gen4-5 penetration in data centers
- 4.2.2 Cloud-hyperscaler build-outs boosting SSD demand
- 4.2.3 OEM Integration in Smartphones and Tablets
- 4.2.4 NAND USD/GB decline widening addressable base
- 4.2.5 AI/ML training servers' need for high-endurance QLC and TLC
- 4.2.6 Edge-computing shift to hot-swappable E1.S / EDSFF
- 4.3 Market Restraints
- 4.3.1 SSD price premium over HDD in cold-storage tiers
- 4.3.2 NAND supply-chain and price volatility
- 4.3.3 Limited write-endurance versus HDD for archival use
- 4.3.4 Thermal throttling and power-draw challenges in PCIe Gen5
- 4.4 Supply-Chain Analysis
- 4.5 Regulatory Landscape
- 4.6 Technological Outlook
- 4.7 Porter's Five Force Analysis
- 4.7.1 Bargaining Power of Suppliers
- 4.7.2 Bargaining Power of Consumers
- 4.7.3 Threat of New Entrants
- 4.7.4 Threat of Substitute Products
- 4.7.5 Intensity of Competitive Rivalry
- 4.8 Assesment of Macroeconomic Factors on the Market
5 MARKET SIZE AND GROWTH FORECASTS (VALUE)
- 5.1 By Form Factor
- 5.1.1 2.5-inch
- 5.1.2 M.2
- 5.1.3 U.2
- 5.1.4 Others
- 5.2 By Application
- 5.2.1 Enterprise / Data-Center
- 5.2.2 Client / Consumer Devices
- 5.2.3 Industrial and Automotive
- 5.2.4 Others (Edge, Surveillance, IoT)
- 5.3 By Storage Capacity
- 5.3.1 Less than 1 TB
- 5.3.2 1 - 2 TB
- 5.3.3 Others
- 5.4 By End-user Industry
- 5.4.1 Cloud Service Providers
- 5.4.2 Gaming and Esports
- 5.4.3 Financial Services
- 5.4.4 Government and Defense
- 5.4.5 Others
- 5.5 By Geography
- 5.5.1 North America
- 5.5.1.1 United States
- 5.5.1.2 Canada
- 5.5.1.3 Mexico
- 5.5.2 South America
- 5.5.2.1 Brazil
- 5.5.2.2 Argentina
- 5.5.2.3 Colombia
- 5.5.3 Europe
- 5.5.3.1 Germany
- 5.5.3.2 United Kingdom
- 5.5.3.3 France
- 5.5.3.4 Italy
- 5.5.3.5 Spain
- 5.5.3.6 Rest of Europe
- 5.5.4 Asia-Pacific
- 5.5.4.1 China
- 5.5.4.2 Japan
- 5.5.4.3 South Korea
- 5.5.4.4 India
- 5.5.4.5 Taiwan
- 5.5.4.6 Rest of Asia-Pacific
- 5.5.5 Middle East and Africa
- 5.5.5.1 Middle East
- 5.5.5.1.1 Saudi Arabia
- 5.5.5.1.2 United Arab Emirates
- 5.5.5.1.3 Turkey
- 5.5.5.1.4 Rest of Middle East
- 5.5.5.2 Africa
- 5.5.5.2.1 South Africa
- 5.5.5.2.2 Nigeria
- 5.5.5.2.3 Egypt
- 5.5.5.2.4 Rest of Africa
- 5.5.1 North America
6 COMPETITIVE LANDSCAPE
- 6.1 Market Concentration
- 6.2 Strategic Moves
- 6.3 Market Share Analysis
- 6.4 Company Profiles (includes Global level Overview, Market level overview, Core Segments, Financials as available, Strategic Information, Market Rank/Share for key companies, Products and Services, and Recent Developments)
- 6.4.1 Samsung Electronics Co. Ltd.
- 6.4.2 Western Digital Corporation
- 6.4.3 SK hynix Inc. (incl. Solidigm)
- 6.4.4 Micron Technology Inc.
- 6.4.5 Kioxia Holdings Corporation
- 6.4.6 Seagate Technology LLC
- 6.4.7 Kingston Technology Corporation
- 6.4.8 ADATA Technology Co. Ltd.
- 6.4.9 Transcend Information Inc.
- 6.4.10 Crucial (Micron Consumer)
- 6.4.11 Silicon Motion Technology Corp.
- 6.4.12 Marvell Technology Group
- 6.4.13 Phison Electronics Corp.
- 6.4.14 Corsair Memory Inc.
- 6.4.15 Patriot Memory LLC
- 6.4.16 Team Group Inc.
- 6.4.17 PNY Technologies Inc.
- 6.4.18 G.SKILL International Enterprise
- 6.4.19 Intel Corporation
- 6.4.20 Sabrent
7 MARKET OPPORTUNITIES AND FUTURE OUTLOOK
- 7.1 White-space and Unmet-need Assessment
 固態硬碟 (SSD) 市場:按類型、外形規格、儲存容量、技術類型、最終用戶和通路分類-2026-2032 年全球市場預測
 企業級外接可攜式硬碟市場報告:趨勢、預測及競爭分析(至2035年)
 ZNS SSD全球市場報告2026
 固態硬碟 (SSD) 市場規模、佔有率和成長分析:按介面、外形規格、技術、儲存容量和地區分類-2026-2033 年產業預測
 固態硬碟市場分析及預測(至2035年):依類型、產品、應用、技術、組件、外形、設備、最終用戶、部署方式及功能分類全球固態硬碟市場:依儲存類型、介面、技術、最終用戶、國家及地區分類-產業分析、市場規模、佔有率及預測(2025-2032年)2026年全球固態硬碟市場報告
 全球固態硬碟(SSD)市場:市場規模、佔有率、成長率、產業分析、依類型、應用和地區劃分的分析及預測(2026-2034)
 AI 效能驅動企業級 SSD 在儲存領域的主導地位 - 2026 年趨勢
 近線SSD的崛起:硬碟缺口加速人工智慧資料中心的重塑