


 |
市場調查報告書
商品編碼
1850311
應用傳遞控制器(ADC):市場佔有率分析、行業趨勢、統計數據和成長預測(2025-2030 年)Application Delivery Controllers (ADC) - Market Share Analysis, Industry Trends & Statistics, Growth Forecasts (2025 - 2030) |
||||||
※ 本網頁內容可能與最新版本有所差異。詳細情況請與我們聯繫。
應用傳遞控制器 (ADC) 市場預計到 2025 年將達到 34.2 億美元,到 2030 年將達到 52.6 億美元,複合年成長率為 8.98%。
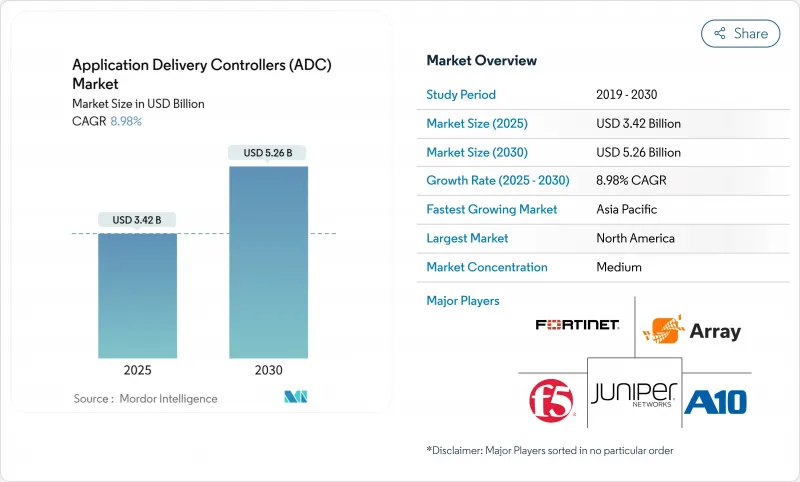
向雲端原生架構的快速轉型、東西向資料中心流量的成長以及持續的多重雲端策略,正在推動對智慧、安全感知型流量管理平台的需求。供應商現在將先進的第 7 層安全性、API 保護和 AI 輔助分析整合到單一產品中,使企業能夠在提升用戶體驗的同時降低風險。雖然硬體設備仍然主導著對效能要求較高的工作負載,但隨著企業優先考慮敏捷性和按需付費的經濟外形規格設備正在迅速擴張。從區域來看,北美憑藉其成熟的 IT 資產和有利的監管環境,保持著領先地位;而亞太地區則在 5G 建設和數位化舉措的推動下,實現了最強勁的成長。
全球應用傳遞控制器 (ADC) 市場趨勢與洞察
向雲端原生和微服務架構的轉變
應用程式交付控制器市場正被迫轉向輕量級、以 API 為中心的架構,以便部署在 Kubernetes 叢集和服務網格中。這些微網專注於入了細粒度的流量控制、雙向 TLS 終止和自動擴展鉤子,以適應現代應用程式的短暫性。供應商正在整合模式感知 API 防火牆和分散式速率限制器,以彌補東西向服務呼叫造成的安全漏洞。隨著資訊長們大力推進平台工程,聲明式的「ADC 即程式碼」與 GitOps 管線無縫整合,減少了開發和網路運維之間的交接環節。
東西向資料中心流量呈指數級成長
由於虛擬伺服器密度高,內部流量已超越傳統的南北向模式,推動了對延遲敏感的微交易的成長。分散式應用傳遞控制器 (ADC) 執行個體現在部署在工作負載 pod 附近,可在不造成瓶頸的情況下提供廣泛的遠端檢測和線上解密功能。金融交易所、通訊業者和遊戲供應商正在部署數千個輕量級代理,這些代理商能夠適應突發的資源池,並共同執行第 7 層策略。
複雜的第 7 層策略配置給 IT 維運帶來負擔。
企業團隊面臨數百個不同的應用程式,每個應用程式都需要自訂的路由、重寫或WAF邏輯。在多重雲端環境中保持準確性會對稀缺的DevSecOps人才帶來巨大壓力,並阻礙更廣泛的應用程式交付控制(ADC)部署。供應商正在透過基於意圖的模板、AI驅動的規則創建和視覺化依賴關係圖來應對這一挑戰,但技能缺口依然存在。
細分市場分析
到2024年,硬體設備將佔據應用傳遞控制器市場59%的佔有率,這主要得益於用於SSL卸載和確定性吞吐量的專用晶片。然而,隨著DevOps團隊將ADC鏡像直接整合到CI/CD管線中,減少機架佔用空間並加快部署速度,虛擬應用傳遞控制器市場將以14.6%的複合年成長率成長。隨著容器技術的普及,虛擬解決方案的應用傳遞控制器市場規模將大幅成長,挑戰硬體在關鍵任務層級的主導地位。
成熟的供應商正透過發布容器原生代理來分散風險,這些代理商既能降低設備開銷,又能繼承策略引擎。成本透明度和雲端市場收費對敏捷團隊極具吸引力,軟體解決方案甚至在傳統企業中也越來越受歡迎。隨著 TLS 1.3 和 QUIC 的普及,程式碼層面的敏捷性可能會進一步促使企業傾向於選擇軟體外形規格。
到2024年,本地部署實例仍將佔據應用傳遞控制器市場64%的佔有率,尤其受到資料主權驅動型產業的青睞。整合的威脅分析模組和計量型的容量授權模式,無需徹底更換現有系統即可升級傳統架構。
相反,隨著平台團隊將修補程式、擴展和遙測等工作外包給供應商營運的控制平台,雲端管理模式將以 15.2% 的複合年成長率成長。多區域部署可在數小時內完成,統一的 API 策略執行可消除站點層級偏差。應用傳遞控制器市場正透過混合儀表板不斷融合這些模式,從而實現從單一主機配置硬體、虛擬和 SaaS 端點。
應用傳遞控制器 (ADC) 市場按類型(硬體 ADC、虛擬/軟體 ADC)、部署方式(本地部署、雲端託管/雲端管理)、元件(解決方案(控制、加速、安全)、服務(整合、管理、培訓))、公司規模(大型企業、中小企業)、最終用戶行業(IT 和電信、銀行、金融服務和保險 (BFSI)、其他地區以及其他地區進行細分。市場預測以美元計價。
區域分析
到2024年,北美將佔據應用傳遞控制器市場34%的佔有率,這主要得益於超大規模資料中心生態系統和嚴格的資料隱私法規,這些法規推動了對整合安全的需求。諸如F5替換數百套Citrix NetScaler系統之類的整合舉措,預示著成熟客戶群的流失。
亞太地區正以12.8%的複合年成長率實現最快成長,這主要得益於5G部署和工業4.0計畫推動了工廠和智慧城市對低延遲、多租戶ADC架構的需求。中國和印度的政府雲端專案正在將ADC功能嵌入其自主雲中,並與本地供應商建立夥伴關係。
在歐洲,DORA 合規期限的收緊影響著銀行和金融科技公司的升級,平衡本地部署和雲端部署,以及監管機構對資料駐留的關注,這些因素正在推動對政策主導的位置隔離的需求。
在中東和非洲,應用資料中心(ADC)正被用於支援一項價值3.7兆美元的計劃建設項目、物聯網賦能的公共工程項目以及全國性的數位政府入口網站。這種混合模式既滿足了效能需求,又能適應區域資料中心規模有限的限制。
金融服務和零售電子商務的現代化正在推動拉丁美洲採用雲端基礎的ADC,在經濟波動的情況下,人們更傾向於使用基於雲端的ADC來避免資金限制。
其他福利:
- Excel格式的市場預測(ME)表
- 3個月的分析師支持
目錄
第1章 引言
- 研究假設和市場定義
- 調查範圍
第2章調查方法
第3章執行摘要
第4章 市場情勢
- 市場概覽
- 市場促進因素
- 向雲端原生和微服務架構轉型
- 東西向資料中心流量快速成長
- 北美和歐盟安全數位銀行的監管要求
- 亞洲地區5G部署的擴展將推動邊緣ADC的採用。
- 全球2000強企業中多重雲端和混合IT策略的興起
- 市場限制
- 複雜的第 7 層策略配置給 IT 維運帶來負擔。
- 先進ADC許可模式成本不斷上升
- 基本負載平衡功能的商品化
- 熟練的網路運維和DevSecOps人才短缺
- 技術展望
- 波特五力分析
- 供應商的議價能力
- 買方的議價能力
- 新進入者的威脅
- 替代品的威脅
- 競爭對手之間的競爭
- 評估宏觀經濟因素對產業的影響
第5章 市場規模與成長預測
- 按類型
- 基於硬體的類比數位轉換器
- 虛擬/軟體ADC
- 透過部署
- 本地部署
- 雲端託管/託管
- 按組件
- 解決方案(控制、加速、安全)
- 服務(整合、管理、培訓)
- 按公司規模
- 主要企業
- 小型企業
- 最終用戶
- 資訊科技和通訊
- BFSI
- 零售與電子商務
- 醫療保健和生命科學
- 政府和公共部門
- 製造業和工業4.0
- 媒體與娛樂
- 能源與公共產業
- 按地區
- 北美洲
- 美國
- 加拿大
- 墨西哥
- 南美洲
- 巴西
- 阿根廷
- 智利
- 秘魯
- 其他南美洲
- 歐洲
- 德國
- 英國
- 法國
- 義大利
- 西班牙
- 其他歐洲地區
- 亞太地區
- 中國
- 日本
- 韓國
- 印度
- 澳洲
- 紐西蘭
- 亞太其他地區
- 中東和非洲
- 阿拉伯聯合大公國
- 沙烏地阿拉伯
- 土耳其
- 南非
- 其他中東和非洲地區
- 北美洲
第6章 競爭情勢
- 策略發展
- 供應商定位分析
- 公司簡介
- F5 Networks Inc.
- NetScaler(Citrix Systems)
- Fortinet Inc.
- A10 Networks Inc.
- Array Networks Inc.
- Radware Ltd.
- Akamai Technologies Inc.
- Cisco Systems Inc.
- Barracuda Networks Inc.
- HAProxy Technologies LLC
- Kemp Technologies(Progress Software)
- Loadbalancer.org Inc.
- Cloudflare Inc.
- Dell Technologies Inc.
- Amazon Web Services(ALB/NLB)
- Microsoft Azure(Application Gateway)
- Alibaba Cloud(Global Server Load Balancer)
- Piolink Inc.
- Sangfor Technologies Inc.
- NGINX Inc.(F5)
第7章 市場機會與未來展望
The application delivery controllers market size stands at USD 3.42 billion in 2025 and is set to reach USD 5.26 billion by 2030, expanding at an 8.98% CAGR.
Rapid migration to cloud-native architectures, rising east-west data-center traffic, and persistent multi-cloud strategies keep demand high for intelligent, security-aware traffic-management platforms. Vendors now bundle advanced Layer-7 security, API protection, and AI-assisted analytics into single offerings, allowing enterprises to improve user experience while containing risk. Hardware appliances still dominate performance-critical workloads, yet virtual and cloud-managed form factors are scaling faster as organizations prioritize agility and consumption-based economics. Regionally, North America leverages mature IT estates and regulatory tailwinds to hold leadership, while Asia-Pacific's 5G build-outs and digital initiatives create the steepest growth curve.
Global Application Delivery Controllers (ADC) Market Trends and Insights
Shift Toward Cloud-Native And Microservices Architecture
More than half of enterprise workloads already run as containerized or serverless components, forcing the application delivery controllers market to pivot toward lightweight, API-centric form factors that sit inside Kubernetes clusters and service meshes. These micro-gateways inject granular traffic steering, mutual-TLS termination, and automated scaling hooks that match the ephemeral nature of modern applications . Vendors are embedding schema-aware API firewalls and distributed rate-limiters to close security gaps opened by east-west service calls. As CIOs push for platform engineering, declarative "ADC-as-code" integrates seamlessly with GitOps pipelines, reducing hand-offs between Dev and NetOps.
Exponential East-West Data-Center Traffic Growth
Virtual server density has multiplied internal flows, outpacing traditional north-south patterns and elevating latency-sensitive micro-transactions. Distributed ADC instances now sit closer to workload pods, providing pervasive telemetry and inline decryption without introducing bottlenecks . Financial exchanges, telcos, and gaming providers deploy thousands of lightweight proxies that collectively enforce Layer-7 policies yet adapt to bursty resource pools.
Complex Layer-7 Policy Configuration Burdens IT Ops
Enterprise teams confront hundreds of heterogeneous applications, each demanding bespoke routing, rewrite, or WAF logic. Maintaining accuracy across multi-cloud estates strains scarce DevSecOps talent and can stall broader ADC roll-outs. Vendors answer with intent-based templates, AI-assisted rule creation, and visual dependency maps, yet skill gaps persist.
Other drivers and restraints analyzed in the detailed report include:
- Regulatory Mandates for Secure Digital Banking
- Growing 5G Roll-outs Driving Edge ADC Adoption
- Cost Inflation of Advanced ADC Licensing Models
For complete list of drivers and restraints, kindly check the Table Of Contents.
Segment Analysis
Hardware appliances represented 59% of the application delivery controllers market in 2024, supported by specialized SSL offload chips and deterministic throughput. Yet the virtual segment is scaling at 14.6% CAGR as DevOps teams embed ADC images directly into CI/CD pipelines, reducing rack footprint and accelerating rollout windows. The application delivery controllers market size for virtual solutions is forecast to surge alongside container adoption, challenging hardware's grip on mission-critical tiers.
Mature vendors hedge by releasing container-native proxies that inherit their policy engines while shedding appliance overhead. Cost transparency plus cloud marketplace billing appeal to agile teams, driving incremental share gains for software even inside traditional enterprises. As TLS 1.3 and QUIC adoption climb, code-level agility will further tilt decisions toward software form factors, though hardware will persist for ultra-high TPS gateways in finance and telecom cores.
On-premise instances still command 64% of the application delivery controllers market size in 2024, favored by sectors bound to data-sovereignty mandates. Integrated threat analytics modules and pay-as-you-grow capacity licensing now refresh legacy estates without forklift replacements .
Conversely, the cloud-managed model rises at 15.2% CAGR as platform teams offload patching, scaling, and telemetry to vendor-operated control planes. Multi-region rollouts complete in hours, and unified API policy enforcement eliminates site-level drift, making it the preferred path for digital-native firms. The application delivery controllers market continues to blend these modes through hybrid dashboards that configure hardware, virtual, and SaaS endpoints from a single console.
Application Delivery Controllers (ADC) Market is Segmented by Type (Hardware-Based ADC, Virtual/Software ADC), Deployment (On-Premise, Cloud-Managed/Hosted), Component (Solutions (Control, Acceleration, Security), Services (Integration, Managed, Training)), Enterprise Size (Large Enterprises, Smes), End-User Vertical (IT and Telecom, BFSI, and More), Geography. The Market Forecasts are Provided in Terms of Value (USD).
Geography Analysis
North America retained 34% of the application delivery controllers market in 2024, buoyed by hyperscaler ecosystems and stringent data-privacy regulations that elevate integrated security requirements. Consolidation plays, such as F5's reported displacement of hundreds of Citrix NetScaler estates, demonstrate churn within mature accounts.
Asia-Pacific delivers the steepest 12.8% CAGR as 5G rollouts and Industry 4.0 agendas spur demand for low-latency, multi-tenant ADC fabrics across factories and smart cities. Government cloud programs in China and India embed ADC functionality inside sovereign clouds, driving local vendor partnerships.
Europe balances on-prem and cloud adoption, reinforced by DORA compliance deadlines influencing bank and fintech upgrades. Regulators' focus on data residency fuels demand for policy-driven location fencing.
Middle East and Africa tap ADCs to underpin USD 3.7 trillion in megaproject construction, IoT-enabled utilities, and nationwide digital-government portals. Hybrid models satisfy both performance needs and limited regional data-center footprints.
South America's financial-services modernization and retail e-commerce spur incremental uptake, with cloud-based ADCs preferred to circumvent capital constraints amid economic volatility.
- F5 Networks Inc.
- NetScaler (Citrix Systems)
- Fortinet Inc.
- A10 Networks Inc.
- Array Networks Inc.
- Radware Ltd.
- Akamai Technologies Inc.
- Cisco Systems Inc.
- Barracuda Networks Inc.
- HAProxy Technologies LLC
- Kemp Technologies (Progress Software)
- Loadbalancer.org Inc.
- Cloudflare Inc.
- Dell Technologies Inc.
- Amazon Web Services (ALB / NLB)
- Microsoft Azure (Application Gateway)
- Alibaba Cloud (Global Server Load Balancer)
- Piolink Inc.
- Sangfor Technologies Inc.
- NGINX Inc. (F5)
Additional Benefits:
- The market estimate (ME) sheet in Excel format
- 3 months of analyst support
TABLE OF CONTENTS
1 INTRODUCTION
- 1.1 Study Assumptions and Market Definition
- 1.2 Scope of the Study
2 RESEARCH METHODOLOGY
3 EXECUTIVE SUMMARY
4 MARKET LANDSCAPE
- 4.1 Market Overview
- 4.2 Market Drivers
- 4.2.1 Shift Toward Cloud-Native and Microservices Architecture
- 4.2.2 Exponential East-West Data-Center Traffic Growth
- 4.2.3 Regulatory Mandates for Secure Digital Banking in North America and EU
- 4.2.4 Growing 5G Roll-outs Driving Edge ADC Adoption in Asia
- 4.2.5 Rising Multi-Cloud and Hybrid IT Strategies among Global 2000
- 4.3 Market Restraints
- 4.3.1 Complex Layer-7 Policy Configuration Burdens IT Ops
- 4.3.2 Cost Inflation of Advanced ADC Licensing Models
- 4.3.3 Commoditization of Basic Load-Balancing Features
- 4.3.4 Shortage of Skilled NetOps and DevSecOps Talent
- 4.4 Technological Outlook
- 4.5 Porter's Five Forces Analysis
- 4.5.1 Bargaining Power of Suppliers
- 4.5.2 Bargaining Power of Buyers
- 4.5.3 Threat of New Entrants
- 4.5.4 Threat of Substitutes
- 4.5.5 Intensity of Competitive Rivalry
- 4.6 Assessment of Macroeconomic Factors Impact on the Industry
5 MARKET SIZE AND GROWTH FORECASTS (VALUE)
- 5.1 By Type
- 5.1.1 Hardware-Based ADC
- 5.1.2 Virtual/Software ADC
- 5.2 By Deployment
- 5.2.1 On-premise
- 5.2.2 Cloud-Managed/Hosted
- 5.3 By Component
- 5.3.1 Solutions (Control, Acceleration, Security)
- 5.3.2 Services (Integration, Managed, Training)
- 5.4 By Enterprise Size
- 5.4.1 Large Enterprises
- 5.4.2 Small and Medium Enterprises (SMEs)
- 5.5 By End-user Vertical
- 5.5.1 IT and Telecom
- 5.5.2 BFSI
- 5.5.3 Retail and E-commerce
- 5.5.4 Healthcare and Life Sciences
- 5.5.5 Government and Public Sector
- 5.5.6 Manufacturing and Industrial 4.0
- 5.5.7 Media and Entertainment
- 5.5.8 Energy and Utilities
- 5.6 By Geography
- 5.6.1 North America
- 5.6.1.1 United States
- 5.6.1.2 Canada
- 5.6.1.3 Mexico
- 5.6.2 South America
- 5.6.2.1 Brazil
- 5.6.2.2 Argentina
- 5.6.2.3 Chile
- 5.6.2.4 Peru
- 5.6.2.5 Rest of South America
- 5.6.3 Europe
- 5.6.3.1 Germany
- 5.6.3.2 United Kingdom
- 5.6.3.3 France
- 5.6.3.4 Italy
- 5.6.3.5 Spain
- 5.6.3.6 Rest of Europe
- 5.6.4 Asia-Pacific
- 5.6.4.1 China
- 5.6.4.2 Japan
- 5.6.4.3 South Korea
- 5.6.4.4 India
- 5.6.4.5 Australia
- 5.6.4.6 New Zealand
- 5.6.4.7 Rest of Asia-Pacific
- 5.6.5 Middle East and Africa
- 5.6.5.1 United Arab Emirates
- 5.6.5.2 Saudi Arabia
- 5.6.5.3 Turkey
- 5.6.5.4 South Africa
- 5.6.5.5 Rest of Middle East and Africa
- 5.6.1 North America
6 COMPETITIVE LANDSCAPE
- 6.1 Strategic Developments
- 6.2 Vendor Positioning Analysis
- 6.3 Company Profiles (includes Global level Overview, Market level overview, Core Segments, Financials as available, Strategic Information, Products and Services, and Recent Developments)
- 6.3.1 F5 Networks Inc.
- 6.3.2 NetScaler (Citrix Systems)
- 6.3.3 Fortinet Inc.
- 6.3.4 A10 Networks Inc.
- 6.3.5 Array Networks Inc.
- 6.3.6 Radware Ltd.
- 6.3.7 Akamai Technologies Inc.
- 6.3.8 Cisco Systems Inc.
- 6.3.9 Barracuda Networks Inc.
- 6.3.10 HAProxy Technologies LLC
- 6.3.11 Kemp Technologies (Progress Software)
- 6.3.12 Loadbalancer.org Inc.
- 6.3.13 Cloudflare Inc.
- 6.3.14 Dell Technologies Inc.
- 6.3.15 Amazon Web Services (ALB / NLB)
- 6.3.16 Microsoft Azure (Application Gateway)
- 6.3.17 Alibaba Cloud (Global Server Load Balancer)
- 6.3.18 Piolink Inc.
- 6.3.19 Sangfor Technologies Inc.
- 6.3.20 NGINX Inc. (F5)
7 MARKET OPPORTUNITIES AND FUTURE OUTLOOK
- 7.1 White-space and Unmet-Need Assessment

