


 |
市場調查報告書
商品編碼
1850309
行動惡意軟體防護:市場佔有率分析、行業趨勢、統計數據和成長預測(2025-2030 年)Mobile Anti-Malware - Market Share Analysis, Industry Trends & Statistics, Growth Forecasts (2025 - 2030) |
||||||
※ 本網頁內容可能與最新版本有所差異。詳細情況請與我們聯繫。
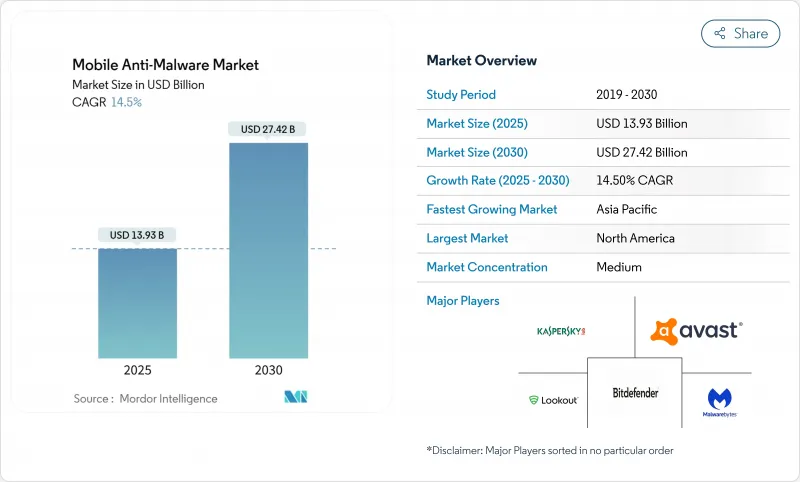
預計到 2025 年,行動反惡意軟體市場規模將達到 139.3 億美元,到 2030 年將達到 274.2 億美元,年複合成長率為 14.5%。
企業數位化的快速推進、人工智慧驅動的惡意軟體產生以及零信任安全策略的推行,使得行動終端成為網路威脅行為者的主要攻擊目標。大型企業如今將行動安全視為核心基礎設施,投資於行為分析以偵測惡意意圖,而非依賴傳統的特徵碼掃描。雲端威脅情報、地緣政治因素對供應商的限制以及新型設備端人工智慧晶片的出現,也影響行動安全技術的普及。因此,擁有強大研發能力和完善託管服務的供應商在主題鍵盤市場中擁有顯著優勢。
全球行動反惡意軟體市場趨勢與洞察
生成式人工智慧時代行動惡意軟體變種呈爆炸性成長
生成式人工智慧工具能夠自動創建多態程式碼,這些程式碼每次安裝都會發生變異,預計到2025年,每天將產生56萬個獨特的行動威脅。這些宣傳活動將程式碼混淆與生成對抗網路(GAN)生成的釣魚頁面相結合,以模仿公共和私人應用程式商店中的可信應用程式。簽章資料庫已無法滿足需求,迫使供應商整合設備端機器學習模型,以毫秒級的速度對使用者行為進行評分。能夠將雲端規模關聯分析與裝置端啟發式演算法結合,在執行前識別使用者意圖的供應商正逐漸受到企業的青睞。這種顛覆性的轉變使得持續的研發和資料工程能力成為行動反惡意軟體市場競爭優勢的核心。
自備設備辦公 2.0 和混合辦公模式推動企業需求
企業行動化正從便利性轉變為關鍵任務存取模式。到 2024 年,84% 的北美大型企業將增加行動安全預算,以保護員工自有設備(用於處理 CRM、ERP 和敏感資料工作流程)。 BYOD 2.0 策略要求對應用程式、網路呼叫和硬體健康狀況進行執行時間監控,從而彌補了傳統 MDM 工具的不足。安全團隊傾向於採用統一的套件,將單一策略應用於行動電話、筆記型電腦和平板電腦,這推動了對統一平台的需求。因此,捆綁威脅搜尋和自動化回應的高級訂閱服務將增強行動反惡意軟體市場的收益穩定性。
消費者對行動影音的付費意願持續下降
零售用戶通常認為內建保護就足夠了,而忽略了那些缺乏明顯實用性的高級功能。即使在備受矚目的資料外洩事件頻繁期間,免費加值應用程式的轉換率仍只有個位數,這限制了企業訂閱以外的收益規模。供應商嘗試推出廣告支援版本、身分保護捆綁包和家庭套餐,但收益仍然困難重重。這種差距限制了消費者收益,因此企業市場對於行動反惡意軟體市場的長期成長至關重要。
細分分析
到2024年,Android將佔據行動反惡意軟體市場60.1%的佔有率。同時,iOS正以15.5%的複合年成長率成長,更嚴格的硬體認證和程式碼簽章簡化了受監管領域的合規流程。預計到2030年,iOS終端機的行動反惡意軟體市場規模將成長近一倍,因為醫院集團、保險公司和金融機構為了降低安全漏洞應對成本,紛紛採用蘋果設備作為標準配置。由於Android在以低價手機為主導的高成長經濟體中仍然至關重要,廠商正在部署人工智慧驅動的行為引擎來彌補系統碎片化和補丁不一致的問題。
企業越來越重視整體擁有成本,而不僅僅是購買價格。安全專家指出,iOS 的重大安全事件較少,因此取證成本和停機時間也更低。然而,Android 的開放生態系統促進了加固設備和物流及現場服務專用工具集的創新,確保了對下一代安全防護工具的穩定需求。小眾作業系統(主要是面向國防領域的加固型 Linux 系統)的銷售量仍然不高,但由於嚴格的認證要求,其單一使用者價格卻很高。
到 2024 年,本地部署將佔行動反惡意軟體市場規模的 70.8%。然而,隨著董事會核准安全預算作為營運支出,並根據設備數量進行調整,雲端合約正以 16.2% 的複合年成長率加速成長。大型企業報告稱,隨著簽章更新、模型重新訓練和威脅情報源遷移到供應商管理的雲端,管理開銷減少了 40%。
營運商級網路連線和邊緣存取點進一步降低了延遲,即使在 Wi-Fi 訊號較差的環境下,雲端主機也能始終檢驗連線狀態。供應商確保符合區域資料中心和精細化的資料保存策略。因此,混合部署——核心資產採用本地部署,遠端員工使用雲端——已成為常態。這種轉變有望帶來更高的收益,因為客戶可以擴展授權規模,而不是進行一次性的硬體更新。
區域分析
北美地區預計到2024年將佔總收入的38.1%。這項領先優勢主要得益於龐大的企業預算、成熟的行動辦公室專案以及嚴格的法規,例如美國司法部的《資料傳輸保障法》(Data 傳輸 Safeguard),該法要求對所有終端進行持續的風險評分。加拿大銀行符合OSFI-B-13標準,這進一步推動了對能夠向監管機構報告設備健康狀況的認證平台的需求。此外,地緣政治審查將淘汰某些國際供應商,從而進一步促使消費者將資金投入到值得信賴的國內生態系統中。
亞太地區是一個快速成長的地區,預計到2030年將以14.9%的複合年成長率成長。無現金交易、超級應用生態系統和行動優先的工作模式將使該地區的設備普及速度超過成熟市場。印度、印尼和越南的企業正在採用威脅防禦代理來滿足支付安全要求,而日本和澳洲的企業則正在升級以滿足零信任準則。區域通路合作夥伴正在將託管偵測服務捆綁到連接方案中,以加速其在中階市場企業的拓展。
歐洲在收入方面排名第三,但仍然至關重要,因為GDPR罰款意味著資料外洩可能導致巨額經濟損失。跨國公司要求使用本地資料中心,並對資料出口制定嚴格的合約條款,促使供應商在歐盟境內設立威脅情報節點。隨著5G的普及,行動工作流程深入石油、物流和智慧城市計劃,南歐和中東地區的5G應用也日益增加。拉丁美洲的情況也類似,儘管宏觀經濟的不確定性導致一些部署仍停留在試點階段,而非全面投產。
其他福利:
- Excel格式的市場預測(ME)表
- 3個月的分析師支持
目錄
第1章 引言
- 研究假設和市場定義
- 調查範圍
第2章調查方法
第3章執行摘要
第4章 市場情勢
- 市場概況
- 市場促進因素
- 在生成式人工智慧時代,行動端惡意軟體變種呈現爆炸性成長。
- BYOD 2.0 和混合工作推動企業需求
- 在新興國家拓展行動支付生態系統
- 員工自有設備零信任監理要求
- 針對第三方安卓應用程式商店的「應用程式克隆」供應鏈攻擊日益增多
- 設備內建人工智慧安全晶片的普及,使得高品質、即時掃描成為可能。
- 市場限制
- 消費者對行動影音的支付意願依然低迷。
- 作業系統層級的安全性增強功能可減少威脅面。
- 對外國網路安全供應商的地緣政治不信任
- 以隱私為中心的作業系統功能可降低防毒軟體的可見性
- 價值鏈分析
- 監管格局
- 技術展望
- 波特五力分析
- 供應商的議價能力
- 買方的議價能力
- 新進入者的威脅
- 替代品的威脅
- 競爭對手之間的競爭
- 評估宏觀經濟趨勢對市場的影響
第5章 市場規模與成長預測
- 按作業系統
- 安卓
- iOS
- 其他
- 透過部署模式
- 本地部署
- 雲
- 按解決方案類型
- 獨立行動防毒應用
- 統一端點保護套件
- 行動安全即服務 (SECaaS)
- 按最終用戶
- 公司
- 消費者/個人
- 按行業
- BFSI
- 衛生保健
- 資訊科技和通訊
- 政府和國防
- 教育
- 其他
- 按地區
- 北美洲
- 美國
- 加拿大
- 墨西哥
- 歐洲
- 德國
- 英國
- 法國
- 義大利
- 西班牙
- 其他歐洲地區
- 亞太地區
- 中國
- 日本
- 印度
- 韓國
- 澳洲
- 其他亞太地區
- 南美洲
- 巴西
- 阿根廷
- 其他南美
- 中東和非洲
- 中東
- 沙烏地阿拉伯
- 阿拉伯聯合大公國
- 土耳其
- 其他中東地區
- 非洲
- 南非
- 埃及
- 奈及利亞
- 其他非洲國家
- 北美洲
第6章 競爭情勢
- 市場集中度
- 策略趨勢
- 市佔率分析
- 公司簡介
- AO Kaspersky Lab
- Avast Software
- Bitdefender
- Lookout
- Malwarebytes
- McAfee
- Sophos
- Broadcom(Symantec)
- Trend Micro
- ESET
- Check Point Software
- CrowdStrike
- Cisco Secure Endpoint
- Quick Heal Technologies
- Zimperium
- F-Secure
- NortonLifeLock
- Panda Security
- Qihoo 360
- Tencent Mobile Manager
- Dr.Web
第7章 市場機會與未來展望
The mobile anti-malware market size stands at USD 13.93 billion in 2025 and is projected to reach USD 27.42 billion by 2030, reflecting a 14.5% CAGR.
Rapid enterprise digitization, generative-AI-driven malware creation, and zero-trust mandates have turned mobile endpoints into primary attack surfaces for threat actors. Large organizations now treat mobile security as core infrastructure, investing in behavioral analytics that detect malicious intent rather than relying on legacy signature scans. Cloud-delivered threat intelligence, geopolitical vendor restrictions, and new device-embedded AI chips also influence adoption patterns, giving vendors with strong research pipelines and managed-service offerings a clear advantage in the mobile anti-malware market.
Global Mobile Anti-Malware Market Trends and Insights
Exploding Mobile-Specific Malware Variants Post-Generative-AI Era
Generative AI tooling now automates the creation of polymorphic code that mutates on each installation, producing 560,000 unique mobile threats every day in 2025. These campaigns blend code obfuscation with GAN-generated phishing screens that mimic trusted apps on both public and private stores. Signature databases can no longer keep pace, prompting vendors to embed device-side machine learning models that score behavior in milliseconds. Providers that combine cloud-scale correlation with on-device heuristics are gaining enterprise preference because they identify intent before execution. This structural shift places continuous R&D and data-engineering capacity at the center of competitive advantage in the mobile anti-malware market.
BYOD 2.0 and Hybrid Work Driving Corporate Demand
Corporate mobility has evolved from convenience to mission-critical access. In 2024, 84% of large North American firms lifted mobile security budgets to secure employee-owned devices that now handle CRM, ERP, and confidential data workflows. BYOD 2.0 policies prescribe runtime monitoring of applications, network calls, and hardware state, closing gaps left by conventional MDM tools. Security teams prefer consolidated suites that apply one policy across phones, laptops, and tablets, which strengthens demand for integrated platforms. As a result, premium subscription tiers that bundle threat hunting and automated response drive revenue resilience in the mobile anti-malware market.
Persistently Low Consumer Willingness to Pay for Mobile AV
Retails users view built-in protections as adequate and often ignore premium tiers that lack visible utility. Conversion rates on freemium apps stay in single digits even during high-profile breach cycles, limiting revenue scalability outside enterprise contracts. Vendors experiment with ad-supported versions, identity-protection bundles, and family plans, yet monetization remains challenging. The gap places a ceiling on consumer revenue, making the enterprise segment pivotal for long-term growth in the mobile anti-malware market.
Other drivers and restraints analyzed in the detailed report include:
- Expansion of Mobile Payment Ecosystems in Emerging Economies
- Regulatory Mandates for Zero-Trust on Employee-Owned Devices
- OS-Level Security Hardening Shrinking Threat Surface
For complete list of drivers and restraints, kindly check the Table Of Contents.
Segment Analysis
Android retained 60.1% of mobile anti-malware market share in 2024 due in large part to its vast installed base and lower average device cost. At the same time, iOS units are growing at a 15.5% CAGR, supported by hardware attestation and stricter code-signing controls that simplify compliance in regulated sectors. The mobile anti-malware market size for iOS endpoints is projected to almost double by 2030 as hospital groups, insurers, and financial institutions standardize on Apple devices to lower breach-response expenses. Android remains essential in high-growth economies where value phones dominate, so vendors position AI-powered behavioral engines to offset fragmentation and inconsistent patching.
Enterprises increasingly compare total cost of ownership rather than purchase price alone. Security leaders note that fewer critical incidents on iOS translate into lower forensics spending and downtime. However, Android's open ecosystem spurs innovation in ruggedized devices and specialized toolsets for logistics and field services, ensuring steady demand for next-generation protection agents. Niche operating systems-mainly hardened Linux builds for the defense sector-hold marginal volume yet command high per-seat pricing due to strict accreditation requirements.
On-premise installations accounted for 70.8% of the mobile anti-malware market size in 2024 because many banks and public agencies still store telemetry inside national borders. Nevertheless, cloud subscriptions are accelerating at 16.2% CAGR as boards approve security-as-operating-expenditure budgets that scale with device counts. Large enterprises cite 40% lower administrative overhead once signature updates, model retraining, and threat-intelligence feeds shift to vendor-managed clouds.
Carrier-grade network connectivity and edge PoPs further reduce latency, making cloud consoles viable for always-on validation even under poor Wi-Fi conditions. Vendors assure compliance via regional datacenters and granular data-retention policies. As a result, hybrid rollouts mixing on-prem for crown-jewel assets with cloud for remote staff are now standard. This transition unlocks incremental revenue because customers expand license volumes rather than perform one-off hardware refreshes.
The Mobile Anti-Malware Market Report is Segmented by Operating System (Android, IOS, and Others), Deployment Mode (On-Premise and Cloud), Solution Type (Stand-Alone Mobile Antivirus Apps, Integrated Endpoint-Protection Suites, and More), End User (Enterprises and Consumers / Individuals), Industry Vertical (BFSI, Healthcare, and More), and Geography. The Market Forecasts are Provided in Terms of Value (USD).
Geography Analysis
North America captured 38.1% of 2024 revenue. This lead stems from large enterprise budgets, established mobility programs, and stringent laws such as the U.S. DOJ data-transfer safeguards that require continuous risk scoring on every endpoint. Canadian banks comply with OSFI-B-13, further cementing demand for certified platforms capable of reporting device posture to regulators. Local vendors also benefit from geopolitical screening that sidelines certain foreign suppliers, reallocating spending toward trusted domestic ecosystems.
Asia-Pacific is the fastest-growing region with a projected 14.9% CAGR to 2030. Cashless commerce, super-app ecosystems, and mobile-first workforces expand the total device pool faster than in mature markets. Enterprises in India, Indonesia, and Vietnam adopt threat-defense agents to satisfy payment-security mandates, while Japanese and Australian organizations upgrade to meet zero-trust guidelines. Regional channel partners bundle managed detection services with connectivity plans, accelerating outreach into mid-market enterprises.
Europe ranks third by revenue, yet remains pivotal because GDPR fines link data breaches to material financial penalties. Multinationals demand local data centers and strict contractual clauses on data export, encouraging vendors to open EU-based threat-intelligence nodes. In Southern Europe and the Middle East, uptake increases as 5G rollouts push mobile workflows deeper into oil, logistics, and smart-city projects. Latin America follows similar patterns, though macroeconomic volatility keeps some deployments in pilot phases rather than full production.
- AO Kaspersky Lab
- Avast Software
- Bitdefender
- Lookout
- Malwarebytes
- McAfee
- Sophos
- Broadcom (Symantec)
- Trend Micro
- ESET
- Check Point Software
- CrowdStrike
- Cisco Secure Endpoint
- Quick Heal Technologies
- Zimperium
- F-Secure
- NortonLifeLock
- Panda Security
- Qihoo 360
- Tencent Mobile Manager
- Dr.Web
Additional Benefits:
- The market estimate (ME) sheet in Excel format
- 3 months of analyst support
TABLE OF CONTENTS
1 INTRODUCTION
- 1.1 Study Assumptions and Market Definition
- 1.2 Scope of the Study
2 RESEARCH METHODOLOGY
3 EXECUTIVE SUMMARY
4 MARKET LANDSCAPE
- 4.1 Market Overview
- 4.2 Market Drivers
- 4.2.1 Exploding mobile-specific malware variants post-Generative-AI era
- 4.2.2 BYOD 2.0 and hybrid-work driving corporate demand
- 4.2.3 Expansion of mobile payment ecosystems in emerging economies
- 4.2.4 Regulatory mandates for zero-trust on employee-owned devices
- 4.2.5 Rise of "app-clone" supply-chain attacks in 3rd-party Android stores
- 4.2.6 Proliferation of on-device AI security chips enabling premium, real-time scanning
- 4.3 Market Restraints
- 4.3.1 Persistently low consumer willingness to pay for mobile AV
- 4.3.2 OS-level security hardening shrinking threat surface
- 4.3.3 Geopolitical distrust of foreign cybersecurity vendors
- 4.3.4 Privacy-centric OS features reducing AV visibility
- 4.4 Value Chain Analysis
- 4.5 Regulatory Landscape
- 4.6 Technological Outlook
- 4.7 Porter's Five Forces Analysis
- 4.7.1 Bargaining Power of Suppliers
- 4.7.2 Bargaining Power of Buyers
- 4.7.3 Threat of New Entrants
- 4.7.4 Threat of Substitute Products
- 4.7.5 Intensity of Competitive Rivalry
- 4.8 Assessment of the Impact of Macroeconomic Trends on the Market
5 MARKET SIZE AND GROWTH FORECASTS (VALUE)
- 5.1 By Operating System
- 5.1.1 Android
- 5.1.2 iOS
- 5.1.3 Others
- 5.2 By Deployment Mode
- 5.2.1 On-premise
- 5.2.2 Cloud
- 5.3 By Solution Type
- 5.3.1 Stand-alone Mobile Antivirus Apps
- 5.3.2 Integrated Endpoint-Protection Suites
- 5.3.3 Security-as-a-Service (SECaaS) for Mobile
- 5.4 By End User
- 5.4.1 Enterprises
- 5.4.2 Consumers / Individuals
- 5.5 By Industry Vertical
- 5.5.1 BFSI
- 5.5.2 Healthcare
- 5.5.3 IT and Telecom
- 5.5.4 Government and Defense
- 5.5.5 Education
- 5.5.6 Others
- 5.6 By Geography
- 5.6.1 North America
- 5.6.1.1 United States
- 5.6.1.2 Canada
- 5.6.1.3 Mexico
- 5.6.2 Europe
- 5.6.2.1 Germany
- 5.6.2.2 United Kingdom
- 5.6.2.3 France
- 5.6.2.4 Italy
- 5.6.2.5 Spain
- 5.6.2.6 Rest of Europe
- 5.6.3 Asia-Pacific
- 5.6.3.1 China
- 5.6.3.2 Japan
- 5.6.3.3 India
- 5.6.3.4 South Korea
- 5.6.3.5 Australia
- 5.6.3.6 Rest of Asia-Pacific
- 5.6.4 South America
- 5.6.4.1 Brazil
- 5.6.4.2 Argentina
- 5.6.4.3 Rest of South America
- 5.6.5 Middle East and Africa
- 5.6.5.1 Middle East
- 5.6.5.1.1 Saudi Arabia
- 5.6.5.1.2 United Arab Emirates
- 5.6.5.1.3 Turkey
- 5.6.5.1.4 Rest of Middle East
- 5.6.5.2 Africa
- 5.6.5.2.1 South Africa
- 5.6.5.2.2 Egypt
- 5.6.5.2.3 Nigeria
- 5.6.5.2.4 Rest of Africa
- 5.6.1 North America
6 COMPETITIVE LANDSCAPE
- 6.1 Market Concentration
- 6.2 Strategic Moves
- 6.3 Market Share Analysis
- 6.4 Company Profiles (includes Global level Overview, Market level overview, Core Segments, Financials, Strategic Information, Market Rank/Share, Products and Services, Recent Developments)
- 6.4.1 AO Kaspersky Lab
- 6.4.2 Avast Software
- 6.4.3 Bitdefender
- 6.4.4 Lookout
- 6.4.5 Malwarebytes
- 6.4.6 McAfee
- 6.4.7 Sophos
- 6.4.8 Broadcom (Symantec)
- 6.4.9 Trend Micro
- 6.4.10 ESET
- 6.4.11 Check Point Software
- 6.4.12 CrowdStrike
- 6.4.13 Cisco Secure Endpoint
- 6.4.14 Quick Heal Technologies
- 6.4.15 Zimperium
- 6.4.16 F-Secure
- 6.4.17 NortonLifeLock
- 6.4.18 Panda Security
- 6.4.19 Qihoo 360
- 6.4.20 Tencent Mobile Manager
- 6.4.21 Dr.Web
7 MARKET OPPORTUNITIES AND FUTURE OUTLOOK
- 7.1 White-space and Unmet-Need Assessment
 行動反惡意軟體市場-全球產業規模、佔有率、趨勢、機會和預測(按作業系統、按部署、按最終用戶、按地區和競爭細分,2020-2030 年預測)
 2025 年至 2033 年惡意軟體分析市場規模、佔有率、趨勢和預測(按組件、部署模型、組織規模、行業垂直和地區分類)2025 年至 2033 年行動反惡意軟體市場報告(依作業系統、惡意軟體類型、使用者類型、產業和地區分類)
 2025 年惡意軟體分析全球市場報告
 惡意軟體分析市場規模、佔有率、成長分析,按組件、按組織規模、按部署模式、按解決方案類型、按行業、按地區 - 行業預測,2025-2032 年
 惡意軟體分析市場:按元件、組織規模、部署類型分類 - 2025-2030 年全球預測
 全球惡意軟體分析市場:依產品類型、最終用戶、地區:產業分析、規模、佔有率、成長、趨勢、預測(2024-2031)