


 |
市場調查報告書
商品編碼
1850307
物聯網分析:市場佔有率分析、產業趨勢、統計數據和成長預測(2025-2030 年)IoT Analytics - Market Share Analysis, Industry Trends & Statistics, Growth Forecasts (2025 - 2030) |
||||||
※ 本網頁內容可能與最新版本有所差異。詳細情況請與我們聯繫。
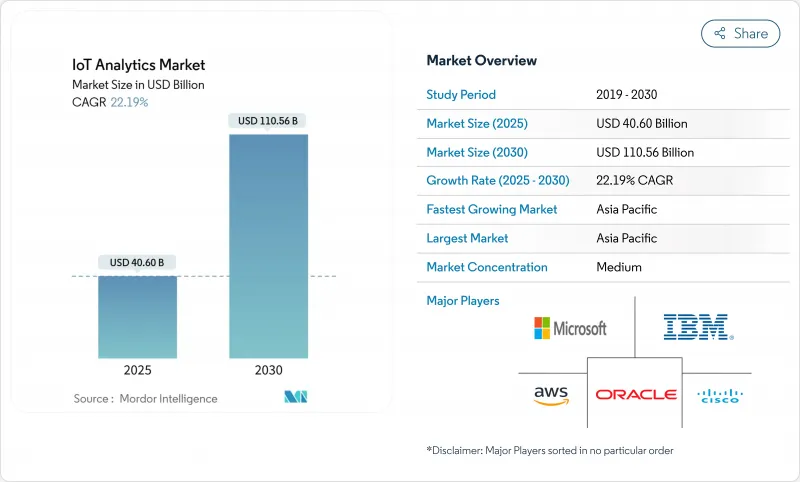
預計到 2025 年,物聯網分析市場規模將達到 406 億美元,到 2030 年將達到 1,105.6 億美元,在此期間的複合年成長率將達到 22.2%。
快速的設備普及、邊緣運算與人工智慧的融合以及企業數位轉型計畫正在推動這一擴張。企業正將分析工作負載遷移到更靠近互聯資產的位置,以降低延遲和頻寬成本,同時提升營運決策水準。資產密集型產業預測性維護的成功案例以及永續性要求對持續性能監控的呼聲,進一步刺激了市場需求。隨著雲端超大規模資料中心業者、專業供應商和邊緣平台供應商利用夥伴關係和收購來鞏固生態系統優勢,競爭日益激烈。
全球物聯網分析市場趨勢與洞察
物聯網設備的激增產生了Exabyte資料(以艾位元組為單位)。
連網型設備的數量正呈指數級成長,預計到2025年,全球物聯網終端每年將產生超過175Zetta位元組的數據。工廠級感測器陣列每天已經輸出Terabyte的數據,迫使企業在邊緣部署分析引擎,以避免雲端回程傳輸延遲。採用這種邊緣優先模式的製造商,其營運效率比純雲端部署模式提高了30%。海量資料涵蓋結構化遠端檢測、非結構化影片和日誌文件,因此需要投資能夠同時處理各種有效載荷的多模態分析框架。
企業廣泛採用的雲端原生分析平台
微軟 Azure IoT Operations 等付費使用制服務使企業能夠每天處理數十億條訊息,同時將基礎設施投資減少高達 60%。零信任架構和內建威脅分析降低了安全隱患,加速了製造業和物流業全面採用雲端技術。受嚴格監管的行業正擴大將雲端處理與本地處理相結合,隨著服務供應商不斷擴展其合規套件,這一趨勢仍然強勁。
資料隱私和跨境合規的複雜性
GDPR 規定了嚴格的同意、最小化和本地化規則,違規行為將佔全球收入的 4%。不同國家的法律迫使公司維護多個區域資料存儲,導致計劃預算增加高達 25%。即時跨境分析必須納入策略感知路由才能滿足主權法規的要求,從而減慢了企業部署速度。
細分分析
解決方案將繼續佔據主導地位,到2024年將佔總收入的68.7%。在物聯網分析領域,解決方案市場規模預計將穩定成長,但隨著企業尋求託管專業知識,服務類別預計將以24.0%的複合年成長率更快成長。專業服務對通訊協定映射、邊緣堆疊調優和多重雲端整合的需求將大幅成長。
人才短缺和日益複雜的架構使得外部合作夥伴更具吸引力。託管服務協議通常捆綁軟體、基礎設施和基於結果的服務等級協定 (SLA),將風險轉移給提供者。由於連網設備相關的攻擊面不斷擴大,安全分析細分市場蓬勃發展。
到2024年,本地安裝將佔據65.4%的市場佔有率,這反映了對控制、延遲和監管的需求。然而,隨著超大規模企業將資料擷取管道與無伺服器分析引擎結合,雲端實例將以24.1%的複合年成長率成長。混合設計將時間關鍵型工作負載路由到邊緣節點,同時將聚合資料傳送到雲端進行批次AI處理。
微軟和亞馬遜在可組合產品方面處於領先地位,使企業能夠在幾分鐘內建立數位雙胞胎並進行大規模模型訓練。供應鏈的不穩定和能源價格的波動凸顯了彈性運算的需求,並進一步推動了雲端運算的採用。
物聯網分析市場報告按組件(解決方案和服務)、部署方式(本地部署和雲端部署)、組織規模(大型企業和中小企業)、應用程式(預測性維護、資產性能管理、能源管理等)、最終用戶行業(製造業、能源和公共產業、運輸和物流、零售和電子商務等)以及地區進行細分。
區域分析
亞太地區預計到2024年將佔全球營收的35.6%,主要得益於「中國製造2025」和印度智慧城市計畫等政府計畫。該地區將以23.2%的複合年成長率成長,凸顯了工業數位化、5G部署和邊緣人工智慧試驗的規模。中國工廠正在實施基於視覺的品管,而印度市政當局則利用感測器網路來管理廢棄物和交通。
北美憑藉其成熟的雲端基礎設施和早期的人工智慧應用緊隨其後。在風險資金籌措和大學研究管道的推動下,企業正在將流分析整合到其數位營運中心。該地區將繼續成為自動駕駛和精密農業計劃的試驗田。
在歐洲,由ESG合規驅動的即時排放監測將迎來強勁成長。 「歐洲綠色新政」計劃將推動公用事業和製造業轉型為數據主導的效率提升模式。隨著通訊業者擴大NB-IoT和5G覆蓋範圍,拉丁美洲和中東等新興市場將獲得發展動力,從而推動物流、石油和公共待開發區部署。
其他福利:
- Excel 格式的市場預測 (ME) 表
- 3個月的分析師支持
目錄
第1章 引言
- 研究假設和市場定義
- 調查範圍
第2章調查方法
第3章執行摘要
第4章 市場狀況
- 市場概況
- 市場促進因素
- 物聯網設備的激增產生了Exabyte資料(以艾位元組為單位)。
- 雲端原生分析平台正逐漸被企業接受。
- 資產密集型產業對預測性維護的需求
- 邊緣AI加速器,實現亞秒邊緣分析
- 統一孤立物聯網資料流的企業資料架構架構
- 以環境、社會及公司治理(ESG)主導的永續性監督職責
- 市場限制
- 資料隱私和跨境合規的複雜性
- 物聯網資料科學人才短缺
- 工業通訊協定的碎片化阻礙了互通性
- 高頻感測器遙測頻寬成本不斷上漲
- 價值鏈分析
- 監管格局
- 技術展望
- 波特五力分析
- 供應商的議價能力
- 買方的議價能力
- 新進入者的威脅
- 替代品的威脅
- 競爭對手之間的競爭
- 投資分析
- 評估宏觀經濟趨勢對市場的影響
第5章市場規模及成長預測
- 按組件
- 解決方案
- 網管
- 安全分析
- 即時串流分析
- 資料管理和儲存分析
- 視覺化和儀表板
- 服務
- 專業服務
- 託管服務
- 解決方案
- 按部署
- 本地部署
- 雲
- 按公司規模
- 主要企業
- 小型企業
- 按用途
- 預測性維護
- 資產績效管理
- 能源管理
- 供應鍊和物流最佳化
- 其他用途
- 按最終用戶產業
- 製造業
- 能源和公共產業
- 運輸/物流
- 零售與電子商務
- 醫療保健和生命科學
- 其他終端用戶產業
- 按地區
- 北美洲
- 美國
- 加拿大
- 墨西哥
- 歐洲
- 德國
- 英國
- 法國
- 義大利
- 西班牙
- 俄羅斯
- 其他歐洲地區
- 亞太地區
- 中國
- 日本
- 印度
- 韓國
- 澳洲和紐西蘭
- 其他亞太地區
- 南美洲
- 巴西
- 阿根廷
- 其他南美
- 中東和非洲
- 中東
- 沙烏地阿拉伯
- 阿拉伯聯合大公國
- 土耳其
- 其他中東地區
- 非洲
- 南非
- 奈及利亞
- 其他非洲國家
- 北美洲
第6章 競爭態勢
- 市場集中度
- 策略趨勢
- 市佔率分析
- 公司簡介
- Microsoft Corporation
- Amazon Web Services, Inc.
- IBM Corporation
- Google LLC
- Cisco Systems, Inc.
- Oracle Corporation
- SAP SE
- Dell Technologies Inc.
- The Hewlett Packard Enterprise Company
- Teradata Corporation
- Salesforce, Inc.
- Accenture plc
- PTC Inc.
- Hitachi Vantara LLC
- Cloudera, Inc.
- Software AG
- SAS Institute Inc.
- Splunk Inc.
- C3.ai, Inc.
- Uptake Technologies Inc.
- GE Digital
- QlikTech International AB
第7章 市場機會與未來展望
The IoT analytics market size is USD 40.60 billion in 2025 and is forecast to reach USD 110.56 billion in 2030, registering a 22.2% CAGR over the period.
Rapid device proliferation, edge-AI convergence, and enterprise digital-transformation programs underpin this expansion. Enterprises are moving analytic workloads closer to connected assets, reducing latency and bandwidth costs while improving operational decisions. Demand is reinforced by predictive-maintenance success stories in asset-intensive sectors and by sustainability mandates that call for continuous performance monitoring. Competitive intensity is strengthening as cloud hyperscalers, specialist vendors, and edge-platform providers leverage partnerships and acquisitions to secure ecosystem advantages.
Global IoT Analytics Market Trends and Insights
Proliferation of IoT Devices Generating Exabyte-Scale Data
Connected-device counts are rising sharply, with global IoT endpoints expected to produce more than 175 zettabytes of data annually by 2025. Plant-level sensor arrays already emit terabytes each day, forcing enterprises to deploy analytics engines at the edge to avoid cloud-backhaul delays. Manufacturers adopting this edge-first model record 30% higher operational efficiency versus cloud-only setups. The data surge spans structured telemetry, unstructured video, and log files, prompting investment in multimodal analytic frameworks that can handle diverse payloads concurrently.
Cloud-Native Analytics Platforms Gaining Enterprise Acceptance
Scalable, pay-as-you-go services such as Microsoft Azure IoT Operations allow firms to ingest billions of daily messages while cutting infrastructure outlays by up to 60%. Zero-trust architectures and built-in threat analytics lessen security concerns, accelerating full-cloud adoption in manufacturing and logistics. Highly regulated verticals continue to blend cloud and local processing, but migration momentum remains strong as providers extend compliance toolkits.
Data-Privacy and Cross-Border Compliance Complexity
GDPR imposes stringent consent, minimization, and localization rules; non-compliance can cost 4% of global turnover. Divergent national laws force firms to maintain multiple regional data stores, inflating project budgets by up to 25%. Real-time analytics crossing borders must incorporate policy-aware routing to satisfy sovereignty mandates, slowing enterprise rollouts.
Other drivers and restraints analyzed in the detailed report include:
- Predictive-Maintenance Demand Across Asset-Intensive Industries
- Edge-AI Accelerators Enabling Sub-Second Analytics
- Shortage of IoT Data-Science Talent Pool
For complete list of drivers and restraints, kindly check the Table Of Contents.
Segment Analysis
Solutions continued to dominate, accounting for 68.7% revenue in 2024. The IoT analytics market size for solutions is forecast to increase steadily, yet the services category is set to expand faster at 24.0% CAGR as firms seek managed expertise. Professional services are in high demand for protocol mapping, edge-stack tuning, and multi-cloud integration.
The talent shortfall and rising architectural complexity make external partners attractive. Managed-service contracts often bundle software, infrastructure, and outcome-based SLAs, shifting risk to providers. Security-analytics sub-segments are buoyed by expanding attack surfaces tied to connected devices.
On-premise installations held 65.4% share in 2024, reflecting control, latency, and regulatory needs. Yet cloud instances are growing at 24.1% CAGR as hyperscalers couple ingestion pipelines with serverless analytic engines. Hybrid designs route time-critical workloads to edge nodes while sending aggregated data to the cloud for batch AI.
Microsoft and Amazon lead with composable offerings, enabling enterprises to spin up digital twins and large-scale model training within minutes. Supply-chain volatility and energy-price swings underline the need for elastic compute, further pushing cloud uptake.
The IoT Analytics Market Report is Segmented by Component (Solutions and Services), Deployment (On-Premise and Cloud), Organization Size (Large Enterprises and Small and Medium Enterprises (SMEs)), Application (Predictive Maintenance, Asset Performance Management, Energy Management, and More), End-User Industry (Manufacturing, Energy and Utilities, Transportation and Logistics, Retail and E-Commerce, and More), and Geography.
Geography Analysis
Asia-Pacific delivered 35.6% of 2024 revenue, benefiting from government programs such as "Made in China 2025" and India's Smart Cities Mission. Regional CAGR of 23.2% underscores the scale of industrial digitization, 5G rollout, and edge-AI pilots. Chinese factories deploy vision-based quality control, while Indian municipalities apply sensor networks to manage waste and traffic.
North America follows closely, with mature cloud infrastructure and early AI adoption. Enterprises integrate streaming analytics with digital-operations centers, aided by robust venture funding and university research pipelines. The region remains a test-bed for autonomous-mobility and precision-agriculture projects.
Europe posts steady growth as ESG compliance drives real-time emissions monitoring. Initiatives under the European Green Deal push utilities and manufacturers toward data-driven efficiency. Emerging markets in Latin America and the Middle East gain momentum as telecom operators extend NB-IoT and 5G coverage, enabling greenfield deployments in logistics, oil, and public safety.
- Microsoft Corporation
- Amazon Web Services, Inc.
- IBM Corporation
- Google LLC
- Cisco Systems, Inc.
- Oracle Corporation
- SAP SE
- Dell Technologies Inc.
- The Hewlett Packard Enterprise Company
- Teradata Corporation
- Salesforce, Inc.
- Accenture plc
- PTC Inc.
- Hitachi Vantara LLC
- Cloudera, Inc.
- Software AG
- SAS Institute Inc.
- Splunk Inc.
- C3.ai, Inc.
- Uptake Technologies Inc.
- GE Digital
- QlikTech International AB
Additional Benefits:
- The market estimate (ME) sheet in Excel format
- 3 months of analyst support
TABLE OF CONTENTS
1 INTRODUCTION
- 1.1 Study Assumptions and Market Definition
- 1.2 Scope of the Study
2 RESEARCH METHODOLOGY
3 EXECUTIVE SUMMARY
4 MARKET LANDSCAPE
- 4.1 Market Overview
- 4.2 Market Drivers
- 4.2.1 Proliferation of IoT devices generating exabyte-scale data
- 4.2.2 Cloud-native analytics platforms gaining enterprise acceptance
- 4.2.3 Predictive-maintenance demand across asset-intensive industries
- 4.2.4 Edge-AI accelerators enabling sub-second analytics at the edge
- 4.2.5 Enterprise data-fabric architectures unifying siloed IoT streams
- 4.2.6 ESG-driven sustainability monitoring mandates
- 4.3 Market Restraints
- 4.3.1 Data-privacy and cross-border compliance complexity
- 4.3.2 Shortage of IoT data-science talent pool
- 4.3.3 Industrial-protocol fragmentation hindering interoperability
- 4.3.4 Rising telemetry bandwidth costs for high-frequency sensors
- 4.4 Value Chain Analysis
- 4.5 Regulatory Landscape
- 4.6 Technological Outlook
- 4.7 Porter's Five Forces Analysis
- 4.7.1 Bargaining Power of Suppliers
- 4.7.2 Bargaining Power of Buyers
- 4.7.3 Threat of New Entrants
- 4.7.4 Threat of Substitutes
- 4.7.5 Intensity of Competitive Rivalry
- 4.8 Investment Analysis
- 4.9 Assessment of the Impact of Macroeconomic Trends on the Market
5 MARKET SIZE AND GROWTH FORECASTS (VALUE)
- 5.1 By Component
- 5.1.1 Solutions
- 5.1.1.1 Network Management
- 5.1.1.2 Security Analytics
- 5.1.1.3 Real-time Streaming Analytics
- 5.1.1.4 Data Management and Storage Analytics
- 5.1.1.5 Visualization and Dashboard
- 5.1.2 Services
- 5.1.2.1 Professional Services
- 5.1.2.2 Managed Services
- 5.1.1 Solutions
- 5.2 By Deployment
- 5.2.1 On-premise
- 5.2.2 Cloud
- 5.3 By Organisation Size
- 5.3.1 Large Enterprises
- 5.3.2 Small and Medium Enterprises (SMEs)
- 5.4 By Application
- 5.4.1 Predictive Maintenance
- 5.4.2 Asset Performance Management
- 5.4.3 Energy Management
- 5.4.4 Supply-Chain and Logistics Optimisation
- 5.4.5 Other Applications
- 5.5 By End-User Industry
- 5.5.1 Manufacturing
- 5.5.2 Energy and Utilities
- 5.5.3 Transportation and Logistics
- 5.5.4 Retail and E-Commerce
- 5.5.5 Healthcare and Life Sciences
- 5.5.6 Other End-User Industries
- 5.6 By Geography
- 5.6.1 North America
- 5.6.1.1 United States
- 5.6.1.2 Canada
- 5.6.1.3 Mexico
- 5.6.2 Europe
- 5.6.2.1 Germany
- 5.6.2.2 United Kingdom
- 5.6.2.3 France
- 5.6.2.4 Italy
- 5.6.2.5 Spain
- 5.6.2.6 Russia
- 5.6.2.7 Rest of Europe
- 5.6.3 Asia-Pacific
- 5.6.3.1 China
- 5.6.3.2 Japan
- 5.6.3.3 India
- 5.6.3.4 South Korea
- 5.6.3.5 Australia and New Zealand
- 5.6.3.6 Rest of Asia-Pacific
- 5.6.4 South America
- 5.6.4.1 Brazil
- 5.6.4.2 Argentina
- 5.6.4.3 Rest of South America
- 5.6.5 Middle East and Africa
- 5.6.5.1 Middle East
- 5.6.5.1.1 Saudi Arabia
- 5.6.5.1.2 United Arab Emirates
- 5.6.5.1.3 Turkey
- 5.6.5.1.4 Rest of Middle East
- 5.6.5.2 Africa
- 5.6.5.2.1 South Africa
- 5.6.5.2.2 Nigeria
- 5.6.5.2.3 Rest of Africa
- 5.6.1 North America
6 COMPETITIVE LANDSCAPE
- 6.1 Market Concentration
- 6.2 Strategic Moves
- 6.3 Market Share Analysis
- 6.4 Company Profiles (includes Global level Overview, Market level overview, Core Segments, Financials as available, Strategic Information, Market Rank/Share for key companies, Products and Services, and Recent Developments)
- 6.4.1 Microsoft Corporation
- 6.4.2 Amazon Web Services, Inc.
- 6.4.3 IBM Corporation
- 6.4.4 Google LLC
- 6.4.5 Cisco Systems, Inc.
- 6.4.6 Oracle Corporation
- 6.4.7 SAP SE
- 6.4.8 Dell Technologies Inc.
- 6.4.9 The Hewlett Packard Enterprise Company
- 6.4.10 Teradata Corporation
- 6.4.11 Salesforce, Inc.
- 6.4.12 Accenture plc
- 6.4.13 PTC Inc.
- 6.4.14 Hitachi Vantara LLC
- 6.4.15 Cloudera, Inc.
- 6.4.16 Software AG
- 6.4.17 SAS Institute Inc.
- 6.4.18 Splunk Inc.
- 6.4.19 C3.ai, Inc.
- 6.4.20 Uptake Technologies Inc.
- 6.4.21 GE Digital
- 6.4.22 QlikTech International AB
7 MARKET OPPORTUNITIES AND FUTURE OUTLOOK
- 7.1 White-space and Unmet-Need Assessment
 物聯網分析市場:按組件、連接技術、部署模式、產業和最終用途分類-2026-2032年全球市場預測物聯網分析市場:依分析類型、部署形式、組織規模及最終用戶產業分類-2026-2032年全球預測
 物聯網 (AoT) 市場規模、佔有率和成長分析:按組件、組織規模、技術、部署模式、應用類型、行業和地區分類 - 2026-2033 年行業預測
 物聯網分析市場規模、佔有率、成長及全球產業分析:按類型、應用和地區分類的洞察,2026-2034 年預測智慧數位貨架分析平台市場:按組件、部署模式、組織規模、分析類型和最終用戶產業分類,全球預測(2026-2032年)
 物聯網分析市場規模、佔有率和成長分析(按類型、組件、組織規模、部署模式、應用、最終用戶產業和地區分類)-2026-2033年產業預測
 物聯網分析市場-全球產業規模、佔有率、趨勢、機會和預測,按分析類型、服務類型、最終用戶、地區和競爭細分,2020-2030 年預測
 全球物聯網分析市場規模研究與預測,依組件、部署、類型、應用和區域預測,2025-2035
 全球物聯網 (IoT) 分析市場:市場規模、佔有率、趨勢、行業分析(按組件、組織規模、部署方法、類型、應用、最終用途和地區)、未來預測(2025-2034 年)
 全球物聯網分析市場,2024-2028