


 |
市場調查報告書
商品編碼
1850265
人工智慧影像識別:市場佔有率分析、行業趨勢、統計數據和成長預測(2025-2030 年)AI Image Recognition - Market Share Analysis, Industry Trends & Statistics, Growth Forecasts (2025 - 2030) |
||||||
※ 本網頁內容可能與最新版本有所差異。詳細情況請與我們聯繫。
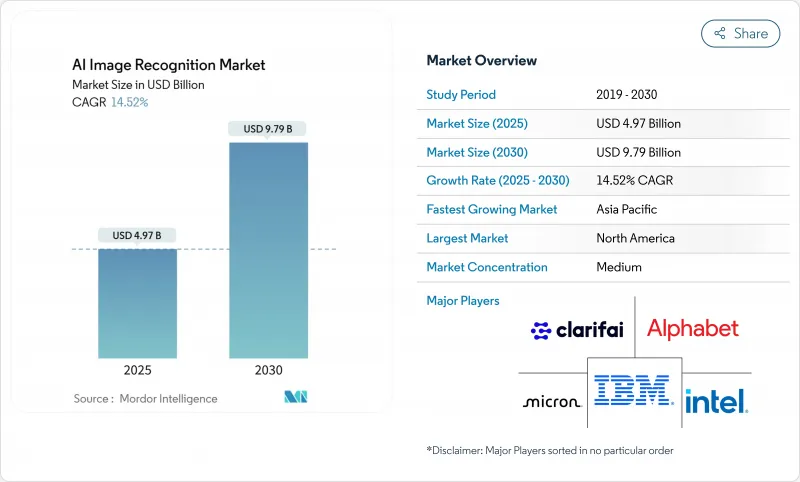
預計2025年AI影像識別市場規模為49.7億美元,到2030年將達到97.9億美元,複合年成長率為14.52%。
這一成長源自於企業對自動化視覺智慧的依賴,其應用範圍涵蓋從工廠車間到診斷實驗室的各個環節。晶片成本的下降、多模態基礎模型的出現以及邊緣硬體的日益成熟,正在降低總體擁有成本,使大規模部署在經濟上可行。供應商正將資金投入垂直整合的架構中,將晶片、軟體和服務捆綁在一起,從而簡化採購流程並加快部署速度。同時,合成數據引擎正在降低標註預算,並擴大先前缺乏標註圖像的中型企業獲取標註圖像的管道。綜上所述,這些趨勢有望推動人工智慧影像識別市場持續保持兩位數的成長。
全球人工智慧影像識別市場趨勢與洞察
雲端原生人工智慧應用蓬勃發展
超大規模雲端服務供應商提供容器化視覺管線,可在數週內將模型從原型部署到生產環境,從而縮短製造商和零售商的價值實現時間。微軟 Azure 和谷歌雲端正在推出包裝好的缺陷偵測藍圖,降低了機器學習人員有限的公司的進入門檻。 Kubernetes編配的推理端點僅在映像到達時才分配運算資源,與固定部署的本地叢集相比,可節省 15% 至 40% 的成本。因此,人工智慧影像識別市場受益於更快的採購週期和更廣泛的用戶群。
高解析度相機的普及
第五代汽車ADAS單元和8K工業感測器如今與設備端AI加速器相結合,無需網路往返即可實現低於50毫秒的推理速度。大陸集團的MFC525相機可在提供110度視場角的同時進行局部物體分類,而三星最新的神經網路引擎在消費級智慧型手機中實現了38 TOPS的運算速度。這些功能解鎖了即時品管和身臨其境型AR功能,從而拓展了AI影像識別市場。
資料隱私和合規障礙
歐盟人工智慧法規和加州法規都要求嚴格的審核追蹤,導致醫療影像部署的檢驗成本增加高達30%。相互衝突的資料居住義務迫使採用雙棧架構,這減緩了沒有專門隱私團隊的中型醫院的採用速度。這些摩擦正在抑制人工智慧影像識別市場的成長勢頭。
細分分析
儘管硬體在2024年將佔總收入的45.6%,但服務將以14.9%的複合年成長率超越所有其他類別。 NVIDIA和Intel的邊緣攝影機和推理晶片將延遲降低到50毫秒以下,從而推動了製造工廠的棕地維修。軟體,尤其是低程式碼模型操作平台,正在幫助那些缺乏深厚資料科學基礎的公司創建客製化的流程。同時,專業服務提供者正在建立領域最佳化的資料集和持續學習工作流程,以在最初的概念驗證階段之後,進一步提高生產精度。這種從關注單一產品轉向關注整體成果的趨勢,正在擴大整合商在人工智慧影像識別市場中的佔有率。
醫院、銀行和國防機構必須將影像保存在本地防火牆內,這導致2024年本地部署系統數量增加了68.7%。礦山、船舶和遠端工廠等邊緣場景也體現了這種偏好,因為這些場景的間歇性連接使得雲端往返成為不可能。儘管如此,隨著彈性GPU池能夠處理大量季節性或突發性影像管線,雲工作負載仍以16.7%的複合年成長率成長。混合拓撲結構將邊緣預處理與雲端重訓練相結合,使企業能夠集中利用百億億次級資料集,同時在邊緣協調推理。這種混合模式既能享受超大規模資料中心的經濟效益,又能保持合規性,進而推動人工智慧影像識別市場的長期成長。
區域分析
預計到2024年,北美將佔全球收入的27.8%,這得益於其密集的資金籌措生態系統和國內晶片製造項目,例如台積電在亞利桑那州投資1,650億美元的園區。企業併購,例如Meta對Scale AI148億美元的投資,正在推動該地區的研發步伐。政府為增強半導體產業的韌性而提供的誘因也進一步支持了美國和加拿大的AI影像識別市場。
在歐洲嚴格的人工智慧法律法規的推動下,人工智慧技術的應用正緩慢但穩定地推進。德國重工業巨頭正將人工智慧概念融入自動化組裝領域,而法國新興企業則在GDPR的保護下不斷完善臨床決策支援系統。投資既謹慎又目標明確,優先考慮那些能夠展現透明度和消除偏見能力的供應商。這種嚴謹的態度正在影響整個人工智慧影像識別市場的解決方案設計。
亞太地區將達到最高的複合年成長率,達到15.9%。中國已撥出超過700億美元的多年預算用於智慧城市和監控網路建設。日本650億美元的半導體計畫以及韓國在HBM記憶體領域的領先地位,將建構一個垂直整合的供應鏈。印度的開發者群體將以具有競爭力的價格提供全球模型調優服務,共同加速人工智慧影像識別市場的發展。
其他福利:
- Excel格式的市場預測(ME)表
- 3個月的分析師支持
目錄
第1章 引言
- 研究假設和市場定義
- 調查範圍
第2章調查方法
第3章執行摘要
第4章 市場情勢
- 市場概況
- 市場促進因素
- 雲端原生人工智慧採用率的激增
- 高解析度相機的普及
- 零售損失預防措施
- 智慧城市和監控基礎設施的擴展
- 合成資料管道顯著降低標籤成本
- 衛星圖像公司開放原始碼標籤的資料集
- 市場限制
- 資料隱私和合規障礙
- 特定領域人力資源短缺
- GPU供應鏈的地緣政治因素加劇了資本投資風險。
- 有偏見的演算法會增加法律風險
- 供應鏈分析
- 監管格局
- 技術展望(邊緣推理與雲推理)
- 波特五力模型
- 買方的議價能力
- 供應商的議價能力
- 新進入者的威脅
- 替代品的威脅
- 競爭程度
- 宏觀經濟因素評估
第5章 市場規模與成長預測
- 按組件
- 硬體
- 軟體
- 服務
- 按部署模型
- 雲
- 本地部署
- 按用途
- 影像分類
- 物體偵測與追蹤
- 臉部辨識
- 工業檢測
- 醫學影像
- 其他利基應用
- 按最終用戶產業
- 車
- BFSI
- 醫療保健提供者和醫療技術
- 零售與電子商務
- 安全和監控整合商
- 製造業
- 其他(農業、能源等)
- 按地區
- 北美洲
- 美國
- 加拿大
- 墨西哥
- 南美洲
- 巴西
- 阿根廷
- 其他南美
- 歐洲
- 德國
- 英國
- 法國
- 義大利
- 西班牙
- 其他歐洲地區
- 亞太地區
- 中國
- 日本
- 印度
- 韓國
- 澳洲
- 其他亞太地區
- 中東和非洲
- 中東
- 沙烏地阿拉伯
- 阿拉伯聯合大公國
- 土耳其
- 其他中東地區
- 非洲
- 南非
- 奈及利亞
- 埃及
- 其他非洲國家
- 北美洲
第6章 競爭情勢
- 市場集中度
- 策略趨勢
- 市佔率分析
- 公司簡介
- Google(Alphabet)
- Clarifai
- IBM
- Intel
- Micron Technology
- Microsoft
- NVIDIA
- Qualcomm
- Samsung Electronics
- AMD/Xilinx
- Apple
- SenseTime
- Hikvision
- Megvii
- NEC Corporation
- Cognex
- Zebra Technologies
- Huawei Technologies
- Palantir
第7章 市場機會與未來展望
The AI image recognition market size is estimated at USD 4.97 billion in 2025 and is forecast to reach USD 9.79 billion by 2030, reflecting a 14.52% CAGR.
This expansion is rooted in enterprise reliance on automated visual intelligence that now stretches from factory floors to diagnostic suites. Falling silicon costs, multimodal foundation models, and maturing edge hardware keep total cost of ownership on a downward trajectory, making large-scale rollouts economically viable. Vendors redirect capital toward vertically integrated stacks that bundle chips, software, and services, streamlining procurement cycles and boosting deployment velocity. Meanwhile, synthetic data engines shrink labeling budgets, broadening participation for mid-sized firms that previously lacked annotated imagery. Collectively, these trends position the AI image recognition market for durable double-digit growth.
Global AI Image Recognition Market Trends and Insights
Cloud-Native AI Adoption Boom
Hyperscale providers deliver containerized vision pipelines that push models from prototype to production inside weeks, trimming time-to-value for manufacturers and retailers. Microsoft Azure and Google Cloud showcase packaged defect-detection blueprints that lower entry barriers for firms with limited ML staff. Kubernetes-orchestrated inference endpoints allocate compute only when imagery arrives, enabling 15-40% cost savings versus fixed on-premise clusters. As a result, the AI image recognition market benefits from faster procurement cycles and broader user diversity.
Proliferation of High-Resolution Cameras
Fifth-generation automotive ADAS units and 8K industrial sensors now pair with on-device AI accelerators that deliver sub-50 ms inference without network round-trips. Continental's MFC525 camera offers a 110-degree field of view while performing object classification locally, and Samsung's latest neural engines hit 38 TOPS inside consumer smartphones. These capabilities unlock real-time quality control and immersive AR functions, widening the addressable base of the AI image recognition market.
Data-Privacy and Compliance Hurdles
The EU AI Act and California statutes impose robust audit trails, inflating validation costs by up to 30% for medical-imaging deployments. Conflicting data-residency mandates compel dual-stack architectures, slowing rollouts among mid-size hospitals that lack dedicated privacy teams. Such friction tempers growth momentum in the AI image recognition market.
Other drivers and restraints analyzed in the detailed report include:
- Retail Loss-Prevention Initiatives
- Synthetic Data Pipelines Slashing Labelling Cost
- GPU Supply Chain Geopolitics Elevating Capex Risk
For complete list of drivers and restraints, kindly check the Table Of Contents.
Segment Analysis
Hardware controlled 45.6% of 2024 revenue, yet services post a 14.9% CAGR that outpaces all other categories. Edge-ready cameras and inference chips from NVIDIA and Intel lower latency below 50 ms, energizing brownfield retrofits in manufacturing plants. Software, especially low-code model-ops platforms, eases custom pipeline creation for firms without deep data-science benches. Meanwhile, professional services providers craft domain-tuned datasets and continuous-learning workflows that elevate production accuracy beyond initial proof points. This shift toward holistic outcomes rather than discrete products broadens wallet share for integrators inside the AI image recognition market.
On-premises systems retained 68.7% revenue in 2024 because hospitals, banks, and defense agencies must keep imagery within local firewalls. Edge scenarios in mines, ships, and remote factories mirror this preference, where intermittent connectivity precludes cloud round-trips. Even so, cloud workloads grow at 16.7% CAGR as elastic GPU pools absorb seasonal or burst-heavy image pipelines. Hybrid topologies marry edge preprocessing with cloud retraining, letting enterprises tune inference at the edge while leveraging petascale datasets centrally. This blended paradigm safeguards compliance yet benefits from hyperscaler economics, reinforcing long-run expansion of the AI image recognition market.
AI Image Recognition Market Report is Segmented by Type (Hardware, Software, and Services), Deployment Model (Cloud, On-Premises), Application (Image Classification, Object Detection and Tracking, Facial Recognition, and More), End-User Industry (Automotive, BFSI, and More), and by Geography. The Market Forecasts are Provided in Terms of Value (USD).
Geography Analysis
North America held 27.8% revenue in 2024, buoyed by a dense funding ecosystem and domestic chip fabrication initiatives such as TSMC's USD 165 billion Arizona campus. Corporate M&A, evidenced by Meta's USD 14.8 billion stake in Scale AI, intensifies regional R&D velocity. Government incentives for semiconductor resilience further anchor the AI image recognition market in the United States and Canada.
Europe exhibits moderated yet steady adoption, framed by the bloc's stringent AI Act. German heavy-industry leaders weave vision into automated assembly, while French startups refine clinical decision support under GDPR safeguards. Investment remains disciplined but targeted, favoring vendors able to certify transparency and bias mitigation. Such rigor shapes solution design across the AI image recognition market.
Asia-Pacific shows the highest trajectory at 15.9% CAGR. China allocates multiyear budgets topping USD 70 billion for smart-city and surveillance grids. Japan's USD 65 billion semiconductor program and South Korea's leadership in HBM memory create a vertically integrated supply base. India's developer pool sustains global model-tuning services at competitive rates, collectively accelerating the AI image recognition market.
- Google (Alphabet)
- Clarifai
- IBM
- Intel
- Micron Technology
- Microsoft
- NVIDIA
- Qualcomm
- Samsung Electronics
- AMD/Xilinx
- Apple
- SenseTime
- Hikvision
- Megvii
- NEC Corporation
- Cognex
- Zebra Technologies
- Huawei Technologies
- Palantir
Additional Benefits:
- The market estimate (ME) sheet in Excel format
- 3 months of analyst support
TABLE OF CONTENTS
1 INTRODUCTION
- 1.1 Study Assumptions and Market Definition
- 1.2 Scope of the Study
2 RESEARCH METHODOLOGY
3 EXECUTIVE SUMMARY
4 MARKET LANDSCAPE
- 4.1 Market Overview
- 4.2 Market Drivers
- 4.2.1 Cloud-native AI adoption boom
- 4.2.2 Proliferation of high-resolution cameras
- 4.2.3 Retail loss-prevention initiatives
- 4.2.4 Expansion of Smart Cities and Surveillance Infrastructure
- 4.2.5 Synthetic data pipelines slashing labeling cost
- 4.2.6 Satellite imagery firms open-sourcing labeled sets
- 4.3 Market Restraints
- 4.3.1 Data-privacy and compliance hurdles
- 4.3.2 Shortage of domain-specific talent
- 4.3.3 GPU supply chain geopolitics elevating capex risk
- 4.3.4 Rising legal exposure from biased algorithms
- 4.4 Supply-Chain Analysis
- 4.5 Regulatory Landscape
- 4.6 Technological Outlook (Edge vs Cloud inference)
- 4.7 Porter's Five Forces
- 4.7.1 Bargaining Power of Buyers
- 4.7.2 Bargaining Power of Suppliers
- 4.7.3 Threat of New Entrants
- 4.7.4 Threat of Substitutes
- 4.7.5 Degree of Competition
- 4.8 Assessment of Macroeconomic Factors
5 MARKET SIZE AND GROWTH FORECASTS (VALUE)
- 5.1 By Component
- 5.1.1 Hardware
- 5.1.2 Software
- 5.1.3 Services
- 5.2 By Deployment Model
- 5.2.1 Cloud
- 5.2.2 On-premises
- 5.3 By Application
- 5.3.1 Image Classification
- 5.3.2 Object Detection and Tracking
- 5.3.3 Facial Recognition
- 5.3.4 Industrial Inspection
- 5.3.5 Medical Imaging
- 5.3.6 Other Niche Applications
- 5.4 By End-user Industry
- 5.4.1 Automotive
- 5.4.2 BFSI
- 5.4.3 Healthcare Providers and Med-tech
- 5.4.4 Retail and E-commerce
- 5.4.5 Security and Surveillance Integrators
- 5.4.6 Manufacturing
- 5.4.7 Others (Agriculture, Energy, etc.)
- 5.5 By Geography
- 5.5.1 North America
- 5.5.1.1 United States
- 5.5.1.2 Canada
- 5.5.1.3 Mexico
- 5.5.2 South America
- 5.5.2.1 Brazil
- 5.5.2.2 Argentina
- 5.5.2.3 Rest of South America
- 5.5.3 Europe
- 5.5.3.1 Germany
- 5.5.3.2 United Kingdom
- 5.5.3.3 France
- 5.5.3.4 Italy
- 5.5.3.5 Spain
- 5.5.3.6 Rest of Europe
- 5.5.4 Asia-Pacific
- 5.5.4.1 China
- 5.5.4.2 Japan
- 5.5.4.3 India
- 5.5.4.4 South Korea
- 5.5.4.5 Australia
- 5.5.4.6 Rest of Asia-Pacific
- 5.5.5 Middle East and Africa
- 5.5.5.1 Middle East
- 5.5.5.1.1 Saudi Arabia
- 5.5.5.1.2 United Arab Emirates
- 5.5.5.1.3 Turkey
- 5.5.5.1.4 Rest of Middle East
- 5.5.5.2 Africa
- 5.5.5.2.1 South Africa
- 5.5.5.2.2 Nigeria
- 5.5.5.2.3 Egypt
- 5.5.5.2.4 Rest of Africa
- 5.5.1 North America
6 COMPETITIVE LANDSCAPE
- 6.1 Market Concentration
- 6.2 Strategic Moves
- 6.3 Market Share Analysis
- 6.4 Company Profiles (includes Global level Overview, Market level overview, Core Segments, Financials as available, Strategic Information, Market Rank/Share for key companies, Products and Services, and Recent Developments)
- 6.4.1 Google (Alphabet)
- 6.4.2 Clarifai
- 6.4.3 IBM
- 6.4.4 Intel
- 6.4.5 Micron Technology
- 6.4.6 Microsoft
- 6.4.7 NVIDIA
- 6.4.8 Qualcomm
- 6.4.9 Samsung Electronics
- 6.4.10 AMD/Xilinx
- 6.4.11 Apple
- 6.4.12 SenseTime
- 6.4.13 Hikvision
- 6.4.14 Megvii
- 6.4.15 NEC Corporation
- 6.4.16 Cognex
- 6.4.17 Zebra Technologies
- 6.4.18 Huawei Technologies
- 6.4.19 Palantir
7 MARKET OPPORTUNITIES AND FUTURE OUTLOOK
- 7.1 White-space and Unmet-need Assessment


