


 |
市場調查報告書
商品編碼
1850258
虛擬化安全:市場佔有率分析、產業趨勢、統計數據和成長預測(2025-2030 年)Virtualization Security - Market Share Analysis, Industry Trends & Statistics, Growth Forecasts (2025 - 2030) |
||||||
※ 本網頁內容可能與最新版本有所差異。詳細情況請與我們聯繫。
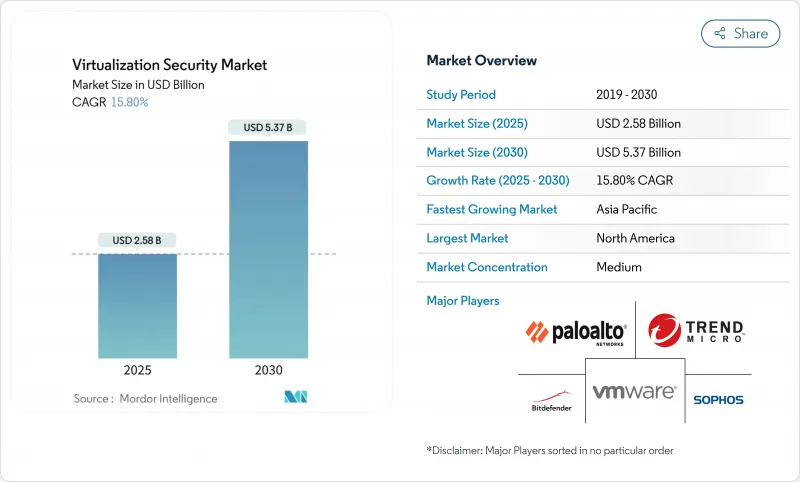
預計到 2025 年,虛擬化安全市場規模將達到 25.8 億美元,到 2030 年將達到 53.7 億美元,預測期(2025-2030 年)的複合年成長率為 15.80%。
混合雲端雲和多重雲端部署、廠商平台整合以及機密運算的日益普及,使得可擴展控制的需求持續高漲。博通與 VMware 的整合表明,捆綁式私有雲端訂閱如何能夠提升收益和利潤率,也印證了企業對統一技術堆疊的偏好。同時,人工智慧驅動的攻擊面發現將微隔離從可選附加元件功能提升為基本要求。諸如英特爾 VT-rp 之類的硬體輔助防禦技術表明,隨著威脅行為者將目標對準虛擬機器管理程式的記憶體轉換路徑,晶片創新正成為虛擬化安全市場的重要組成部分。
全球虛擬化安全市場趨勢與洞察
混合雲和多重雲端採用激增
博通預測 VMware Cloud Foundation 在 2024 會計年度的營收將達到 215 億美元,這表明客戶需要一個能夠跨越私有雲端雲和公共雲端的單一控制平面。隨著工作負載在不同環境間遷移,東西向可視性變得與邊界防禦同等重要。 Azure 機密虛擬機器展示了可信任執行環境如何在保持使用中加密的同時實現無縫遷移。以身分為中心和零信任模型取代了傳統的邊界區域分類,因為策略必須針對每個工作負載而非每個子網路執行。付費使用制確保了即使預算緊張,現代化計劃也不會停滯不前。
嚴格的資料保護條例(GDPR、CCPA、DPDPA)
印度的新《資料保護與隱私法案》(DPDPA) 規定了明確的用途限制和跨境傳輸限制,這些都必須納入虛擬化藍圖。馬來西亞和越南也有類似的規定,要求提供審核追蹤和強化密鑰管治。醫療保健系統正在採用符合 HIPAA 標準的虛擬工作空間,以防止電子健康資訊 (ePHI) 儲存在個人裝置上,同時確保遠距臨床醫生能夠安全地工作。由於違規的金額已超過許可費用,虛擬化安全市場正在將隱私設計原則融入所有版本中。
專業安防設備的初始成本很高
KubeVirt 和 OpenShift 被認為是比傳統 vSphere 授權更具成本效益的替代方案。調查顯示,78% 的中小企業沒有為其虛擬伺服器安裝防毒軟體,48% 的企業因預算限制而沒有合適的防火牆。可信任晶片的供應中斷正在推高設備成本並延緩更新換代週期。
細分分析
到2024年,解決方案將佔據虛擬化安全市場佔有率的64.2%。 Palo Alto Networks的下一代安全產品年度經常性收入(ARR)將成長34%,達到48億美元,這清楚地表明平台化正受到買家的青睞。服務也將延續這一成長勢頭,以19.1%的複合年成長率成長,因為複雜的混合架構需要第三方專業知識。像Fortinet這樣的供應商正在將收購的產品(例如Lacework)整合到一個統一的架構中,從而減少工具的分散性,並促使客戶簽訂更長期的合約。因此,市場區隔傾向於將CNAPP、微隔離和零信任網路存取整合到單一授權中的捆綁產品。
中小企業受益於SaaS消費模式,這種模式透過免除前期設備成本和人員負擔,實現了服務的普及化。因此,服務提供者正瞄準這個尚未被廣泛採用的細分市場,提供現成的部署方案和月度訂閱定價模式。
由於硬體/伺服器虛擬化在隔離虛擬機器方面發揮基礎性作用,預計到 2024 年,其市場佔有率將保持在 46.3%。英特爾 VT-rp 技術體現了矽層安全加固的概念,它能夠阻止分頁結構篡改並加強虛擬機管理程式信任邊界,而思科 Hypershield 等原生 AI 架構則在分散式 Pod 中整合了核心級策略執行機制。隨著 OT 工廠將感測器和 PLC 虛擬化,需要確定性且安全的流量,網路層虛擬化安全市場規模將進一步擴大。
虛擬化安全市場按元件(解決方案和服務)、虛擬化層(硬體/伺服器虛擬化、應用程式虛擬化等)、部署類型(本地部署、私有雲端等)、最終用戶產業(IT 和電信、銀行、金融服務和保險、醫療保健和生命科學等)、組織規模(大型企業和中小企業)以及地區進行細分。
區域分析
預計到2024年,北美地區的營收將佔全球總營收的35.26%,這主要得益於零信任架構的早期應用以及HIPAA和CCPA等嚴格的產業法規。為了縮短回饋週期並加快功能交付速度,供應商正將研發和通路生態系統集中到美國。
亞太地區是高速成長的引擎,預計到2030年將以每年18.1%的速度成長。印度的《資料保護和個人資料保護法》(DPDPA)以及馬來西亞嚴格的資料負責人要求也將推動中型企業採用符合審核要求的虛擬化技術。中國、越南和泰國的製造業叢集將實現本地工作負載的虛擬化,並推動邊緣安全產品的出貨量成長。
歐洲在 GDPR 的指導下繼續穩步前進,Schrems II 裁決促使人們更加關注機密運算證書,以滿足數據傳輸要求,而海灣合作理事會國家正在將石油收入投入智慧城市和電子政府計劃,並依靠安全的虛擬化雲端。
其他福利:
- Excel格式的市場預測(ME)表
- 3個月的分析師支持
目錄
第1章 引言
- 研究假設和市場定義
- 調查範圍
第2章調查方法
第3章執行摘要
第4章 市場情勢
- 市場概況
- 市場促進因素
- 混合雲端和多重雲端採用率激增
- 嚴格的資料保護條例(GDPR、CCPA、DPDPA)
- 邊緣資料中心虛擬機器和容器工作負載的爆炸性成長
- 虛擬機器管理程式許可證價格上漲推動開放原始碼機器管理程式的發展
- 人工智慧驅動的攻擊面偵測推動了對微隔離的需求
- 機密運算認證成為採購標準
- 市場限制
- 專業安防設備的前期成本很高
- 缺乏熟練的虛擬安全工程師
- 虛擬機器激增使零信任部署變得複雜
- 量子就緒加密貨幣溢價減緩購買週期
- 產業價值鏈分析
- 監管格局
- 技術展望
- 產業吸引力-波特五力分析
- 新進入者的威脅
- 買方的議價能力
- 供應商的議價能力
- 替代品的威脅
- 競爭對手之間的競爭
- 影響市場的宏觀經濟因素
第5章 市場規模及成長預測(數值)
- 按組件
- 解決方案
- 服務
- 透過虛擬化層
- 硬體/伺服器虛擬化
- 應用程式虛擬化
- 網路和SD-WAN虛擬化
- 儲存虛擬化
- 依部署方式
- 本地部署
- 私有雲端
- 公共雲端
- 混合雲端
- 按最終用戶產業
- 資訊科技和通訊
- BFSI
- 醫療保健和生命科學
- 政府和國防
- 零售與電子商務
- 製造業
- 其他終端用戶產業
- 按組織規模
- 主要企業
- 小型企業
- 按地區
- 北美洲
- 美國
- 加拿大
- 墨西哥
- 南美洲
- 巴西
- 阿根廷
- 智利
- 其他南美
- 歐洲
- 德國
- 英國
- 法國
- 義大利
- 西班牙
- 俄羅斯
- 其他歐洲地區
- 亞太地區
- 中國
- 印度
- 日本
- 韓國
- 馬來西亞
- 新加坡
- 澳洲
- 其他亞太地區
- 中東和非洲
- 中東
- 阿拉伯聯合大公國
- 沙烏地阿拉伯
- 土耳其
- 其他中東地區
- 非洲
- 南非
- 奈及利亞
- 其他非洲國家
- 北美洲
第6章 競爭情勢
- 市場集中度
- 策略趨勢
- 市佔率分析
- 公司簡介
- VMware Inc.(Broadcom Inc.)
- Trend Micro Inc.
- Sophos Ltd.
- Bitdefender LLC
- Palo Alto Networks Inc.
- Fortinet Inc.
- Check Point Software Technologies Ltd.
- Cisco Systems Inc.
- Juniper Networks Inc.
- Kaspersky Lab
- McAfee LLC
- IBM Corporation
- Microsoft Corporation
- Citrix Systems Inc.
- Red Hat Inc.
- Nutanix Inc.
- Parallels International GmbH
- Sangfor Technologies Inc.
- Guardicore(Akamai Technologies)
- Illumio Inc.
- Acronis International GmbH
- Symantec Enterprise Division(Broadcom)
- Hillstone Networks
- Radware Ltd.
- Tenable Holdings Inc.
第7章 市場機會與未來趨勢
- 閒置頻段與未滿足需求評估
The Virtualization Security Market size is estimated at USD 2.58 billion in 2025, and is expected to reach USD 5.37 billion by 2030, at a CAGR of 15.80% during the forecast period (2025-2030).
Rising hybrid and multi-cloud rollouts, vendor platform consolidation, and confidential-computing adoption keep demand for scalable controls high. Broadcom's integration of VMware illustrates how bundled private-cloud subscriptions can lift both revenue and margins, underscoring enterprises' preference for unified stacks. At the same time, AI-driven attack-surface discovery pushes micro-segmentation from an optional add-on to a baseline requirement. Hardware-assisted defenses, such as Intel VT-rp, show that silicon innovation is now an essential layer in the virtualization security market as threat actors target hypervisor memory translation paths.
Global Virtualization Security Market Trends and Insights
Hybrid and Multi-Cloud Adoption Surge
Broadcom lifted VMware Cloud Foundation revenue to USD 21.5 billion in fiscal 2024, proving that customers want a single control plane across private and public clouds. As workloads hop among environments, east-west visibility becomes as critical as perimeter defense. Azure Confidential VMs show how trusted execution environments can preserve encryption in use while enabling seamless migration. Identity-centric and zero-trust models now replace traditional perimeter zoning because policies have to follow each workload, not each subnet. Pay-as-you-go consumption also keeps enterprises from stalling modernization projects when budgets tighten.
Strict Data-Protection Regulations (GDPR, CCPA, DPDPA)
India's new DPDPA rules mandate explicit purpose limitation and cross-border transfer restrictions that must be embedded into virtualization blueprints. Similar mandates in Malaysia and Vietnam drive demand for built-in audit trails and encryption key governance. Healthcare systems adopt HIPAA-compliant virtual workspaces, keeping ePHI off personal devices while allowing remote clinicians to work securely. Penalties for non-compliance now outweigh license fees, so the virtualization security market embeds privacy-by-design principles into every release.
High Up-Front Cost of Specialized Security Appliances
KubeVirt and OpenShift are evaluated as cost-effective alternatives to traditional vSphere licenses, especially after Broadcom's pricing changes. Surveys show 78% of small businesses lack antivirus for virtual servers, while 48% run without proper firewalls due to budget limits. Trusted-chip supply disruptions inflate appliance costs, delaying refresh cycles.
Other drivers and restraints analyzed in the detailed report include:
- Explosive VM and Container Workload Growth in Edge Data-Centers
- AI-Driven Attack-Surface Discovery Boosting Micro-Segmentation Demand
- Shortage of Skilled Virtual-Security Engineers
For complete list of drivers and restraints, kindly check the Table Of Contents.
Segment Analysis
Solutions accounted for 64.2% of the virtualization security market share in 2024 as enterprises gravitated toward integrated suites rather than piecemeal tools. Palo Alto Networks' Next-Generation Security ARR climbed 34% to USD 4.8 billion, a clear indicator that platformization resonates with buyers. Services replicate this momentum, growing at 19.1% CAGR because intricate hybrid designs require third-party expertise. Vendors like Fortinet fold acquisitions such as Lacework into a single fabric, shrinking tool sprawl, and locking customers into longer contracts. The virtualization security market size is, therefore, skewing toward bundled offerings that combine CNAPP, micro-segmentation, and zero-trust network access in one license.
Smaller enterprises benefit from SaaS consumption patterns that remove up-front appliance costs and staffing burdens, democratizing access. As a result, service providers target this under-penetrated tier with off-the-shelf deployment blueprints and monthly subscription pricing.
Hardware/Server Virtualization retained a 46.3% share in 2024 owing to its foundational role in VM isolation. Intel VT-rp exemplifies hardening at the silicon layer, obstructing paging structure tampering and reinforcing hypervisor trust boundaries. Yet, Network and SD-WAN Virtualization will outpace all layers, registering an 18.3% CAGR as AI-native fabrics like Cisco Hypershield embed kernel-level policy enforcement across distributed pods. The virtualization security market size for network layers will widen further when OT factories virtualize sensors and PLCs, requiring deterministic but secure traffic flows.
Virtualization Security Market is Segmented by Component (Solutions and Services), Virtualization Layer (Hardware/Server Virtualization, Application Virtualization, and More), Deployment Mode (On-Premise, Private Cloud, and More), End-User Industry (IT and Telecom, BFSI, Healthcare and Life Sciences, and More), Organization Size (Large Enterprises and Small and Medium Enterprises), and Geography.
Geography Analysis
North America contributed 35.26% of revenue in 2024, sustained by early zero-trust adoption and strict sectoral mandates such as HIPAA and CCPA. Vendors concentrate R&D and channel ecosystems in the United States, shortening feedback cycles and quickening feature delivery.
Asia-Pacific is the high-velocity engine, set to grow 18.1% annually through 2030. India's DPDPA and Malaysia's stricter data officer obligations nudge even midsize firms to adopt audit-ready virtualization stacks. Manufacturing clusters across China, Vietnam, and Thailand virtualize shop-floor workloads, driving edge-security shipments.
Europe keeps a steady pace under GDPR. The Schrems II ruling amplifies interest in confidential-computing attestation to satisfy data transfer conditions. Meanwhile, GCC nations channel oil-windfall budgets into smart-city and e-government projects that rely on secure virtualized clouds, creating a nascent but strategic opportunity for specialists.
- VMware Inc. (Broadcom Inc.)
- Trend Micro Inc.
- Sophos Ltd.
- Bitdefender LLC
- Palo Alto Networks Inc.
- Fortinet Inc.
- Check Point Software Technologies Ltd.
- Cisco Systems Inc.
- Juniper Networks Inc.
- Kaspersky Lab
- McAfee LLC
- IBM Corporation
- Microsoft Corporation
- Citrix Systems Inc.
- Red Hat Inc.
- Nutanix Inc.
- Parallels International GmbH
- Sangfor Technologies Inc.
- Guardicore (Akamai Technologies)
- Illumio Inc.
- Acronis International GmbH
- Symantec Enterprise Division (Broadcom)
- Hillstone Networks
- Radware Ltd.
- Tenable Holdings Inc.
Additional Benefits:
- The market estimate (ME) sheet in Excel format
- 3 months of analyst support
TABLE OF CONTENTS
1 INTRODUCTION
- 1.1 Study Assumptions and Market Definition
- 1.2 Scope of the Study
2 RESEARCH METHODOLOGY
3 EXECUTIVE SUMMARY
4 MARKET LANDSCAPE
- 4.1 Market Overview
- 4.2 Market Drivers
- 4.2.1 Hybrid and multi-cloud adoption surge
- 4.2.2 Strict data-protection regulations (GDPR, CCPA, DPDPA)
- 4.2.3 Explosive VM and container workload growth in edge data centers
- 4.2.4 Hypervisor licence inflation pushing open-source hypervisors
- 4.2.5 AI-driven attack-surface discovery boosting micro-segmentation demand
- 4.2.6 Confidential-computing attestation becoming a procurement criterion
- 4.3 Market Restraints
- 4.3.1 High up-front cost of specialised security appliances
- 4.3.2 Shortage of skilled virtual-security engineers
- 4.3.3 VM sprawl complicating zero-trust enforcement
- 4.3.4 Quantum-ready encryption premiums delaying purchase cycles
- 4.4 Industry Value Chain Analysis
- 4.5 Regulatory Landscape
- 4.6 Technological Outlook
- 4.7 Industry Attractiveness - Porter's Five Forces Analysis
- 4.7.1 Threat of New Entrants
- 4.7.2 Bargaining Power of Buyers
- 4.7.3 Bargaining Power of Suppliers
- 4.7.4 Threat of Substitutes
- 4.7.5 Intensity of Competitive Rivalry
- 4.8 Impact of Macroeconomic Factors on the Market
5 MARKET SIZE AND GROWTH FORECASTS (VALUES)
- 5.1 By Component
- 5.1.1 Solutions
- 5.1.2 Services
- 5.2 By Virtualization Layer
- 5.2.1 Hardware/Server Virtualization
- 5.2.2 Application Virtualization
- 5.2.3 Network and SD-WAN Virtualization
- 5.2.4 Storage Virtualization
- 5.3 By Deployment Mode
- 5.3.1 On-Premise
- 5.3.2 Private Cloud
- 5.3.3 Public Cloud
- 5.3.4 Hybrid Cloud
- 5.4 By End-user Industry
- 5.4.1 IT and Telecom
- 5.4.2 BFSI
- 5.4.3 Healthcare and Life Sciences
- 5.4.4 Government and Defense
- 5.4.5 Retail and E-Commerce
- 5.4.6 Manufacturing
- 5.4.7 Other End-user Industries
- 5.5 By Organization Size
- 5.5.1 Large Enterprises
- 5.5.2 Small and Medium Enterprises (SMEs)
- 5.6 By Geography
- 5.6.1 North America
- 5.6.1.1 United States
- 5.6.1.2 Canada
- 5.6.1.3 Mexico
- 5.6.2 South America
- 5.6.2.1 Brazil
- 5.6.2.2 Argentina
- 5.6.2.3 Chile
- 5.6.2.4 Rest of South America
- 5.6.3 Europe
- 5.6.3.1 Germany
- 5.6.3.2 United Kingdom
- 5.6.3.3 France
- 5.6.3.4 Italy
- 5.6.3.5 Spain
- 5.6.3.6 Russia
- 5.6.3.7 Rest of Europe
- 5.6.4 Asia-Pacific
- 5.6.4.1 China
- 5.6.4.2 India
- 5.6.4.3 Japan
- 5.6.4.4 South Korea
- 5.6.4.5 Malaysia
- 5.6.4.6 Singapore
- 5.6.4.7 Australia
- 5.6.4.8 Rest of Asia-Pacific
- 5.6.5 Middle East and Africa
- 5.6.5.1 Middle East
- 5.6.5.1.1 United Arab Emirates
- 5.6.5.1.2 Saudi Arabia
- 5.6.5.1.3 Turkey
- 5.6.5.1.4 Rest of Middle East
- 5.6.5.2 Africa
- 5.6.5.2.1 South Africa
- 5.6.5.2.2 Nigeria
- 5.6.5.2.3 Rest of Africa
- 5.6.1 North America
6 COMPETITIVE LANDSCAPE
- 6.1 Market Concentration
- 6.2 Strategic Moves
- 6.3 Market Share Analysis
- 6.4 Company Profiles (includes Global level Overview, Market level overview, Core Segments, Financials as available, Strategic Information, Market Rank/Share for key companies, Products and Services, and Recent Developments)
- 6.4.1 VMware Inc. (Broadcom Inc.)
- 6.4.2 Trend Micro Inc.
- 6.4.3 Sophos Ltd.
- 6.4.4 Bitdefender LLC
- 6.4.5 Palo Alto Networks Inc.
- 6.4.6 Fortinet Inc.
- 6.4.7 Check Point Software Technologies Ltd.
- 6.4.8 Cisco Systems Inc.
- 6.4.9 Juniper Networks Inc.
- 6.4.10 Kaspersky Lab
- 6.4.11 McAfee LLC
- 6.4.12 IBM Corporation
- 6.4.13 Microsoft Corporation
- 6.4.14 Citrix Systems Inc.
- 6.4.15 Red Hat Inc.
- 6.4.16 Nutanix Inc.
- 6.4.17 Parallels International GmbH
- 6.4.18 Sangfor Technologies Inc.
- 6.4.19 Guardicore (Akamai Technologies)
- 6.4.20 Illumio Inc.
- 6.4.21 Acronis International GmbH
- 6.4.22 Symantec Enterprise Division (Broadcom)
- 6.4.23 Hillstone Networks
- 6.4.24 Radware Ltd.
- 6.4.25 Tenable Holdings Inc.
7 MARKET OPPORTUNITIES AND FUTURE TRENDS
- 7.1 White-Space and Unmet-Need Assessment
 虛擬化安全市場規模、佔有率和成長分析:按組件、安全類型、部署模式、企業規模、最終用戶產業、銷售管道和地區分類-2026-2033年產業預測
 虛擬化安全市場:按組件、安全類型、部署模式和最終用戶產業分類-2026-2032年全球市場預測
 虛擬化安全市場規模、佔有率、成長及全球產業分析:按類型、應用和地區分類的洞察,2026-2034 年預測
 2026年全球虛擬化安全市場報告
 虛擬化安全市場-全球產業規模、佔有率、趨勢、機會和預測(按組件、按部署、按垂直行業、按地區和競爭細分,2020-2030 年預測)
 虛擬安全市場規模、佔有率、趨勢分析報告:按組件、按部署、按企業規模、按最終用途、細分市場預測,2024-2030 年