


 |
市場調查報告書
商品編碼
1850243
過氧化氫:市場佔有率分析、產業趨勢、統計數據和成長預測(2025-2030 年)Hydrogen Peroxide - Market Share Analysis, Industry Trends & Statistics, Growth Forecasts (2025 - 2030) |
||||||
※ 本網頁內容可能與最新版本有所差異。詳細情況請與我們聯繫。
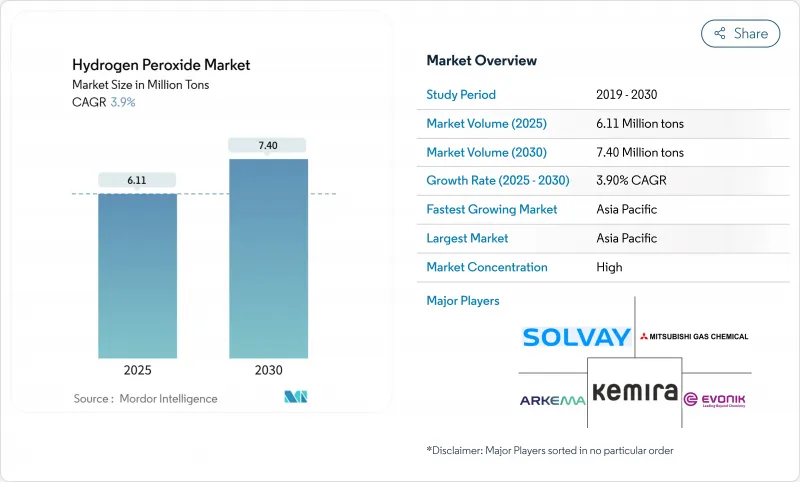
預計到 2025 年,過氧化氫市場規模將達到 611 萬噸,到 2030 年將達到 740 萬噸,年複合成長率為 3.9%。
紙漿和造紙漂白業務持續推動市場成長,而半導體製造、先進污水處理和綠色航太推進劑等領域的新需求也推高了平均售價。亞太地區的產能擴張、歐洲低碳產品的推出以及全球範圍內日益嚴格的衛生標準,都鞏固了過氧化氫市場穩定的成長勢頭,儘管原料價格波動和危險品分類的加強擠壓了利潤空間。領先的供應商正在擴大超高純度生產線,投資現場生產技術,並與電子產品客戶簽訂承購協議,以確保過氧化氫市場的長期供應。
全球過氧化氫市場趨勢與洞察
半導體濕式製程清洗對高純度清潔劑的需求不斷成長
超高純度度過氧化氫已成為5奈米以下半導體製造的必備原料。雜質閾值已收緊至兆分之一級別,索爾維的INTEROX PicoPlus產品符合此規格,其陽離子污染物含量低於0.01 ppb。台灣、韓國、美國和德國的新工廠已簽署多年固定供應協議,為過氧化氫市場提供了支撐。設備製造商也正在採用富含過氧化物的先進清洗方法來減少金屬殘留,進一步推高了單片晶圓的過氧化氫消費量。贏創和四川富華通達宣布的產能擴張計畫也印證了中期市場的樂觀前景。
日益嚴格的食品接觸包裝法規推動歐洲食品級過氧化氫的發展
歐盟食品安全指令現要求對無菌紙盒和寶特瓶進行更嚴格的滅菌處理。由於過氧化氫能迅速分解成水和氧氣,因此仍是首選的滅菌劑。歐洲食品安全局已於2024年重申其安全性。美國食品藥物管理局(FDA)核准在禽肉加工中使用抗菌劑,促使全球加工商統一通訊協定。短期內,過氧化氫市場將受益於這些法規。
歐盟CLP和REACH健康危害標籤會增加合規成本。
為了滿足歐洲統一的危險標籤要求,過氧化物生產商必須維護詳盡的安全資料表,並投資建造封閉式裝卸系統。歐洲化學品管理局將過氧化氫分為若干物理和健康危害類別。合規要求包括定期更新毒理學數據、員工培訓和包裝升級,這增加了歐盟出口商的成本。小型供應商面臨著不成比例的成本負擔,限制了新進入者,並略微減緩了整體成長。
細分市場分析
到2024年,漂白應用將佔過氧化氫市場的61%,這主要得益於紙漿和造紙廠對無氯增白技術的重視。用過氧化氫取代二氧化氯可以改善廢水排放,即使西方印刷用紙的產量下降,也能維持基準需求。由於亮度目標已納入產品規格,因此需求彈性不大。
消毒業務的複合年成長率 (CAGR) 最快,達到 4.37%,預計隨著醫院、食品加工廠和公共交通樞紐提高衛生標準,這一成長勢頭還將繼續。 Tomi Environmental Solutions 公司報告稱,2025 年第一季過氧化氫離子化設備的銷量激增 42%。連續霧化系統的使用場景不斷擴大,平均價格也隨之上漲,使得過氧化氫市場不再侷限於傳統的銷售模式。
工業級產品仍將是紡織、採礦和基礎化學工業的主力軍,預計到 2024 年將佔據 41% 的市場佔有率。成本競爭力和供應鏈密度有利於工業級產品在大多數大宗應用中的發展。
高純度材料市場成長最快,年複合成長率達 5.23%,主要得益於晶片製造商對亞 ppb 級金屬含量的要求。太陽日本酸素公司推出了過氧化物 BRUTE,旨在滿足這一市場需求。憑藉一座年產能達數千噸的 300 毫米晶圓廠,隨著每座新廠的投產,高純度度過氧化氫的市場規模都將進一步擴大。
區域分析
2024年,亞太地區將佔據全球過氧化氫市場53%的佔有率,年複合成長率達4.27%。中國和印度產能的擴張正為國內造紙和電子產業提供原料。 Engro Polymer and Chemicals已在巴基斯坦投資120億披索比索新建一家工廠,預計將於2026年運作。區域供應商享有運費優勢,這有助於確保淨利率。
北美在過氧化氫市場佔據了很大佔有率。污水處理法規和綠色推進技術的研究正在推動高濃度(90%以上)過氧化氫的新應用領域。 Benchmark Space Systems公司已成功研發出一款使用高純度度過氧化氫的22N雙組元推進器,其比衝達到了290秒。此類航太的努力將支持高階市場需求,並促進國內消費。
歐洲市場規模已趨於成熟,但在永續性創新方面卻處於領先地位。贏創的碳中和過氧化氫產品已通過「邁向GO2之路」計畫認證,正在幫助客戶減少範圍3排放。儘管更嚴格的包裝法規推動了食品級產品訂單的成長,但REACH法規的合規成本卻阻礙了小型進口商的參與。預計到2030年,歐洲過氧化氫市場將保持適度成長。
其他福利:
- Excel格式的市場預測(ME)表
- 3個月的分析師支持
目錄
第1章 引言
- 研究假設和市場定義
- 調查範圍
第2章調查方法
第3章執行摘要
第4章 市場情勢
- 市場概覽
- 市場促進因素
- 半導體濕式製程清洗對高純度清潔劑的需求不斷成長
- 歐洲日益嚴格的食品接觸包裝法規推動了對食品級過氧化氫的需求。
- 擴大亞太地區綜合造紙廠的化學紙漿產能
- 提高工業污水高級氧化處理中H2O2的現場生產效率
- 北美航太向綠色推進劑轉型,使用HTP(>90% w/w)
- 市場限制
- 歐盟CLP和REACH健康危害標籤法規會增加合規成本。
- 原物料價格波動
- 環境法規和處置挑戰
- 價值鏈分析
- 監理展望
- 波特五力模型
- 供應商的議價能力
- 買方的議價能力
- 新進入者的威脅
- 替代品的威脅
- 競爭程度
- 定價分析
- 貿易分析
- 供應情景
第5章 市場規模與成長預測
- 按產品功能
- 消毒劑
- 漂
- 氧化劑
- 其他產品特性(清潔劑等)
- 按年級
- 標準等級(低於35% w/w)
- 工業級(35-50%)
- 高純度等級(50%或以上)
- 按濃度/形式
- 水溶液(70%或以下)
- 無水(90%以上)
- 粉末/顆粒狀添加物(例如過硼酸鹽、過碳酸鹽)
- 按最終用戶行業分類
- 紙漿和造紙
- 化學合成
- 污水處理
- 礦業
- 食品/飲料
- 化妝品和醫療保健
- 紡織品
- 其他終端用戶產業(電子及半導體、運輸、無菌包裝、火箭)
- 按地區
- 亞太地區
- 中國
- 印度
- 日本
- 韓國
- 馬來西亞
- 泰國
- 印尼
- 越南
- 亞太其他地區
- 北美洲
- 美國
- 加拿大
- 墨西哥
- 南美洲
- 巴西
- 阿根廷
- 哥倫比亞
- 其他南美洲
- 歐洲
- 德國
- 英國
- 法國
- 義大利
- 西班牙
- 北歐的
- 土耳其
- 俄羅斯
- 其他歐洲地區
- 中東和非洲
- 沙烏地阿拉伯
- 卡達
- 阿拉伯聯合大公國
- 南非
- 埃及
- 奈及利亞
- 其他中東和非洲地區
- 亞太地區
第6章 競爭情勢
- 市場集中度
- 策略趨勢
- 市佔率分析
- 公司簡介
- Arkema
- BASF
- Chang Chun Group
- Dow
- EnGro Corporation Limited
- Evonik Industries AG
- FMC Corporation
- Guangdong Zhongcheng Chemicals Inc.
- Gujarat Alkalies and Chemicals Limited
- Hodogaya Chemical Co., Ltd.
- Indian Peroxide Ltd.
- Kemira Oyj
- Kingboard Holdings Limited
- Luxi Chemical Group
- MITSUBISHI GAS CHEMICAL COMPANY, INC.
- National Peroxide Limited.
- NIPPON PAPER INDUSTRIES CO., LTD.
- Nouryon
- OCI ALABAMA
- PQ Corporation
- Qingdao LaSheng Co. Ltd.
- Sichuan Hebang Biotechnology Co. Ltd.
- Solvay
第7章 市場機會與未來展望
The hydrogen peroxide market stands at 6.11 million tons in 2025 and is projected to reach 7.40 million tons by 2030, registering a 3.9% CAGR.
Momentum continues to come from pulp and paper bleaching, but semiconductor fabrication, advanced wastewater treatment, and green aerospace propellants are adding new demand layers that lift average selling prices. Capacity additions in Asia-Pacific, low-carbon product launches in Europe, and stricter global hygiene protocols are reinforcing a stable growth runway even as feedstock price swings and tighter hazard classifications temper profit margins. Leading suppliers are enlarging ultra-pure production lines, investing in on-site generation technologies, and signing offtake agreements with electronics customers to secure long-term volumes in the hydrogen peroxide market.
Global Hydrogen Peroxide Market Trends and Insights
Growing Demand for High-Purity Grades in Semiconductor Wet-Process Cleaning
Ultra-high-purity hydrogen peroxide is now indispensable in sub-5 nm semiconductor production. Impurity thresholds have tightened to parts-per-trillion levels, and Solvay's INTEROX PicoPlus meets those specifications with cationic contaminants below 0.01 ppb. New fabs in Taiwan, South Korea, the United States, and Germany are signing multi-year supply agreements that lock in offtake volumes, underpinning the hydrogen peroxide market. Equipment makers are also adopting peroxide-rich advanced cleans that reduce metallic residues, further expanding per-wafer consumption. Capacity additions announced by Evonik and Fuhua Tongda in Sichuan underscore the bullish medium-term outlook.
Stricter Food-Contact Packaging Regulations Driving Food-Grade H2O2 in Europe
EU food-safety directives now require more rigorous sterilization of aseptic cartons and PET bottles. Hydrogen peroxide remains the preferred agent thanks to rapid decomposition into water and oxygen. The European Food Safety Authority reaffirmed its safety in 2024. FDA approvals for antimicrobial use in poultry processing are influencing global processors to harmonize protocols. As a result of these policies, packaging lines have begun integrating vaporized hydrogen peroxide units, driving increased demand for food-grade solutions, particularly in dairies and juice plants.The hydrogen peroxide market benefits from this regulatory tail-wind in the near term.
Health-Hazard Labelling under EU CLP and REACH Creating Compliance Costs
Peroxide producers must maintain extensive safety data sheets and invest in closed loading systems to meet Europe's harmonized hazard statements. The European Chemicals Agency lists hydrogen peroxide under several physical and health hazard categories. Compliance requires periodic toxicology updates, employee training, and upgraded packaging, adding overhead for exporters into the bloc. Smaller suppliers face disproportionate cost burdens, limiting new entrants and marginally slowing overall growth.
Other drivers and restraints analyzed in the detailed report include:
- Expansion of Chemical Pulp Capacity in APAC Integrated Mills
- Increasing On-Site H2O2 Generation for Advanced Oxidation in Industrial Wastewater
- Volatility of Feedstock Prices
For complete list of drivers and restraints, kindly check the Table Of Contents.
Segment Analysis
Bleaching applications accounted for 61% of the hydrogen peroxide market in 2024, anchored by pulp and paper mills that value chlorine-free brightness gains. Replacement of elemental chlorine dioxide with peroxide improves effluent profiles, sustaining baseline demand even as Western print paper declines. Demand elasticity is modest because brightness targets are codified in product specifications.
Disinfection posted the fastest 4.37% CAGR and is forecast to keep climbing as hospitals, food plants, and mass-transit hubs maintain heightened sanitation standards. TOMI Environmental Solutions reported a 42% sales jump in Q1 2025 for ionized peroxide devices. Continuous-mist delivery systems broaden use cases and lift average prices, expanding the hydrogen peroxide market beyond legacy volumes.
The industrial grade segment delivered 41% share in 2024 and remains the workhorse for textiles, mining, and basic chemicals. Cost competitiveness and supply chain density favor industrial grade in most bulk applications.
High-purity material is scaling fastest at 5.23% CAGR as chipmakers specify sub-ppb metal levels. Taiyo Nippon Sanso launched BRUTE Peroxide to serve this niche. A single 300 mm fab can offtake several kilotons annually, so each new facility adds tangible volume to the hydrogen peroxide market size for high-purity products.
The Hydrogen Peroxide Market Report Segments the Industry by Product Function (Disinfectant, Bleaching, Oxidant, and More), Grade (Standard Grade, Industrial Grade, and More), Concentration/Form (Aqueous Solution, Anhydrous, and More), End-User Industry (Pulp and Paper, Chemical Synthesis, Mining, and More), and Geography (Asia-Pacific, North America, Europe, South America, and Middle East and Africa).
Geography Analysis
Asia-Pacific controlled 53% of the hydrogen peroxide market 2024 and is rising at a 4.27% CAGR. Capacity additions in China and India feed the domestic paper and electronics sectors. Engro Polymer and Chemicals invested PKR 12 billion in a new Pakistani plant scheduled for 2026 start-up. Regional suppliers enjoy freight advantages that safeguard margins.
North America holds a significant slice of the hydrogen peroxide market. Wastewater regulations and green propulsion research spur new endpoints for concentrated (more than 90%) grades. Benchmark Space Systems demonstrated a 22 N bipropellant thruster using high-test peroxide that reached a 290-second specific impulse. These aerospace trials anchor premium demand and boost domestic consumption.
Europe exhibits mature volumes but leads sustainability innovation. Evonik's carbon-neutral peroxide, certified under the Way to GO2 program, helps customers cut Scope 3 emissions. Stricter packaging rules raise food-grade orders, while REACH compliance costs restrain smaller importers. The hydrogen peroxide market size for Europe is projected to move modestly yet steadily through 2030.
- Arkema
- BASF
- Chang Chun Group
- Dow
- EnGro Corporation Limited
- Evonik Industries AG
- FMC Corporation
- Guangdong Zhongcheng Chemicals Inc.
- Gujarat Alkalies and Chemicals Limited
- Hodogaya Chemical Co., Ltd.
- Indian Peroxide Ltd.
- Kemira Oyj
- Kingboard Holdings Limited
- Luxi Chemical Group
- MITSUBISHI GAS CHEMICAL COMPANY, INC.
- National Peroxide Limited.
- NIPPON PAPER INDUSTRIES CO., LTD.
- Nouryon
- OCI ALABAMA
- PQ Corporation
- Qingdao LaSheng Co. Ltd.
- Sichuan Hebang Biotechnology Co. Ltd.
- Solvay
Additional Benefits:
- The market estimate (ME) sheet in Excel format
- 3 months of analyst support
TABLE OF CONTENTS
1 Introduction
- 1.1 Study Assumptions and Market Definition
- 1.2 Scope of the Study
2 Research Methodology
3 Executive Summary
4 Market Landscape
- 4.1 Market Overview
- 4.2 Market Drivers
- 4.2.1 Growing Demand for High-Purity Grades in Semiconductor Wet-Process Cleaning
- 4.2.2 Stricter Food-Contact Packaging Regulations Driving Food-Grade H2O2 in the Europe
- 4.2.3 Expansion of Chemical Pulp Capacity in APAC Integrated Mills
- 4.2.4 Increasing On-Site H2O2 Generation for Advanced Oxidation in Industrial Wastewater
- 4.2.5 Aerospace Shift toward Green Propellants Using HTP (>90 % w/w) in North America
- 4.3 Market Restraints
- 4.3.1 Health-Hazard Labelling under EU CLP and REACH Creating Compliance Costs
- 4.3.2 Volatility of Feedstock Prices
- 4.3.3 Environmental Regulations and Disposal Challenges
- 4.4 Value Chain Analysis
- 4.5 Regulatory Outlook
- 4.6 Porter's Five Forces
- 4.6.1 Bargaining Power of Suppliers
- 4.6.2 Bargaining Power of Buyers
- 4.6.3 Threat of New Entrants
- 4.6.4 Threat of Substitutes
- 4.6.5 Degree of Competition
- 4.7 Pricing Analysis
- 4.8 Trade Analysis
- 4.9 Supply Scenerio
5 Market Size and Growth Forecasts (Volume)
- 5.1 By Product Function
- 5.1.1 Disinfectant
- 5.1.2 Bleaching
- 5.1.3 Oxidant
- 5.1.4 Other Product Function (Cleaning Agent, etc.)
- 5.2 By Grade
- 5.2.1 Standard Grade (less than 35 % w/w)
- 5.2.2 Industrial Grade (35-50 %)
- 5.2.3 High-Purity Grade (more than 50 %)
- 5.3 By Concentration / Form
- 5.3.1 Aqueous Solution (less than or equal to 70 %)
- 5.3.2 Anhydrous (more than 90 %)
- 5.3.3 Powder / Granular Adducts (e.g., Perborate, Percarbonate)
- 5.4 By End-user Industry
- 5.4.1 Pulp and Paper
- 5.4.2 Chemical Synthesis
- 5.4.3 Wastewater Treatment
- 5.4.4 Mining
- 5.4.5 Food and Beverage
- 5.4.6 Cosmetics and Healthcare
- 5.4.7 Textiles
- 5.4.8 Other End-user Industries (Electronics and Semiconductors, Transportation, Aseptic Packaging, Rocketry)
- 5.5 By Geography
- 5.5.1 Asia-Pacific
- 5.5.1.1 China
- 5.5.1.2 India
- 5.5.1.3 Japan
- 5.5.1.4 South Korea
- 5.5.1.5 Malaysia
- 5.5.1.6 Thailand
- 5.5.1.7 Indonesia
- 5.5.1.8 Vietnam
- 5.5.1.9 Rest of Asia-Pacific
- 5.5.2 North America
- 5.5.2.1 United States
- 5.5.2.2 Canada
- 5.5.2.3 Mexico
- 5.5.3 South America
- 5.5.3.1 Brazil
- 5.5.3.2 Argentina
- 5.5.3.3 Colombia
- 5.5.3.4 Rest of South America
- 5.5.4 Europe
- 5.5.4.1 Germany
- 5.5.4.2 United Kingdom
- 5.5.4.3 France
- 5.5.4.4 Italy
- 5.5.4.5 Spain
- 5.5.4.6 Nordic
- 5.5.4.7 Turkey
- 5.5.4.8 Russia
- 5.5.4.9 Rest of Europe
- 5.5.5 Middle East and Africa
- 5.5.5.1 Saudi Arabia
- 5.5.5.2 Qatar
- 5.5.5.3 United Arab Emirates
- 5.5.5.4 South Africa
- 5.5.5.5 Egypt
- 5.5.5.6 Nigeria
- 5.5.5.7 Rest of Middle East and Africa
- 5.5.1 Asia-Pacific
6 Competitive Landscape
- 6.1 Market Concentration
- 6.2 Strategic Moves
- 6.3 Market Share Analysis
- 6.4 Company Profiles {(includes Global level Overview, Market level overview, Core Segments, Financials as available, Strategic Information, Market Rank/Share, Products and Services, Recent Developments)}
- 6.4.1 Arkema
- 6.4.2 BASF
- 6.4.3 Chang Chun Group
- 6.4.4 Dow
- 6.4.5 EnGro Corporation Limited
- 6.4.6 Evonik Industries AG
- 6.4.7 FMC Corporation
- 6.4.8 Guangdong Zhongcheng Chemicals Inc.
- 6.4.9 Gujarat Alkalies and Chemicals Limited
- 6.4.10 Hodogaya Chemical Co., Ltd.
- 6.4.11 Indian Peroxide Ltd.
- 6.4.12 Kemira Oyj
- 6.4.13 Kingboard Holdings Limited
- 6.4.14 Luxi Chemical Group
- 6.4.15 MITSUBISHI GAS CHEMICAL COMPANY, INC.
- 6.4.16 National Peroxide Limited.
- 6.4.17 NIPPON PAPER INDUSTRIES CO., LTD.
- 6.4.18 Nouryon
- 6.4.19 OCI ALABAMA
- 6.4.20 PQ Corporation
- 6.4.21 Qingdao LaSheng Co. Ltd.
- 6.4.22 Sichuan Hebang Biotechnology Co. Ltd.
- 6.4.23 Solvay
7 Market Opportunities and Future Outlook
- 7.1 White-Space and Unmet-Need Assessment
- 7.2 Newer Opportunities for Hydrogen Peroxide in Wastewater Treatment
 過氧化氫市場:按等級、濃度、形態、最終用途和分銷管道分類的全球市場預測,2026-2032年
 過氧化氫市場報告:按應用、最終用途和地區分類(2026-2034 年)
 全球過氧化氫市場規模、佔有率、趨勢和成長分析報告(2026-2034年)
 過氧化氫市場規模、佔有率和趨勢分析報告:按等級、應用、地區和細分市場預測(2026-2033 年)
 2026年全球過氧化氫市場報告全球蒸氣和過氧化氫滅菌用生物指示劑市場:市場規模、佔有率、成長率、產業分析、依類型、應用和地區劃分的分析以及未來預測(2026-2034)
 過氧化氫市場 - 全球產業規模、佔有率、趨勢、機會及預測(按等級、類型、應用、地區和競爭格局分類,2021-2031年)日本過氧化氫市場報告(按應用、最終用途和地區分類,2026-2034年)
 過氧化氫市場規模、佔有率和成長分析(按等級、功能、應用和地區分類)-2026-2033年產業預測
 過氧化氫:全球市佔率及排名、總收入及需求預測(2025-2031年)