


 |
市場調查報告書
商品編碼
1850238
軟體定義安全:市場佔有率分析、產業趨勢、統計數據和成長預測(2025-2030 年)Software Defined Security - Market Share Analysis, Industry Trends & Statistics, Growth Forecasts (2025 - 2030) |
||||||
※ 本網頁內容可能與最新版本有所差異。詳細情況請與我們聯繫。
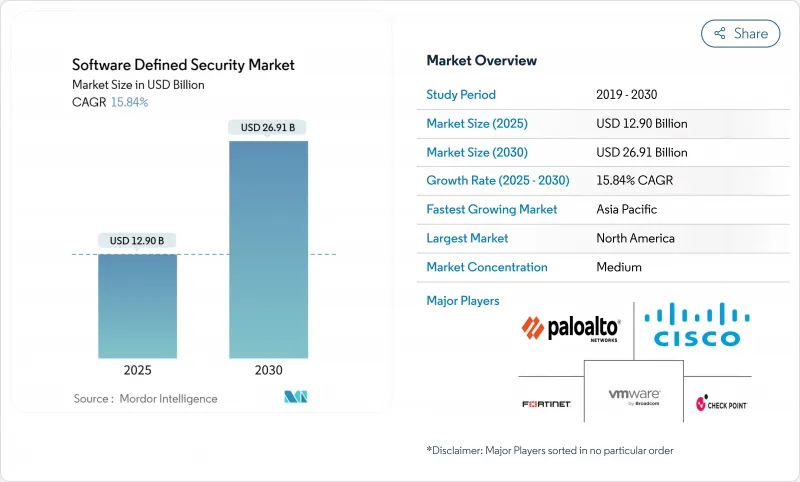
軟體定義安全市場預計到 2025 年價值 129 億美元,預計到 2030 年將成長一倍以上,達到 269.1 億美元,複合年成長率為 15.84%。
大多數企業正從以邊界為中心的控制轉向可程式架構,以因應跨資料中心、多個公共雲端和邊緣位置的工作負載遷移。自動化策略執行縮短了事件回應週期,而零信任原則則將持續檢驗融入日常網路營運中。歐盟《網路彈性法案》和NIS2指令等監管期限的到來,正將可自由支配的支出轉變為強制投資。同時,容器化應用的快速成長迫使安全團隊採用只有軟體定義方法才能提供的細粒度微隔離和執行時間保護。這些因素的共同作用,有望使軟體定義安全市場在本十年末保持兩位數的成長勢頭。
全球軟體定義安全市場趨勢與洞察
對快速事件回應和策略自動化的需求
平均檢測時間應以分鐘而非天為單位。根據聯盟發布的《2025 年網路威脅指數》,58% 的勒索軟體入侵始於受感染的 VPN 設備,這暴露了手動回應的限制。正因如此,企業正在採用可程式安全控制措施,當威脅情報超過設定的風險閾值時,自動隔離端點。到 2025 年,加拿大資料外洩的平均成本達到 466 萬美元,受影響客戶的解約率上升至 38%。自動化的軟體定義策略使安全團隊能夠在不增加員工數量的情況下擴展規模,並使防禦措施與對手保持同步。
多重雲端和混合雲端架構的採用率不斷提高
Nutanix 報告稱,目前全球 90% 的企業經營著由私有雲端雲和多個公共雲端組成的「雲智慧」組合 [nutanix.com]。這種多樣性導致可見性分散,71% 的團隊至少在一個環境中遇到策略盲點。軟體定義安全平台透過將策略從底層基礎架構中抽像出來,消除了這種分散性。統一的儀表板應用相同的控制措施,無論工作負載是在本地、AWS、Azure 還是 OCI 中運行,都能確保持續合規,同時讓開發人員能夠自由地在合適的位置部署應用程式。
DevSecOps人才短缺
在 O'Reilly 2024 年的調查中,38.9% 的組織認為雲端安全技能是其最大的缺口。美國DevSecOps 工程師的平均年薪已高達 14 萬美元,這給預算和計劃進度帶來了壓力。許多公司正在透過託管服務提供者來填補這一缺口,擴大服務領域,但在內部採用高級功能方面卻落後。
細分分析
公共雲端將持續引領整體應用,到2024年將佔總營收的39%。其中,純SaaS細分市場成長最快,複合年成長率達18.20%。 IT團隊,尤其是中小企業的IT團隊,非常欣賞雲端原生供應商提供的即時擴展和滾動更新,這些功能無需修補本地設備。隨著零信任框架的成熟,大型企業也將工作負載轉移到SaaS節點,以減少資本支出並加速功能採用。
雖然在需要主權和延遲的情況下,本地部署仍然必不可少,但混合設計擴大透過 SaaS 安全 Web 閘道路由出站流量。總而言之,這些趨勢將策略控制轉移到網路邊緣,有利於建構多租戶、彈性背板的供應商。這種轉變凸顯了軟體定義安全市場從設備銷售到訂閱收益的更廣泛重新定位。
網路安全將佔2024年收入的40%,這反映了傳統防火牆的更新週期和軟體定義廣域網路的部署。雲端/容器安全將實現最快的成長,到2030年將以24%的複合年成長率擴張。隨著開發團隊將單體應用容器化化為數百個微服務,運行時控制必須隨著pod的重生而立即適應,因此持續鏡像掃描、存取控制鉤子和服務網格加密成為採購清單上的重點。
早期採用者擴大將容器安全與態勢管理模組捆綁在一起,這些模組可以清點 AWS、Azure 和 Google Cloud 上的錯誤配置。這種融合進一步模糊了工作負載和配置安全之間的界限,促使供應商將其雲端原生應用程式保護平台直接整合到更廣泛的軟體定義安全市場套件中。
區域分析
受聯邦政府積極措施的推動,北美地區佔2024年網路安全總收入的38%。美國國防部在2025會計年度向國防資訊系統局(DISA)網路營運部門撥款5.049億美元,用於建構零信任參考架構,該架構將擴展到承包商生態系統。總體而言,該地區的網路安全支出年增15%,這得益於白宮行政命令,該命令要求材料清單進行審核,並對整個聯邦供應鏈進行持續監控。
歐洲則位居第二,但隨著軟體定義安全市場與全面立法的接軌,其發展呈現出健康的加速態勢。 《網路彈性法案》將於2027年12月生效,要求製造商從產品設計之初就將安全性融入其中。諸如《數位營運彈性法案》(金融)和NIS2(關鍵服務)等補充措施,將類似的義務擴展到整個經濟體。因此,企業正在轉向可編程策略引擎,這些引擎可以即時向多個監管機構證明合規性。
亞太地區是成長的領跑者,預計到2030年複合年成長率將達到14.90%。中國、日本和韓國的製造業巨頭正在推行工業4.0計劃,這將使其營運技術網路面臨網路威脅。各國政府正在製定產業框架,推薦微分段和零信任,並推動新的計劃。印度的《數位個人資料保護法》也同樣收緊了對醫療保健和電子商務參與者的監管。總體而言,這些發展將推動全球軟體定義安全市場中區域佔有率的成長。
中東、非洲和南美洲是新的採用者,能源出口商正在啟用安全設計的煉油廠控制系統,巴西金融監管機構也發布了嚴格的開放銀行安全指南。雖然絕對商機仍然有限,但這些地區提供了高成長率,對尋求待開發區機會的雲端原生供應商具有吸引力。
其他福利:
- Excel格式的市場預測(ME)表
- 3個月的分析師支持
目錄
第1章 引言
- 研究假設和市場定義
- 調查範圍
第2章調查方法
第3章執行摘要
第4章 市場情勢
- 市場概況
- 市場促進因素
- 對更快的事件回應和策略自動化的需求
- 多重雲端和混合雲端架構的採用率不斷提高
- 容器/Kubernetes 安全支出激增
- 邁向零信任和 SASE 整合(報告不足)
- 人工智慧驅動的威脅狩獵減少了潛伏時間(漏報)
- 關鍵基礎設施遭受攻擊後的國家網路韌性義務(未通報)
- 市場限制
- DevSecOps人才短缺
- 舊有系統互通性問題
- 東西向微分割的隱藏(未被充分報道的)效能開銷
- 單一供應商政策控制者造成的集中風險(漏報)
- 價值/供應鏈分析
- 監管格局
- 技術展望
- 五力分析
- 新進入者的威脅
- 買方的議價能力
- 供應商的議價能力
- 替代品的威脅
- 競爭對手之間的競爭
第5章 市場規模與成長預測
- 按組件
- 軟體
- 服務
- 按部署模式
- 本地部署
- 公共雲端
- 私有雲端
- 混合雲端
- 按安全類型
- 網路安全
- 端點安全
- 應用程式安全
- 雲端/容器安全
- 其他
- 按組織規模
- 小型企業
- 主要企業
- 按最終用戶
- BFSI
- 通訊/IT
- 衛生保健
- 政府和國防
- 零售與電子商務
- 能源和公共產業
- 其他
- 按地區
- 北美洲
- 美國
- 加拿大
- 墨西哥
- 歐洲
- 英國
- 德國
- 法國
- 義大利
- 其他歐洲地區
- 亞太地區
- 中國
- 日本
- 印度
- 韓國
- 其他亞太地區
- 中東
- 以色列
- 沙烏地阿拉伯
- 阿拉伯聯合大公國
- 土耳其
- 其他中東地區
- 非洲
- 南非
- 埃及
- 其他非洲國家
- 南美洲
- 巴西
- 阿根廷
- 其他南美
- 北美洲
第6章 競爭情勢
- 市場集中度
- 策略趨勢
- 市佔率分析
- 公司簡介
- Palo Alto Networks
- Cisco Systems
- Fortinet
- Juniper Networks
- VMware(Broadcom)
- Check Point Software
- IBM
- Oracle
- Microsoft
- Trend Micro
- Huawei
- Sophos
- McAfee
- Splunk
- Illumio
- Akamai Technologies
- Netskope
- Zscaler
- Forcepoint
- Darktrace
- Proofpoint
第7章 市場機會與未來展望
The software-defined security market size is estimated at USD 12.9 billion in 2025 and is forecast to more than double to USD 26.91 billion by 2030, advancing at a 15.84% CAGR.
Most enterprises are moving away from perimeter-centric controls toward programmable architectures that follow workloads as they shift across data centers, multiple public clouds, and edge locations. Automated policy enforcement shortens incident-response cycles, while zero-trust principles embed continuous verification into everyday network operations. Regulatory deadlines such as the EU Cyber Resilience Act and the NIS2 Directive are converting discretionary spending into mandatory investments. At the same time, the rapid growth of containerized applications forces security teams to embrace granular micro-segmentation and runtime protection that only software-defined approaches can deliver. Together, these forces give the software-defined security market durable, double-digit momentum through the end of the decade.
Global Software Defined Security Market Trends and Insights
Requirement for quicker incident response and policy automation
Mean time to detection must now be measured in minutes, not days. Coalition's 2025 Cyber Threat Index found that 58% of ransomware intrusions began with compromised VPN devices, exposing the limits of manual responses. Enterprises therefore employ programmable security controls that auto-isolate endpoints once threat intelligence crosses defined risk thresholds. The financial stakes remain high: average breach costs in Canada reached USD 4.66 million and churn rates climbed to 38% among affected customers in 2025. Automated, software-defined playbooks let security teams scale without proportional head-count increases, aligning protection speed with adversary tempo.
Rising adoption of multi-cloud and hybrid cloud architectures
Nutanix reports that 90% of global organizations now run a "cloud-smart" mix of private and multiple public clouds [nutanix.com]. Such diversity fragments visibility; 71% of teams acknowledge policy blind spots in at least one environment. Software-defined security platforms resolve that fragmentation by abstracting policy from the underlying infrastructure. Unified dashboards apply identical controls regardless of whether workloads run on-premises, AWS, Azure, or OCI, ensuring continuous compliance while giving developers freedom to place applications where they perform best.
Shortage of DevSecOps talent
O'Reilly's 2024 survey shows 38.9% of organizations citing cloud security skills as their biggest gap. DevSecOps engineer salaries in the United States already average USD 140,000, pressuring budgets and project timelines. Many firms backfill the gap with managed service providers, which boosts the services segment but slows in-house adoption of advanced features.
Other drivers and restraints analyzed in the detailed report include:
- Surge in container/Kubernetes security spend
- National cyber-resilience mandates after critical-infrastructure attacks
- Legacy-system interoperability issues
For complete list of drivers and restraints, kindly check the Table Of Contents.
Segment Analysis
Public cloud continues to lead overall penetration, delivering 39% of 2024 revenue. Within that category, the SaaS-only slice is climbing fastest at an 18.20% CAGR. Smaller IT teams in particular prize the instant scaling and rolling updates that cloud-native vendors provide, since no on-premises appliances require patching. Larger enterprises also shift workloads into SaaS nodes to reduce capex and accelerate feature adoption as zero-trust frameworks mature.
On-premises deployments remain indispensable where sovereignty or latency mandates apply; however, hybrid designs increasingly route outbound traffic through SaaS secure web gateways. Combined, these trends move policy control toward the network edge and favour vendors that architect multi-tenant, elastic backplanes. The transition underscores the broader repositioning of the software defined security market from appliance sales to subscription revenue.
Network security still represents 40% of 2024 revenue, reflecting legacy firewall refresh cycles and software-defined wide-area network rollouts. The higher-growth story lies in cloud/container security, which will expand at a 24% CAGR through 2030. Development teams containerize monoliths into hundreds of microservices, so runtime controls must adapt in seconds as pods respawn. Continuous image scanning, admission-control hooks, and service-mesh encryption therefore top procurement lists.
Early adopters increasingly bundle container security with posture-management modules that inventory misconfigurations across AWS, Azure, and Google Cloud. This convergence further blurs lines between workload and configuration security, pushing vendors to integrate cloud-native application protection platforms directly into their broader software defined security market suites.
Software Defined Security Market Report is Segmented by Component (Software, Services), Deployment Model (On-Premises, Public Cloud and More), Security Type (Network Security, Endpoint Security and More), Organization Size (Small & Medium Enterprises and Large Enterprises), End User (BFSI, Telecommunications & IT and More) and Geography. The Market Forecasts are Provided in Terms of Value (USD).
Geography Analysis
North America captured 38% of 2024 revenue, underpinned by decisive federal action. The U.S. Department of Defense allocated USD 504.9 million to DISA cyber operations for fiscal 2025, with a mandate to build zero-trust reference architectures that ripple into contractor ecosystems. Corporate boards mirror that urgency: overall cybersecurity spending in the region grew 15% year over year, buoyed by the White House's executive orders that require software bills of materials and continuous monitoring across the federal supply chain.
Europe sits in second place but posts healthy acceleration as the software defined security market aligns with sweeping legislation. The Cyber Resilience Act coming into force in December 2027 obliges manufacturers to design products with security baked in from day one. Complementary measures such as the Digital Operational Resilience Act (for finance) and NIS2 (for essential services) extend similar obligations across the economy. Enterprises are therefore converging on programmable policy engines capable of proving compliance in real time to multiple supervisory bodies.
Asia-Pacific is the growth frontrunner, set to log a 14.90% CAGR through 2030. Manufacturing heavyweights in China, Japan, and South Korea pursue Industry 4.0 programs that expose operational-technology networks to internet threats. Governments respond with sector-specific frameworks that recommend micro-segmentation and zero-trust, propelling new projects. India's Digital Personal Data Protection Act similarly raises bars for healthcare and e-commerce operators. Collectively, these moves expand the regional share of the global software defined security market.
The Middle East, Africa, and South America are emerging adopters. Energy exporters commission secure-by-design refinery control systems, while Brazilian financial regulators publish stringent open-banking security guidelines. Although absolute spend remains lower, high growth rates make these geographies attractive for cloud-native vendors seeking greenfield opportunities.
- Palo Alto Networks
- Cisco Systems
- Fortinet
- Juniper Networks
- VMware (Broadcom)
- Check Point Software
- IBM
- Oracle
- Microsoft
- Trend Micro
- Huawei
- Sophos
- McAfee
- Splunk
- Illumio
- Akamai Technologies
- Netskope
- Zscaler
- Forcepoint
- Darktrace
- Proofpoint
Additional Benefits:
- The market estimate (ME) sheet in Excel format
- 3 months of analyst support
TABLE OF CONTENTS
1 INTRODUCTION
- 1.1 Study Assumptions and Market Definition
- 1.2 Scope of the Study
2 RESEARCH METHODOLOGY
3 EXECUTIVE SUMMARY
4 MARKET LANDSCAPE
- 4.1 Market Overview
- 4.2 Market Drivers
- 4.2.1 Requirement for quicker incident response and policy automation
- 4.2.2 Rising adoption of multi-cloud and hybrid cloud architectures
- 4.2.3 Surge in container/Kubernetes security spend
- 4.2.4 Shift toward zero-trust and SASE convergence (under-reported)
- 4.2.5 AI-driven threat-hunting reducing dwell time (under-reported)
- 4.2.6 National cyber-resilience mandates after critical-infrastructure attacks (under-reported)
- 4.3 Market Restraints
- 4.3.1 Shortage of DevSecOps talent
- 4.3.2 Legacy-system interoperability issues
- 4.3.3 Hidden performance overhead in east-west micro-segmentation (under-reported)
- 4.3.4 Concentration risk from single-vendor policy controllers (under-reported)
- 4.4 Value / Supply-Chain Analysis
- 4.5 Regulatory Landscape
- 4.6 Technological Outlook
- 4.7 Porters Five Forces
- 4.7.1 Threat of New Entrants
- 4.7.2 Bargaining Power of Buyers
- 4.7.3 Bargaining Power of Suppliers
- 4.7.4 Threat of Substitute Products
- 4.7.5 Intensity of Competitive Rivalry
5 MARKET SIZE & GROWTH FORECASTS (VALUE)
- 5.1 By Component
- 5.1.1 Software
- 5.1.2 Services
- 5.2 By Deployment Model
- 5.2.1 On-premises
- 5.2.2 Public Cloud
- 5.2.3 Private Cloud
- 5.2.4 Hybrid Cloud
- 5.3 By Security Type
- 5.3.1 Network Security
- 5.3.2 Endpoint Security
- 5.3.3 Application Security
- 5.3.4 Cloud / Container Security
- 5.3.5 Others
- 5.4 By Organization Size
- 5.4.1 Small and Medium Enterprises
- 5.4.2 Large Enterprises
- 5.5 By End User
- 5.5.1 BFSI
- 5.5.2 Telecommunications and IT
- 5.5.3 Healthcare
- 5.5.4 Government and Defense
- 5.5.5 Retail and eCommerce
- 5.5.6 Energy and Utilities
- 5.5.7 Others
- 5.6 By Geography
- 5.6.1 North America
- 5.6.1.1 United States
- 5.6.1.2 Canada
- 5.6.1.3 Mexico
- 5.6.2 Europe
- 5.6.2.1 United Kingdom
- 5.6.2.2 Germany
- 5.6.2.3 France
- 5.6.2.4 Italy
- 5.6.2.5 Rest of Europe
- 5.6.3 APAC
- 5.6.3.1 China
- 5.6.3.2 Japan
- 5.6.3.3 India
- 5.6.3.4 South Korea
- 5.6.3.5 Rest of APAC
- 5.6.4 Middle East
- 5.6.4.1 Israel
- 5.6.4.2 Saudi Arabia
- 5.6.4.3 United Arab Emirates
- 5.6.4.4 Turkey
- 5.6.4.5 Rest of Middle East
- 5.6.5 Africa
- 5.6.5.1 South Africa
- 5.6.5.2 Egypt
- 5.6.5.3 Rest of Africa
- 5.6.6 South America
- 5.6.6.1 Brazil
- 5.6.6.2 Argentina
- 5.6.6.3 Rest of South America
- 5.6.1 North America
6 COMPETITIVE LANDSCAPE
- 6.1 Market Concentration
- 6.2 Strategic Moves
- 6.3 Market Share Analysis
- 6.4 Company Profiles (includes Global level Overview, Market level overview, Core Segments, Financials as available, Strategic Information, Market Rank/Share for key companies, Products and Services, and Recent Developments)
- 6.4.1 Palo Alto Networks
- 6.4.2 Cisco Systems
- 6.4.3 Fortinet
- 6.4.4 Juniper Networks
- 6.4.5 VMware (Broadcom)
- 6.4.6 Check Point Software
- 6.4.7 IBM
- 6.4.8 Oracle
- 6.4.9 Microsoft
- 6.4.10 Trend Micro
- 6.4.11 Huawei
- 6.4.12 Sophos
- 6.4.13 McAfee
- 6.4.14 Splunk
- 6.4.15 Illumio
- 6.4.16 Akamai Technologies
- 6.4.17 Netskope
- 6.4.18 Zscaler
- 6.4.19 Forcepoint
- 6.4.20 Darktrace
- 6.4.21 Proofpoint
7 MARKET OPPORTUNITIES & FUTURE OUTLOOK
- 7.1 White-space and Unmet-Need Assessment


