


 |
市場調查報告書
商品編碼
1850221
智慧感測器:市場佔有率分析、行業趨勢、統計數據和成長預測(2025-2030 年)Smart Sensors - Market Share Analysis, Industry Trends & Statistics, Growth Forecasts (2025 - 2030) |
||||||
※ 本網頁內容可能與最新版本有所差異。詳細情況請與我們聯繫。
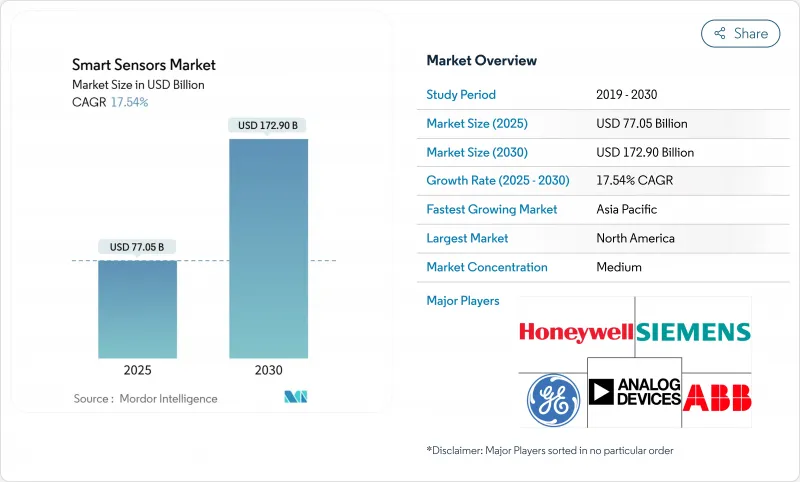
預計到 2025 年,智慧感測器市場規模將達到 770.5 億美元,到 2030 年將成長至 1,729 億美元。
這一成長趨勢的驅動力來自邊緣人工智慧的整合、日益嚴格的汽車和醫療保健法規,以及工業自動化項目,這些都促使企業從被動監控轉向預測智慧。汽車自動緊急煞車和醫療設備持續病患監測等強制性安全功能,正在推動新興市場對非選擇性感測器的需求。同時,嵌入最新一代感測器的邊緣人工智慧核心消除了延遲和頻寬瓶頸,從而能夠在電力受限的環境中實現即時分析。鎵和鍺的供應鏈壓力以及半導體自給自足的競爭,使得平均售價在銷量成長的同時保持穩定,為製造商提供了持續研發投資的空間。在預測期內,性能差異化將從原始靈敏度指標轉向車載智慧、網路安全合規性和整合靈活性。
全球智慧感測器市場趨勢與洞察
提升工業IoT的能源效率
具有法律約束力的永續性報告正促使製造商部署智慧感測器,從而實現可衡量的節能和二氧化碳減排。歐盟企業永續性報告指令要求提供精細的能源指標,促使工廠安裝邊緣人工智慧感測器,以持續最佳化暖通空調、照明和機器利用率。 SECO 的智慧CNC工具機改裝使生產廢棄物減少了 30%,備件成本降低了 10%。 Lech Stahlwerke 的 5G 賦能工廠也取得了類似的成果,這使得能源效率計劃成為董事會層面的優先事項。隨著早期採用者報告兩位數的成本節約,後進企業面臨效仿的競爭壓力,從而形成對智慧感測器需求的自我強化循環。
家用電器感測器的普及
智慧型手機和穿戴式裝置廠商目前在每個裝置中整合多達 12 個感測器,支援空氣品質測量、高級生物識別和自學習活動追蹤等功能。博世已確認,2025 年推出的行動電話中,超過一半將配備博世多感測器模組。龐大的消費者需求將降低工業和汽車產業的規模經濟,從而降低單位成本,並開闢新的性價比閾值。為穿戴式裝置而完善的小型化和毫瓦級功耗技術,如今正應用於工廠狀態監測節點和自動配送機器人,加速邊緣感測器堆疊在各產業的跨產業應用。
初期實施成本高
全面部署智慧感測器通常需要同時投資於邊緣閘道器、專用 5G 網路和員工技能提升。對於許多中小型工廠而言,總投資可能超過年銷售額的 0.5%,導致盈虧平衡點推遲四個季度甚至更久。 Milesight 為首爾中小企業提供的承包物聯網套件包含 LoRaWAN 閘道器和控制器,降低了整合難度,但即使是這種「一體化」方案也會對資本預算造成壓力。雖然隨著 MEMS 產量的增加,成本壓力有所緩解,但預計在未來 24 個月內,預算的擔憂仍將抑制資金緊張的營運商採用該技術。
細分分析
累計到2024年,壓力感測器將創造218.8億美元的收入,佔據智慧感測器市場28.40%的最大佔有率。此細分市場的持久性源於其在高級駕駛輔助系統(ADAS)煞車、電動車電池管理和醫療人工呼吸器等領域不可替代的作用。同時,碳化矽隔膜技術的進步使得航太和氫燃料電池堆能夠在超過600°C的動作溫度。影像感測器雖然目前以收益為準較小,但隨著自動駕駛成為強制性要求以及行人偵測攝影機成為標配,預計將以19.20%的複合年成長率成長。全局百葉窗和基於事件的像素的整合,即使在快速變化的光照條件下也能實現高對比度性能,幫助汽車製造商在無需昂貴的雷射雷達冗餘設備的情況下滿足自動緊急制動(AEB)法規的要求。
需求的多樣化也正在改變設備的經濟性。溫度、濕度和流量感測器正被整合到智慧城市供水網路和資料中心溫度控管計劃中,而六軸位置感測器正成為協作機器人的必備組件。結合壓力、溫度和相對濕度感測的混合模組雖然降低了安裝成本,但透過增加原始設備製造商 (OEM) 的轉換成本,也加劇了供應商鎖定。
由於成熟的代工生態系統和專為智慧型手機量身定做的成本結構,MEMS裝置將在2024年佔據智慧感測器市場46.00%的佔有率。光是博世一家公司在2024年就將出貨超過60億顆MEMS裝置,展現出規模優勢。然而,光電感測器和量子感測器預計將以21.50%的複合年成長率成長,這可能會蠶食MEMS在高精度導航和醫療診斷領域的市場佔有率。花旗集團預測,到2030年,量子感測市場規模將達到14億美元,將刺激創業投資的流入。 MEMS領域的現有企業正在透過將生物MEMS通路與邊緣AI DSP核心結合來應對這一挑戰,從而在其技術藍圖中鎖定大宗買家。
包括3M公司在內的美國-JOINT)等產業聯盟正在加速材料研發,以確保先進基板的國內供應鏈。同時,嵌入微機電系統(MEMS)模組的神經形態運算單元也在同步研發中,旨在提供認知能力,同時又不犧牲MEMS技術賴以領先的尺寸和成本優勢。
區域分析
預計到2024年,亞太地區將佔全球銷售額的44.30%,並在2030年之前維持19.70%的複合年成長率。這主要得益於中國「十四五」規劃對國產感測積體電路的補貼以及日本對量子感測研發的補貼。預計2024年,中國國內市場規模將達2,850億元人民幣(約398億美元),其中汽車、工廠自動化和網路通訊三大領域分別佔比超過20%。亞太地區的晶圓代工廠受益於強勁的需求和較低的投入成本通膨,而垂直整合的原始設備製造商(OEM)正在推進整個供應鏈的本地化。
北美持續引領科技發展,尤其是在汽車高階駕駛輔助系統(ADAS)和航太感測領域。Honeywell和恩智浦半導體(NXP)攜手夥伴關係,共同開發人工智慧賦能的航空電子設備,充分體現了該地區對功能安全和邊緣運算的重視。美國持續的產業政策激勵措施,例如《晶片法案》(CHIPS Act)的撥款,促進了ams旗下歐司朗和格羅方德等公司將微機電系統(MEMS)生產線遷回北美,增強了區域韌性。
歐洲雖然在銷售上落後於亞太地區,但正受惠於監管上的利多。歐盟的《通用安全法規II》規定所有新車都必須配備感測器套件,確保即使在景氣衰退時期也能保持穩定的銷售成長。此外,企業減碳目標也刺激了德國、法國和北歐地區對建築自動化和工業效率感測器的需求。
在中東、非洲和南美洲等新興市場,智慧城市建設和資源產業數位化帶來的挑戰正在加速感測器技術的應用。沙烏地阿拉伯的計劃需要密集的環境和交通管理感測器網路,而智利的銅礦則正在安裝堅固耐用的振動感測器以提高採礦效率。低延遲衛星回程傳輸解決方案正在降低連接障礙,使這些地區能夠在沒有傳統通訊基礎設施的情況下採用先進的感測技術。
其他福利:
- Excel格式的市場預測(ME)表
- 3個月的分析師支持
目錄
第1章 引言
- 研究假設和市場定義
- 調查範圍
第2章調查方法
第3章執行摘要
第4章 市場情勢
- 市場概況
- 市場促進因素
- 提高工業IoT的能源效率
- 感測器在家電中的普及
- 車輛和電子健康安全義務
- 小型化和無線技術的進步
- 感測器邊緣人工智慧降低延遲
- 引入 ESG主導的即時監控
- 市場限制
- 初始安裝成本高
- 複雜設計和整合技能差距
- 物聯網網路安全風險
- 稀土元素包裝供應風險
- 價值/供應鏈分析
- 監管格局
- 技術展望
- 波特五力模型
- 新進入者的威脅
- 買方的議價能力
- 供應商的議價能力
- 替代品的威脅
- 競爭對手之間的競爭
第5章 市場規模與成長預測
- 按類型
- 流量感測器
- 濕度感測器
- 位置感測器
- 壓力感測器
- 溫度感測器
- 影像/光學感測器
- 其他類型
- 依技術
- MEMS
- CMOS
- 光譜學
- 量子和光子
- 其他技術
- 按組件
- 類比數位轉換器
- 數位類比轉換器
- 擴大機
- 收發器/射頻前端
- 嵌入式AI核心
- 其他組件
- 按用途
- 航太和國防
- 汽車和運輸
- 醫療保健和醫療設備
- 工業自動化
- 建築和家居自動化
- 家電
- 農業與環境
- 其他用途
- 按地區
- 北美洲
- 美國
- 加拿大
- 墨西哥
- 南美洲
- 巴西
- 阿根廷
- 其他南美
- 歐洲
- 英國
- 德國
- 法國
- 義大利
- 西班牙
- 俄羅斯
- 其他歐洲地區
- 亞太地區
- 中國
- 印度
- 日本
- 韓國
- 其他亞太地區
- 中東和非洲
- 中東
- 沙烏地阿拉伯
- 阿拉伯聯合大公國
- 土耳其
- 其他中東地區
- 非洲
- 南非
- 奈及利亞
- 肯亞
- 其他非洲國家
- 北美洲
第6章 競爭態勢
- 市場集中度
- 策略趨勢
- 市佔率分析
- 公司簡介
- ABB
- Honeywell International
- Eaton Corporation
- Analog Devices
- Infineon Technologies
- NXP Semiconductors
- STMicroelectronics
- Siemens AG
- TE Connectivity
- Legrand
- General Electric
- Vishay Intertechnology
- Bosch Sensortec
- Texas Instruments
- Omron Corporation
- Sensirion AG
- Murata Manufacturing
- Sony Semiconductor
- Samsung Electronics
- Robert Bosch GmbH
第7章 市場機會與未來展望
The smart sensors market reached USD 77.05 billion in 2025 and is forecast to rise to USD 172.90 billion by 2030, translating into a robust 17.54% CAGR.
This growth trajectory is propelled by the convergence of edge artificial intelligence, tightening automotive and healthcare regulations, and industrial automation programs that are moving enterprises from reactive monitoring to predictive intelligence. Mandatory safety features such as automatic emergency braking in vehicles and continuous patient monitoring in medical devices are translating into non-discretionary sensor demand across developed markets. At the same time, edge-AI cores embedded in the latest sensor generations eliminate latency and bandwidth bottlenecks, allowing real-time analytics within power-constrained environments. Supply-chain pressures around gallium and germanium and the race for semiconductor self-sufficiency are keeping average selling prices firm even as unit volumes rise, giving manufacturers headroom for sustained R&D investment. Over the forecast period, performance differentiation is shifting from raw sensitivity metrics to on-board intelligence, cyber-security compliance, and integration flexibility-factors now decisive in procurement shortlists.
Global Smart Sensors Market Trends and Insights
Energy-efficiency Push Across Industrial IoT
Legally binding sustainability reporting is prompting manufacturers to deploy intelligent sensors that deliver measurable kWh savings and CO2 reductions. The European Corporate Sustainability Reporting Directive requires granular energy metrics, pushing factories to install edge-AI sensors that continuously optimise HVAC, lighting, and machine utilisation. SECO's smart CNC retrofit cut production waste by 30% and spare-parts spend by 10%, showcasing hard-dollar returns that justify fleet-wide rollouts. Similar results at Lech-Stahlwerke's 5G-enabled mill have turned energy-efficiency projects into board-level priorities. As early adopters report double-digit cost reductions, laggards face competitive pressure to follow suit, creating a self-reinforcing demand cycle for intelligent sensors.
Consumer-electronics Sensor Proliferation
Smartphone and wearable OEMs now integrate up to a dozen sensor types per device, supporting features such as air-quality measurement, advanced biometrics, and self-learning activity tracking. Bosch confirms that more than half of 2025 handset launches ship with its multi-sensor modules. High-volume consumer demand delivers scale economies that drive per-unit cost down across industrial and automotive tiers, opening new price-performance thresholds. Miniaturisation and milliwatt-level power consumption perfected for wearables are now migrating into factory condition-monitoring nodes and autonomous delivery robots, accelerating cross-industry adoption of edge-ready sensor stacks.
High Upfront Deployment Cost
Comprehensive smart sensor rollouts frequently require parallel investment in edge gateways, private 5G networks, and workforce reskilling. For many small and midsized plants, total outlay can exceed 0.5% of annual revenue, deferring breakeven beyond four fiscal quarters. Milesight's turnkey IoT kit for Seoul SMEs bundles LoRaWAN gateways and controllers to lower integration friction, yet even this "all-in-one" package strains capital budgets. Cost headwinds are easing as MEMS volumes scale, but budgetary caution is expected to temper adoption among cash-constrained operators over the next 24 months.
Other drivers and restraints analyzed in the detailed report include:
- Automotive & E-health Safety Mandates
- On-sensor Edge-AI Lowers Latency
- Complex Design & Integration Skill Gap
For complete list of drivers and restraints, kindly check the Table Of Contents.
Segment Analysis
Pressure sensors contributed USD 21.88 billion in 2024, translating to the largest 28.40% share of the smart sensors market. The segment's durability stems from its irreplaceable role in ADAS braking, EV battery management, and medical ventilators. Parallel innovation in silicon-carbide diaphragms now extends operating envelopes above 600 °C for aerospace and hydrogen fuel-cell stacks. Image sensors, while smaller in revenue terms, are forecast to grow at 19.20% CAGR as autonomous driving mandates make pedestrian-detection cameras standard equipment. Integration of global-shutter and event-based pixels is allowing high-contrast performance under rapidly changing lighting, enabling vehicle OEMs to comply with AEB regulations without expensive LiDAR redundancy.
Demand diversification is also reshaping unit economics. Temperature, humidity, and flow sensors are piggy-backing on smart-city water-grid and data-center thermal-management projects, while six-axis position sensors are becoming mandatory in collaborative robots. Hybrid modules that blend pressure, temperature, and relative humidity sensing deliver installation savings and strengthen vendor lock-in by raising switching costs for OEMs.
MEMS devices captured 46.00% of smart sensors market share in 2024 due to mature foundry ecosystems and cost structures tuned for smartphone volumes. Bosch alone shipped over 6 billion MEMS units in 2024, underscoring the scale advantage. However, photonic and quantum-enhanced sensors are projected to expand at 21.50% CAGR and could clip MEMS share in high-precision navigation and medical diagnostics. Citigroup estimates the quantum sensing addressable market could reach USD 1.4 billion by 2030, catalyzing venture capital inflows. MEMS incumbents are responding by co-integrating BioMEMS channels and edge-AI DSP cores to keep volume buyers within their technology roadmap.
Industry consortia such as the US-JOINT program, which includes 3M, are accelerating material R&D to secure domestic supply chains for advanced substrates. A parallel push into neuromorphic compute tiles embedded in MEMS modules aims to deliver cognitive functionality without sacrificing the size-cost advantage that underpin MEMS leadership.
The Smart Sensors Market is Segmented by Type (Flow Sensor, Humidity Sensor, Position Sensor, Pressure Sensor, and More), by Technology (MEMS, CMOS, Optical Spectroscopy, and More), by Component (Analog-To-Digital Converter, Digital-To-Analog Converter, Amplifier, and More), by Application (Aerospace and Defense, Automotive and Transportation, and More), and by Geography. The Market Forecasts are Provided in Terms of Value (USD).
Geography Analysis
Asia-Pacific delivered 44.30% of 2024 global revenue and is expected to record a 19.70% CAGR through 2030, underpinned by China's 14th Five-Year Plan subsidies for domestic sensing ICs and Japan's coordinated quantum-sensing R&D grants. China's domestic market hit CNY 285 billion (USD 39.8 billion) in 2024, with automotive, factory automation, and network communications each capturing above-20% share. Regional foundries benefit from captive demand and lower input-cost inflation, prompting vertically integrated OEMs to localise entire supply chains.
North America remains technological bellwether, particularly in automotive ADAS and aerospace sensing. Honeywell's strategic partnership with NXP to co-develop AI-ready avionics exemplifies the region's focus on functional safety and edge compute. Ongoing US industrial-policy incentives, including CHIPS Act grants, are encouraging on-shoring of MEMS lines by ams OSRAM and GlobalFoundries, improving regional resilience.
Europe, while trailing APAC in volume, benefits from regulatory pull. The EU General Safety Regulation II sets a baseline of mandatory sensor suites in every new vehicle, guaranteeing steady volume ramps even in economic downturns. Additionally, corporate carbon-reduction targets are stimulating demand for building-automation and industrial-efficiency sensors across Germany, France, and the Nordics.
Emerging markets in the Middle East, Africa, and South America show accelerating sensor uptake through smart-city and resource-sector digitisation agendas. Saudi Arabia's giga-projects require dense environmental and traffic-management sensor grids, whereas Chilean copper mines are installing ruggedised vibration sensors to raise extraction efficiency. Low-latency satellite backhaul solutions are easing connectivity barriers, allowing these regions to adopt advanced sensing without legacy telecom infrastructure.
- ABB
- Honeywell International
- Eaton Corporation
- Analog Devices
- Infineon Technologies
- NXP Semiconductors
- STMicroelectronics
- Siemens AG
- TE Connectivity
- Legrand
- General Electric
- Vishay Intertechnology
- Bosch Sensortec
- Texas Instruments
- Omron Corporation
- Sensirion AG
- Murata Manufacturing
- Sony Semiconductor
- Samsung Electronics
- Robert Bosch GmbH
Additional Benefits:
- The market estimate (ME) sheet in Excel format
- 3 months of analyst support
TABLE OF CONTENTS
1 INTRODUCTION
- 1.1 Study Assumptions and Market Definition
- 1.2 Scope of the Study
2 RESEARCH METHODOLOGY
3 EXECUTIVE SUMMARY
4 MARKET LANDSCAPE
- 4.1 Market Overview
- 4.2 Market Drivers
- 4.2.1 Energy-efficiency push across industrial IoT
- 4.2.2 Consumer-electronics sensor proliferation
- 4.2.3 Automotive and e-health safety mandates
- 4.2.4 Miniaturisation and wireless advances
- 4.2.5 On-sensor edge-AI lowers latency
- 4.2.6 ESG-driven live-monitoring adoption
- 4.3 Market Restraints
- 4.3.1 High upfront deployment cost
- 4.3.2 Complex design and integration skill gap
- 4.3.3 IoT cybersecurity exposure
- 4.3.4 Rare-earth packaging supply risk
- 4.4 Value / Supply-Chain Analysis
- 4.5 Regulatory Landscape
- 4.6 Technological Outlook
- 4.7 Porter's Five Forces
- 4.7.1 Threat of New Entrants
- 4.7.2 Bargaining Power of Buyers
- 4.7.3 Bargaining Power of Suppliers
- 4.7.4 Threat of Substitutes
- 4.7.5 Competitive Rivalry
5 MARKET SIZE AND GROWTH FORECASTS (VALUE)
- 5.1 By Type
- 5.1.1 Flow Sensors
- 5.1.2 Humidity Sensors
- 5.1.3 Position Sensors
- 5.1.4 Pressure Sensors
- 5.1.5 Temperature Sensors
- 5.1.6 Image/Optical Sensors
- 5.1.7 Other Types
- 5.2 By Technology
- 5.2.1 MEMS
- 5.2.2 CMOS
- 5.2.3 Optical Spectroscopy
- 5.2.4 Quantum and Photonic
- 5.2.5 Other Technologies
- 5.3 By Component
- 5.3.1 Analog-to-Digital Converter
- 5.3.2 Digital-to-Analog Converter
- 5.3.3 Amplifier
- 5.3.4 Transceiver / RF Front-End
- 5.3.5 Embedded AI Core
- 5.3.6 Other Components
- 5.4 By Application
- 5.4.1 Aerospace and Defence
- 5.4.2 Automotive and Transportation
- 5.4.3 Healthcare and Medical Devices
- 5.4.4 Industrial Automation
- 5.4.5 Building and Home Automation
- 5.4.6 Consumer Electronics
- 5.4.7 Agriculture and Environmental
- 5.4.8 Other Applications
- 5.5 By Geography
- 5.5.1 North America
- 5.5.1.1 United States
- 5.5.1.2 Canada
- 5.5.1.3 Mexico
- 5.5.2 South America
- 5.5.2.1 Brazil
- 5.5.2.2 Argentina
- 5.5.2.3 Rest of South America
- 5.5.3 Europe
- 5.5.3.1 United Kingdom
- 5.5.3.2 Germany
- 5.5.3.3 France
- 5.5.3.4 Italy
- 5.5.3.5 Spain
- 5.5.3.6 Russia
- 5.5.3.7 Rest of Europe
- 5.5.4 APAC
- 5.5.4.1 China
- 5.5.4.2 India
- 5.5.4.3 Japan
- 5.5.4.4 South Korea
- 5.5.4.5 Rest of APAC
- 5.5.5 Middle East and Africa
- 5.5.5.1 Middle East
- 5.5.5.1.1 Saudi Arabia
- 5.5.5.1.2 UAE
- 5.5.5.1.3 Turkey
- 5.5.5.1.4 Rest of Middle East
- 5.5.5.2 Africa
- 5.5.5.2.1 South Africa
- 5.5.5.2.2 Nigeria
- 5.5.5.2.3 Kenya
- 5.5.5.2.4 Rest of Africa
- 5.5.1 North America
6 COMPETITIVE LANDSCAPE
- 6.1 Market Concentration
- 6.2 Strategic Moves
- 6.3 Market Share Analysis
- 6.4 Company Profiles (includes Global level Overview, Market level overview, Core Segments, Financials as available, Strategic Information, Market Rank/Share, Products and Services, Recent Developments)
- 6.4.1 ABB
- 6.4.2 Honeywell International
- 6.4.3 Eaton Corporation
- 6.4.4 Analog Devices
- 6.4.5 Infineon Technologies
- 6.4.6 NXP Semiconductors
- 6.4.7 STMicroelectronics
- 6.4.8 Siemens AG
- 6.4.9 TE Connectivity
- 6.4.10 Legrand
- 6.4.11 General Electric
- 6.4.12 Vishay Intertechnology
- 6.4.13 Bosch Sensortec
- 6.4.14 Texas Instruments
- 6.4.15 Omron Corporation
- 6.4.16 Sensirion AG
- 6.4.17 Murata Manufacturing
- 6.4.18 Sony Semiconductor
- 6.4.19 Samsung Electronics
- 6.4.20 Robert Bosch GmbH
7 MARKET OPPORTUNITIES AND FUTURE OUTLOOK
- 7.1 White-space and Unmet-Need Assessment
 智慧感測器市場報告:按類型、最終用戶和地區分類(2026-2034 年)
 智慧感測器市場:按感測器類型、連接方式、應用和最終用戶分類的全球市場預測 – 2026-2032 年
 全球智慧感測器市場規模、佔有率、趨勢和成長分析報告(2026-2034)
 2026年全球智慧感測器市場報告3D智慧感測器市場:依技術、組件、平台、產品、應用、通路分類,全球預測(2026-2032年)
 智慧感測器市場分析及預測(至2035年):按類型、產品類型、服務、技術、組件、應用、部署類型、最終用戶和功能分類日本工業智慧感測器市場規模、佔有率、趨勢和預測:按類型、最終用戶和地區分類,2026-2034年2026年全球智慧感測器市場報告
 智慧感測器市場-全球產業規模、佔有率、趨勢、機會、預測:按類型、組件、應用、地區和競爭對手分類,2021-2031年智慧監控感測器市場:依產品類型、技術、連接方式、終端用戶產業、應用、分銷管道分類-2026-2032年全球預測