


 |
市場調查報告書
商品編碼
1850194
分析即服務:市場佔有率分析、產業趨勢、統計數據和成長預測(2025-2030 年)Analytics As A Service - Market Share Analysis, Industry Trends & Statistics, Growth Forecasts (2025 - 2030) |
||||||
※ 本網頁內容可能與最新版本有所差異。詳細情況請與我們聯繫。
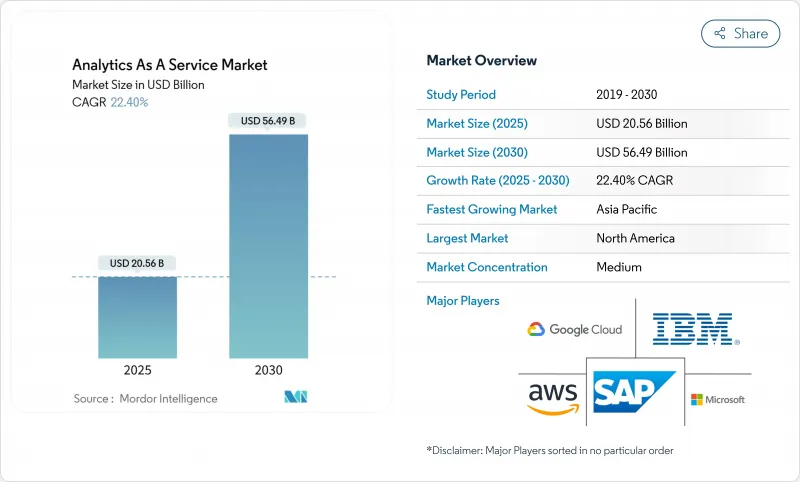
據估計,到 2025 年,分析即服務市場規模將達到 205.6 億美元,預計到 2030 年將達到 564.9 億美元,預測期(2025-2030 年)複合年成長率為 22.40%。
雲端優先的資料現代化專案正在推動市場需求,因為它們使企業能夠淘汰本地部署的分析堆疊,轉而使用計量收費服務。向量原生資料儲存的快速普及也使得生成式人工智慧能夠即時處理非結構化資料。儘管目前公共雲端採用率領先,但隨著企業在成本控制和資料主權規則之間尋求平衡,混合雲策略正在興起。隨著超大規模平台不斷增強人工智慧能力,而專業供應商則專注於垂直產業解決方案和嵌入式分析,競爭日益激烈。然而,人才短缺和數據擴展的經濟性問題仍然影響著實施時間表和投資回報率的計算。
全球分析即服務市場趨勢與洞察
雲端優先企業數據現代化計劃
現代化計劃正推動將孤立的資料整合到支援人工智慧管道的雲端原生平台上。 IBM 的一份報告顯示,大多數大型企業計劃到 2025 年在雲端運行大部分工作負載,這凸顯了企業正在逐步淘汰傳統資料倉儲。供應商提供全端遷移套件,以簡化工作負載的可攜性、自動轉換模式,並在多區域環境中維護安全控制。金融服務、醫療保健和零售業認為,採用資料倉儲的關鍵優勢在於能夠更快獲得洞察並降低基礎設施開銷。隨著支出從資本支出轉向營運支出,服務提供者正透過透明的定價、整合管治和預先建置的人工智慧服務來實現差異化競爭,加速資料倉儲的普及應用。
人工智慧賦能的向量原生資料儲存的興起
向量資料庫正在幫助解鎖非結構化內容,從而實現生成式人工智慧搜尋、建議和聊天體驗。 Oracle 已在 HeatWave GenAI 中內建了自動向量儲存。 SalesforceOracle已在其資料雲中提供向量功能。這些整合簡化了大規模相似性查詢,無需單獨的索引層。企業能夠在單一平台上將文字、語音和圖像嵌入與交易資料結合,從而降低延遲和營運複雜性。零售和媒體產業率先採用這種方法來實現個人化體驗,而工業企業則利用向量搜尋來改進品質檢測模型。市場參與企業強調開放原始碼相容性和可簡化模型重新訓練的協調管道。
超大規模資料中心出口費用飆漲的經濟學原理
資料傳輸費用通常佔雲端帳單的 10% 到 15%。這些費用阻礙了多重雲端分析架構的發展,因為在不同平台之間遷移Terabyte會增加總體擁有成本。英國競爭管理局已將遷移費用列為用戶切換平台的一大障礙。雖然一些服務提供者在特定條件下提供了費用減免,但客戶仍然面臨合約方面的限制。服務整合商目前正在推廣一些架構,這些架構將大型資料集保存在獨立的儲存層中,或採用動態資料最佳化技術,例如 Rackspace 的 Data Freedom,承諾可節省高達 85% 的成本。
細分市場分析
大型企業正利用巨額預算部署企業級資料湖和高階建模工具,預計到2024年,這些投入將佔其總收入的64%。大型企業分析設施通常與長期使用的ERP和CRM系統整合,以實現跨職能儀錶板和人工智慧主導的預測。跨國公司也優先考慮自主控制,推動基於特定區域的部署,並透過專用骨幹網路進行互聯。
儘管中小企業目前市佔率較小,但到2030年,它們的複合年成長率將高達24.3%,成為成長最快的企業。計量型模式和承包模板降低了沒有專門資料科學團隊的企業的進入門檻。無程式碼介面、自動化機器學習服務和包裝的垂直產業分析工具,能夠幫助創辦人快速獲取洞察,從而最佳化庫存並進行精準行銷。隨著中小企業採用率的提高,供應商正在試行簡化的財務營運主機,將工作負載成本與業務關鍵績效指標 (KPI) 關聯起來,並促進財務和營運團隊之間的透明預算。中小企業的湧入將擴大分析即服務 (AaaS) 市場的基本客群,促使供應商推出輕量級服務層級和社區主導的教育資源。
到2024年,公共雲端仍將佔據48.3%的收入佔有率,因為共用基礎設施能夠實現即時彈性擴展、全球覆蓋和持續的功能升級。新興企業數位原民企業正在利用完全託管的分析堆疊,既避免了資料中心成本,又能使用最新的AI加速器。然而,受監管產業的公司為了滿足居住義務和內部風險管理政策,仍然將敏感工作負載保存在私人環境中。
混合架構將以 26.7% 的複合年成長率成長,融合了私有雲端的可擴展性和私有雲的控制力。 IBM 指出,混合配置提供了更大的靈活性,讓團隊可以將資料和運算資源放置在最合適的位置。企業通常將原始資料儲存在私有物件儲存中,並在需要大規模模型訓練時將其擴展到公有叢集。這種拓撲結構降低了流量出口成本,並支援分層災害復原。隨著對雲端主權的需求不斷成長,雲端服務供應商正在推出區域性主權雲端區域和雲端間網路服務,進一步提升了混合架構在分析即服務市場的吸引力。
分析即服務市場按公司規模(中小企業、大型企業)、部署模式(公共雲端、私有雲端、混合雲端)、分析類型(說明分析、診斷性分析、其他)、最終用戶產業(IT與通訊、銀行、金融服務和保險、醫療保健與生命科學、其他)以及地區進行細分。市場預測以美元計價。
區域分析
北美地區預計在2024年將佔全球收入的42.8%,這主要得益於雲端運算的普及、成熟的人工智慧人才儲備以及大型雲端服務商持續不斷的產品創新。美國醫療保健、零售和媒體公司正在應用大規模分析技術來實現個人化體驗、最佳化物流並推動精準醫療的發展。政府機構也在擴大資料共用舉措,以支援分析工作負載。加拿大公司也緊跟其後,迅速採用主權雲端區域以滿足公共部門資料居住法的要求。墨西哥的製造業走廊正在將雲端分析技術融入以出口為導向的供應鏈,以彌補營運洞察方面的不足。
亞太地區預計將以25.4%的複合年成長率實現最高成長,這主要得益於中國、日本、印度和東南亞地區積極推動的數位經濟發展策略。快速擴張的電子商務平台每天都會收集Terabyte的行為數據,而金融科技公司則部署針對服務不足人口的信貸模式。本地雲端服務供應商正與跨國超大規模超大規模資料中心業者合作,建置符合區域標準的雲端基礎設施,從而降低延遲,並打造自主的分析即服務(AaaS)市場。政府為智慧工廠部署提供的獎勵策略將進一步推動需求,而中小企業也將利用低成本的服務包實現系統升級,從而跨越傳統系統。
歐洲的成長很大程度上受到隱私和人工智慧管治框架的影響。 GDPR的嚴格執行以及即將訂定的歐盟人工智慧法規正促使企業採用可解釋模型、審核層和主權雲端控制。 AWS宣布將在德國設立一個實體,經營一個獨立的歐洲主權雲,目標是在2025年下半年投入使用。金融機構正在實施多區域冗餘以維持營運彈性,而製造商則將物聯網數據連接到分析管道以支援其能源效率目標。因此,歐洲的分析即服務市場正在創新與合規之間尋求平衡,從而形成一種既滿足業務需求又滿足監管需求的混合模式。
其他福利:
- Excel格式的市場預測(ME)表
- 3個月的分析師支持
目錄
第1章 引言
- 研究假設和市場定義
- 調查範圍
第2章調查方法
第3章執行摘要
第4章 市場情勢
- 市場概覽
- 市場促進因素
- 雲端優先企業數據現代化計劃
- 人工智慧賦能的原生向量資料儲存的興起
- 中小企業向雲端遷移正在推動對付費使用制的需求。
- 合規主導的即時審核分析(例如 DORA、SEC)
- 垂直產業SaaS「迷你雲」中的嵌入式分析
- 主權雲指令將促進區域性AaaS的創建。
- 市場限制
- 超大規模資料中心業者中心出口定價變得更經濟實惠
- 財務營運和數據營運人才短缺
- 模型可解釋性法規減緩了其應用。
- 限制使用非綠色資料中心的碳排放強度配額
- 產業價值鏈分析
- 監管環境
- 技術展望
- 關鍵績效指標(KPI)
- 產業吸引力-波特五力分析
- 新進入者的威脅
- 買方的議價能力
- 供應商的議價能力
- 替代品的威脅
- 競爭對手之間的競爭
- 影響市場的宏觀經濟因素
第5章 市場規模及成長預測(數值)
- 按公司規模
- 小型企業
- 主要企業
- 按部署模式
- 公共雲端
- 私有雲端
- 混合雲端
- 按分析類型
- 說明分析
- 診斷分析
- 預測分析
- 指示性分析
- 按最終用戶行業分類
- 資訊科技/通訊
- BFSI
- 醫療保健和生命科學
- 零售與電子商務
- 製造業
- 能源與公共產業
- 政府和公共部門
- 其他終端用戶產業
- 按地區
- 北美洲
- 美國
- 加拿大
- 墨西哥
- 南美洲
- 巴西
- 阿根廷
- 智利
- 其他南美洲
- 歐洲
- 德國
- 英國
- 法國
- 義大利
- 西班牙
- 俄羅斯
- 其他歐洲地區
- 亞太地區
- 中國
- 日本
- 印度
- 韓國
- 澳洲
- 新加坡
- 馬來西亞
- 亞太其他地區
- 中東和非洲
- 中東
- 沙烏地阿拉伯
- 阿拉伯聯合大公國
- 土耳其
- 其他中東地區
- 非洲
- 南非
- 奈及利亞
- 埃及
- 其他非洲地區
- 北美洲
第6章 競爭情勢
- 市場集中度
- 策略趨勢
- 市佔率分析
- 公司簡介
- Amazon Web Services
- Microsoft Corporation
- Google Cloud(Alphabet Inc.)
- IBM Corporation
- SAP SE
- Oracle Corporation
- Hewlett Packard Enterprise
- SAS Institute
- Accenture PLC
- Teradata Corporation
- Snowflake Inc.
- Databricks, Inc.
- Salesforce, Inc.
- Tableau Software, LLC
- QlikTech International AB
- MicroStrategy Incorporated
- TIBCO Software, Inc.
- Alteryx, Inc.
- Splunk Inc.
- Domo, Inc.
- Sisense Ltd.
- ThoughtSpot, Inc.
- Looker Studio(Google)
- GoodData, Inc.
- Zoho Analytics(Zoho Corporation)
第7章 市場機會與未來趨勢
- 閒置頻段與未滿足需求評估
The Analytics as a Service Market size is estimated at USD 20.56 billion in 2025, and is expected to reach USD 56.49 billion by 2030, at a CAGR of 22.40% during the forecast period (2025-2030).
Demand is rising because cloud-first data-modernization programs allow enterprises to retire on-premises analytics stacks and shift to pay-as-you-go services. The fast spread of vector-native data stores is also enabling real-time processing of unstructured data for generative AI. Public cloud deployments lead today, yet hybrid strategies are advancing as firms balance cost control with data-sovereignty rules. Competitive intensity is mounting as hyperscale platforms deepen AI capabilities while specialist providers focus on vertical solutions and embedded analytics. Talent shortages and data-egress economics, however, continue to influence implementation timelines and ROI calculations.
Global Analytics As A Service Market Trends and Insights
Cloud-First Enterprise Data-Modernization Programmes
Modernization projects are motivating organisations to consolidate siloed data into cloud-native platforms that support AI-ready pipelines. IBM reports that a majority of large enterprises plan to run most workloads in the cloud by 2025, underscoring a pivot away from legacy data warehouses. Vendors position full-stack migration toolkits to simplify workload portability, automate schema conversion, and uphold security controls across multi-region environments. Financial services, healthcare, and retail adopters cite quicker time-to-insight and lower infrastructure overhead as primary benefits. As spending shifts from capital expenditure to operating expenditure, service providers differentiate on transparent pricing, integrated governance, and pre-built AI services to accelerate deployment.
Proliferation of Gen-AI-Ready, Vector-Native Data Stores
Vector databases are helping firms unlock unstructured content for generative AI search, recommendation, and chat experiences. Oracle embedded automated vector stores inside its HeatWave GenAI offering. Salesforce followed by enabling vector capabilities in Data Cloud. These integrations simplify similarity queries at scale without separate indexing layers. Enterprises gain the ability to combine text, audio, and image embeddings with transactional data inside a single platform, reducing latency and operational complexity. Early adopters in retail and media use the approach to personalise experiences, while industrial firms employ vector search to refine quality-inspection models. Market entrants emphasise open-source compatibility and orchestrated pipelines that ease model retraining.
Escalating Hyperscaler Egress-Fee Economics
Data-transfer fees can represent 10%-15% of a typical cloud invoice. These charges deter multi-cloud analytics architectures because shifting terabytes between platforms inflates total cost of ownership. The UK Competition and Markets Authority flagged egress fees as a switching barrier. Although some providers have introduced fee waivers under certain conditions, customers still face contractual hurdles. Service integrators now promote architectures that keep large datasets in neutral storage tiers or employ data-in-motion optimisation, such as Rackspace's Data Freedom offering, claiming up to 85% cost reduction.
Other drivers and restraints analyzed in the detailed report include:
- Rising Pay-as-You-Go Demand from SMB Cloud Migrations
- Compliance-Driven Real-Time Audit Analytics
- Shortage of FinOps and Data-Ops Talent
For complete list of drivers and restraints, kindly check the Table Of Contents.
Segment Analysis
Large Enterprises accounted for 64% of 2024 revenue as they leverage deep budgets to deploy enterprise-wide data lakes and advanced modelling tools. Their analytics estates often integrate with long-standing ERP and CRM systems, enabling cross-functional dashboards and AI-driven forecasting. Multi-nationals also prioritise sovereignty controls, leading to region-specific deployments that interconnect via private backbone networks.
SMEs contribute a smaller share today yet will record the highest 24.3% CAGR to 2030. Pay-as-you-go pricing and turnkey templates lower barriers for firms without dedicated data-science teams. No-code interfaces, auto-ML services, and packaged vertical analytics help founders draw insights quickly, supporting inventory optimisation and targeted marketing. As SMB adoption broadens, vendors pilot simplified FinOps consoles that map workload cost to business KPIs, fostering transparent budgeting across finance and operations teams. The influx of SMEs broadens the Analytics as a Service market customer base, encouraging providers to release lightweight service tiers and community-led education.
Public cloud maintained 48.3% of 2024 revenue because its shared infrastructure grants instant elasticity, global reach, and continuous feature upgrades. Start-ups and digital natives rely on fully managed analytics stacks, avoiding data-centre expenditures while accessing the latest AI accelerators. However, firms in regulated industries retain sensitive workloads in private environments to satisfy residency mandates and internal risk policies.
Hybrid architectures are set to expand at a 26.7% CAGR, blending public scalability with private-cloud control. IBM notes that hybrid deployments improve flexibility by letting teams locate data and compute where each performs best. Enterprises commonly stage raw data in private object stores, then burst to public clusters for large-scale model training. This topology mitigates egress fees and supports tiered disaster-recovery postures. As sovereignty requirements rise, providers introduce region-specific sovereign cloud zones and inter-cloud networking services, further reinforcing hybrid appeal within the Analytics as a Service market.
Analytics As A Service Market is Segmented by Enterprise Size (Small and Medium Enterprises and Large Enterprises), Deployment Model (Public Cloud, Private Cloud, and Hybrid Cloud), Analytics Type (Descriptive Analytics, Diagnostic Analytics, and More), End-User Industry (IT and Telecommunication, BFSI, Healthcare and Life-Sciences, and More), and Geography. The Market Forecasts are Provided in Terms of Value (USD).
Geography Analysis
North America held 42.8% of 2024 revenue, anchored by widespread cloud adoption, mature AI talent pools, and constant product innovation from dominant hyperscalers. United States enterprises in healthcare, retail, and media apply large-scale analytics to personalise experiences, optimise logistics, and drive precision medicine. Government agencies also expand data-sharing initiatives that fuel analytic workloads. Canadian organisations follow with fast uptake of sovereign cloud zones that fulfil public-sector data-residency laws. Mexico's manufacturing corridors integrate cloud analytics into export-oriented supply chains, closing operational insight gaps.
Asia-Pacific is projected to produce the highest 25.4% CAGR, driven by aggressive digital-economic agendas in China, Japan, India, and Southeast Asia. Rapidly scaling e-commerce platforms ingest terabytes of behavioural data daily, while fintechs roll out credit models targeting underserved populations. Local cloud providers partner with multinational hyperscalers to build regionally compliant infrastructure, lowering latency and enabling sovereign-ready Analytics as a Service market offerings. Government stimulus programmes for smart-factory rollouts further stimulate demand, and SMEs leverage low-cost service bundles to leapfrog legacy systems.
Europe occupies a significant share shaped by privacy and AI governance frameworks. Strict GDPR enforcement and forthcoming EU AI Act rules push firms to deploy explainable models, audit layers, and sovereign cloud controls. AWS announced a Germany-based corporate entity to operate an independent European Sovereign Cloud with launch targeted for late 2025. Financial institutions implement multi-region redundancy to maintain operational resilience, while manufacturers connect IoT data into analytics pipelines that support energy-efficiency targets. The Analytics as a Service market in Europe thus balances innovation with compliance, promoting hybrid patterns that satisfy both business and regulatory imperatives.
- Amazon Web Services
- Microsoft Corporation
- Google Cloud (Alphabet Inc.)
- IBM Corporation
- SAP SE
- Oracle Corporation
- Hewlett Packard Enterprise
- SAS Institute
- Accenture PLC
- Teradata Corporation
- Snowflake Inc.
- Databricks, Inc.
- Salesforce, Inc.
- Tableau Software, LLC
- QlikTech International AB
- MicroStrategy Incorporated
- TIBCO Software, Inc.
- Alteryx, Inc.
- Splunk Inc.
- Domo, Inc.
- Sisense Ltd.
- ThoughtSpot, Inc.
- Looker Studio (Google)
- GoodData, Inc.
- Zoho Analytics (Zoho Corporation)
Additional Benefits:
- The market estimate (ME) sheet in Excel format
- 3 months of analyst support
TABLE OF CONTENTS
1 INTRODUCTION
- 1.1 Study Assumptions and Market Definition
- 1.2 Scope of the Study
2 RESEARCH METHODOLOGY
3 EXECUTIVE SUMMARY
4 MARKET LANDSCAPE
- 4.1 Market Overview
- 4.2 Market Drivers
- 4.2.1 Cloud-first enterprise data-modernization programmes
- 4.2.2 Proliferation of Gen-AI-ready, vector-native data stores
- 4.2.3 Rising pay-as-you-go demand from SMB cloud migrations
- 4.2.4 Compliance-driven real-time audit analytics (e.g., DORA, SEC)
- 4.2.5 Embedded analytics in vertical SaaS 'mini-clouds'
- 4.2.6 Sovereign-cloud mandates spurring regional AaaS build-outs
- 4.3 Market Restraints
- 4.3.1 Escalating hyperscaler egress-fee economics
- 4.3.2 Shortage of FinOps and data-ops talent
- 4.3.3 Model-explainability regulations delaying roll-outs
- 4.3.4 Carbon-intensity quotas limiting non-green data-centre use
- 4.4 Industry Value Chain Analysis
- 4.5 Regulatory Landscape
- 4.6 Technological Outlook
- 4.7 Key Performance Indicators (KPIs)
- 4.8 Industry Attractiveness - Porter's Five Forces Analysis
- 4.8.1 Threat of New Entrants
- 4.8.2 Bargaining Power of Buyers
- 4.8.3 Bargaining Power of Suppliers
- 4.8.4 Threat of Substitutes
- 4.8.5 Intensity of Competitive Rivalry
- 4.9 Impact of Macroeconomic Factors on the Market
5 MARKET SIZE AND GROWTH FORECASTS (VALUES)
- 5.1 By Enterprise Size
- 5.1.1 Small and Medium Enterprises (SME)
- 5.1.2 Large Enterprises
- 5.2 By Deployment Model
- 5.2.1 Public Cloud
- 5.2.2 Private Cloud
- 5.2.3 Hybrid Cloud
- 5.3 By Analytics Type
- 5.3.1 Descriptive Analytics
- 5.3.2 Diagnostic Analytics
- 5.3.3 Predictive Analytics
- 5.3.4 Prescriptive Analytics
- 5.4 By End-user Industry
- 5.4.1 IT and Telecommunication
- 5.4.2 BFSI
- 5.4.3 Healthcare and Life-Sciences
- 5.4.4 Retail and E-Commerce
- 5.4.5 Manufacturing
- 5.4.6 Energy and Utilities
- 5.4.7 Government and Public Sector
- 5.4.8 Other End-user Industries
- 5.5 By Geography
- 5.5.1 North America
- 5.5.1.1 United States
- 5.5.1.2 Canada
- 5.5.1.3 Mexico
- 5.5.2 South America
- 5.5.2.1 Brazil
- 5.5.2.2 Argentina
- 5.5.2.3 Chile
- 5.5.2.4 Rest of South America
- 5.5.3 Europe
- 5.5.3.1 Germany
- 5.5.3.2 United Kingdom
- 5.5.3.3 France
- 5.5.3.4 Italy
- 5.5.3.5 Spain
- 5.5.3.6 Russia
- 5.5.3.7 Rest of Europe
- 5.5.4 Asia-Pacific
- 5.5.4.1 China
- 5.5.4.2 Japan
- 5.5.4.3 India
- 5.5.4.4 South Korea
- 5.5.4.5 Australia
- 5.5.4.6 Singapore
- 5.5.4.7 Malaysia
- 5.5.4.8 Rest of Asia-Pacific
- 5.5.5 Middle East and Africa
- 5.5.5.1 Middle East
- 5.5.5.1.1 Saudi Arabia
- 5.5.5.1.2 United Arab Emirates
- 5.5.5.1.3 Turkey
- 5.5.5.1.4 Rest of Middle East
- 5.5.5.2 Africa
- 5.5.5.2.1 South Africa
- 5.5.5.2.2 Nigeria
- 5.5.5.2.3 Egypt
- 5.5.5.2.4 Rest of Africa
- 5.5.1 North America
6 COMPETITIVE LANDSCAPE
- 6.1 Market Concentration
- 6.2 Strategic Moves
- 6.3 Market Share Analysis
- 6.4 Company Profiles (includes Global level Overview, Market level overview, Core Segments, Financials as available, Strategic Information, Market Rank/Share for key companies, Products and Services, and Recent Developments)
- 6.4.1 Amazon Web Services
- 6.4.2 Microsoft Corporation
- 6.4.3 Google Cloud (Alphabet Inc.)
- 6.4.4 IBM Corporation
- 6.4.5 SAP SE
- 6.4.6 Oracle Corporation
- 6.4.7 Hewlett Packard Enterprise
- 6.4.8 SAS Institute
- 6.4.9 Accenture PLC
- 6.4.10 Teradata Corporation
- 6.4.11 Snowflake Inc.
- 6.4.12 Databricks, Inc.
- 6.4.13 Salesforce, Inc.
- 6.4.14 Tableau Software, LLC
- 6.4.15 QlikTech International AB
- 6.4.16 MicroStrategy Incorporated
- 6.4.17 TIBCO Software, Inc.
- 6.4.18 Alteryx, Inc.
- 6.4.19 Splunk Inc.
- 6.4.20 Domo, Inc.
- 6.4.21 Sisense Ltd.
- 6.4.22 ThoughtSpot, Inc.
- 6.4.23 Looker Studio (Google)
- 6.4.24 GoodData, Inc.
- 6.4.25 Zoho Analytics (Zoho Corporation)
7 MARKET OPPORTUNITIES AND FUTURE TRENDS
- 7.1 White-Space and Unmet-Need Assessment
 分析即服務市場:2026-2032年全球市場預測(依分析類型、定價模式、資料類型、產業、最終使用者和組織規模分類)
 2026年全球分析即服務市場報告
 分析即服務 (AaaS) 市場規模、佔有率、趨勢和預測:按類型、組件、部署模式、企業規模、行業和地區分類,2026-2034 年
 分析即服務市場分析及至 2035 年預測:按類型、產品類型、服務、技術、組件、應用、部署類型、最終用戶、解決方案和交付類型分類
 全球分析即服務市場規模、佔有率、趨勢和成長分析報告,2026-2034年
 分析即服務市場-全球產業規模、佔有率、趨勢、機會與預測:按類型、部署模式、組件、應用、地區和競爭格局分類,2021-2031年
 分析即服務市場規模、佔有率和成長分析(按組件、分析類型、公司規模、部署類型、最終用戶產業和地區分類)-2026-2033年產業預測
 分析即服務的全球市場評估,類別,不同企業規模,各終端用戶產業,各地區,機會及預測,2018年~2032年
 2032 年分析即服務市場預測:按資料類型、服務類型、技術、應用、最終用戶和地區進行的全球分析
 2025-2029 年全球分析即服務 (AaasS) 市場