


 |
市場調查報告書
商品編碼
1850177
網路附加儲存 (NAS):市場佔有率分析、產業趨勢、統計數據和成長預測(2025-2030 年)Network Attached Storage (NAS) - Market Share Analysis, Industry Trends & Statistics, Growth Forecasts (2025 - 2030) |
||||||
※ 本網頁內容可能與最新版本有所差異。詳細情況請與我們聯繫。
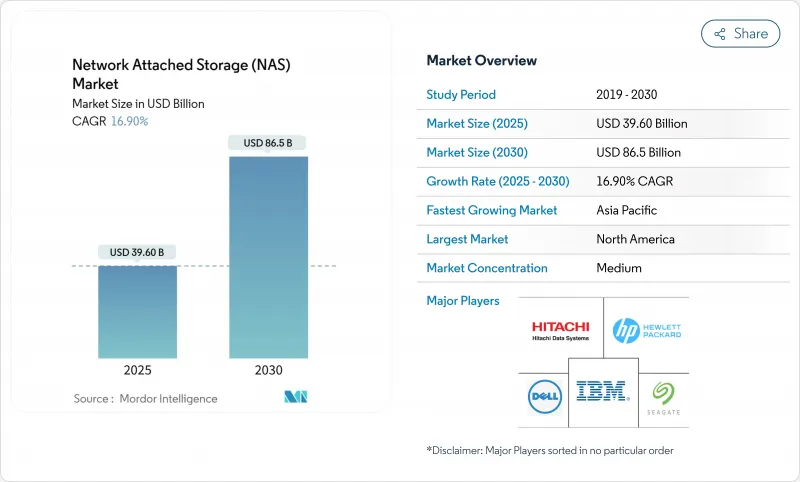
預計 2025 年網路附加儲存市場價值將達到 396 億美元,到 2030 年預計將達到 865 億美元,預測期內(2025-2030 年)的複合年成長率為 16.90%。
推動需求成長的因素包括:企業希望控制非結構化資料的成長,混合勞動力的推動,以及需要高吞吐量檔案服務的人工智慧/機器學習工作負載的增加。此外,供應商也受益於人們對5G邊緣站點附近本地解決方案的重新關注,在這些站點,對延遲敏感的應用程式更靠近用戶運行。到2024年,北美仍將是收益領先地區,但亞太地區在大規模資料中心建置和數位轉型加速的推動下,其成長速度正在加快。競爭格局正向軟體定義、人工智慧最佳化和混合雲傾斜,將本地效能與雲端經濟性結合。
全球網路附加儲存 (NAS) 市場趨勢與洞察
非結構化資料爆炸性成長
隨著企業資料量每年以超過 20% 的速度成長,IT 團隊正在重新思考儲存彈性。許多公司已轉向橫向擴展 NAS,這種技術允許逐節點擴展而無需停機,同時應用自動分層來平衡成本和效能。醫療保健提供者就是這種轉變的典型代表,他們歸檔越來越大的映像文件,同時依靠策略驅動的放置來控制成本。
遠距和混合工作數據激增
混合辦公模式已使邊緣辦公室和家庭網路成為主要的資料建立地點。企業紛紛部署 NAS 設備,這些設備能夠提供全域命名空間,並透過 WAN 快取加速流量。許多團隊透過將冷數據放置在雲層,並將活動計劃文件放置在可自動同步的高級設備上,從而降低了分支機構基礎設施成本,且不會影響用戶體驗。
雲端儲存替代方案
基於消費的雲端儲存持續拉低了對純本地 NAS 的需求,吸引了那些偏好營運支出模式和彈性擴展的組織。供應商透過整合雲端分層、簡介複製到物件儲存桶以及模糊傳統資本支出界限的訂閱定價來降低風險,在保持設備相關性的同時,實現了雲端的吸引力。
細分分析
到2024年,橫向擴展陣列將佔據網路附加儲存市場佔有率的52%。這種架構使管理員能夠線性提升效能和容量,無需進行全面升級,並支援在數月內規模翻倍的資料集。因此,預計該細分市場在2025年至2030年間的複合年成長率將達到18%。相較之下,縱向擴展設備在小型團隊中仍然很受歡迎,他們更注重簡潔性而非彈性擴展。 IBM SONAS 透過在單一命名空間中管理數十億個文件,並透過自動分層功能將擁有成本降低高達40%,展現了橫向擴展的高效性。
由於較低的初始定價和易於管理的特性,橫向擴展產品持續向部門級和小型企業供貨。然而,媒體後製和基因組學公司等需要高並發吞吐量的工作負載則傾向於叢集設計。在預測期內,NVMe-oF 和 400GbE 網路等硬體技術的進步預計將為橫向擴展細分市場注入新的動力,鞏固其在更廣泛的網路附加儲存市場中的核心地位。
雖然到2024年,本地配置仍將佔總收入的52%,但企業擴大將本地陣列與按需雲端容量混合使用。混合層預計將以21.1%的複合年成長率成長,成為網路附加儲存市場中成長最快的。企業將合規性關鍵資料集保留在本地,同時將非活動檔案重新導向到雲端儲存桶。戴爾的非結構化資訊服務支援此模式,可在環境之間無縫移動簡介。
隨著企業被要求縮小資料中心空間並採用雲端優先策略,純雲端 NAS 也得到了發展。供應商的應對措施包括:優先考慮跨端點策略管理的單一儀表板、預設靜態加密以及用於 DevOps 自動化的 API 掛鉤。隨著時間的推移,跨地區和跨供應商的多重雲端文件服務有望拉平成本差異,增強混合架構的整體吸引力,並鞏固其在網路附加儲存 (NAS) 市場中的地位。
區域分析
在深度雲端連接、超大規模買家集中以及成熟通路生態系統的推動下,北美地區將在2024年佔據39%的收入佔有率。美國公司持續更新其文件平台,以支援人工智慧推理並滿足日益成長的網路保險需求。加拿大和墨西哥在金融、政府和製造業領域均實現了升級,鞏固了該地區在網路附加儲存市場的主導地位。
亞太地區成長速度最快,2025年至2030年的複合年成長率達18%。中國的數位基礎設施獎勵策略、印度的5G部署以及日本對邊緣製造機器人的投資,推動了容量部署的成長。本土ODM廠商提供價格極具競爭力的全快閃設備,為國內企業提供了超越外國現有廠商的替代方案。數位化成熟度的提升,加上雄心勃勃的資料中心建設,將使亞太地區在未來網路附加儲存市場中佔有一席之地。
歐洲繼續佔據關鍵地位,這得益於GDPR合規支出以及汽車和製藥行業的邊緣運算。中東和非洲在智慧城市和油田遙測計劃中率先採用了邊緣運算,而隨著寬頻品質和數據主權框架的成熟,拉丁美洲則呈現較為溫和的上升趨勢。所有地區的通用是加強了對資料駐留的審查,這進一步驗證了網路附加儲存市場中混合和邊緣運算的部署策略。
其他福利:
- Excel 格式的市場預測 (ME) 表
- 3個月的分析師支持
目錄
第1章 引言
- 研究假設和市場定義
- 調查範圍
第2章調查方法
第3章執行摘要
第4章 市場狀況
- 市場概況
- 市場促進因素
- 非結構化資料爆炸性成長
- 遠距和混合勞動力數據激增
- 資料中心虛擬化與 SD-NAS
- 5G邊緣建設增強本地NAS
- AI/ML 訓練工作負載需要並行文件訪問
- 關稅迫使NAS生產回流日本
- 市場限制
- 雲端儲存替代方案
- Petabyte級性能瓶頸
- 數據爆炸式成長導致 TCO 上升
- 本地檔案系統網路保險費不斷上漲
- 監管格局
- 技術展望
- 波特五力模型
- 供應商的議價能力
- 買家/消費者的議價能力
- 新進入者的威脅
- 替代品的威脅
- 競爭對手之間的競爭
第5章市場規模及成長預測
- 按類型
- 擴大規模
- 橫向擴展
- 按最終用戶產業
- BFSI
- 資訊科技和通訊
- 衛生保健
- 零售與電子商務
- 媒體和娛樂
- 政府和公共部門
- 其他(教育、製造業)
- 按部署
- 本地部署
- 雲
- 混合
- 按產品層次
- 高階/企業
- 中端市場
- 低階/SOHO
- 按地區
- 北美洲
- 美國
- 加拿大
- 墨西哥
- 歐洲
- 英國
- 德國
- 法國
- 義大利
- 其他歐洲地區
- 亞太地區
- 中國
- 日本
- 印度
- 韓國
- 亞洲其他地區
- 中東
- 以色列
- 沙烏地阿拉伯
- 阿拉伯聯合大公國
- 土耳其
- 其他中東地區
- 非洲
- 南非
- 埃及
- 其他非洲國家
- 南美洲
- 巴西
- 阿根廷
- 其他南美
- 北美洲
第6章 競爭態勢
- 市場集中度
- 策略趨勢
- 市佔率分析
- 公司簡介
- Dell Technologies
- NetApp Inc.
- Synology Inc.
- QNAP Systems Inc.
- Hewlett Packard Enterprise
- Western Digital Corp.
- Seagate Technology PLC
- IBM Corporation
- Hitachi Vantara
- Cisco Systems Inc.
- Huawei Technologies Co. Ltd.
- Lenovo Group Ltd.
- Supermicro Computer Inc.
- Buffalo Inc.
- Zyxel Communications Corp.
- Asustor Inc.
- TerraMaster
- Thecus Technology Corp.
- Drobo Inc.
- Promise Technology
- Infortrend Technology Inc.
- Netgear Inc.
- HGST(WD subsidiary)
- TrueNAS(iXsystems)
- Fujitsu Ltd.
- NEC Corp.
第7章 市場機會與未來展望
The Network Attached Storage Market size is estimated at USD 39.60 billion in 2025, and is expected to reach USD 86.5 billion by 2030, at a CAGR of 16.90% during the forecast period (2025-2030).
Demand has been buoyed by enterprises racing to contain unstructured-data growth, the push for hybrid work, and the capture of AI/ML workloads that need high-throughput file services. Vendors also benefited from renewed interest in on-premises solutions near 5G edge sites, where latency-sensitive applications run close to users. North America remained the revenue leader as of 2024, yet Asia-Pacific is setting the growth pace on the back of sizeable data-center build-outs and accelerated digital transformation. Competitive dynamics are tilting toward software-defined, AI-optimized, and hybrid-cloud offerings that blend local performance with cloud economics.
Global Network Attached Storage (NAS) Market Trends and Insights
Explosion of Unstructured Data
Annual enterprise data volume expanded at rates that routinely exceeded 20%, forcing IT teams to rethink storage elasticity. Many migrated toward scale-out NAS that scales node-by-node without downtime, while applying automated tiering to balance cost and performance. Healthcare providers typified this shift, archiving ever-larger imaging files while relying on policy-driven placement to curb spending.
Remote and Hybrid-Work Data Surge
Hybrid work turned edge offices and home networks into primary data creators. Enterprises responded by rolling out NAS appliances that expose a global namespace and accelerate traffic with WAN caching. Many teams placed cold data in cloud tiers while keeping active project files on-prem devices that synchronize automatically, reducing branch infrastructure cost without impacting user experience.
Cloud-Storage Substitution
Consumption-based cloud storage kept eroding demand for purely on-prem NAS, attracting organizations that preferred opex models and elastic scaling. Vendors mitigated the risk by embedding cloud tiering, snapshot replication to object buckets, and subscription pricing that blurs traditional capex boundaries, preserving appliance relevance while acknowledging the cloud's pull.
Other drivers and restraints analyzed in the detailed report include:
- Data-Center Virtualization and SD-NAS
- 5G Edge Build-Out Boosts On-Prem NAS
- Performance Bottlenecks at Petabyte Scale
For complete list of drivers and restraints, kindly check the Table Of Contents.
Segment Analysis
Scale-out arrays held 52% of the network-attached storage market share in 2024. The architecture allowed administrators to add performance and capacity linearly, removing forklift upgrades and supporting data sets that were doubling in months. As a result, the segment is forecast to log an 18% CAGR from 2025-2030. In contrast, scale-up appliances stayed popular with smaller teams that favored simplicity over elastic scaling. IBM SONAS demonstrated scale-out efficiency by managing billions of files under a single namespace while driving ownership costs down by up to 40% through automated tiering.
Scale-up products continued to ship into departmental and SMB settings, helped by lower initial list prices and straightforward administration. Yet once workloads required high concurrent throughput, typical in media post-production or genomic analysis enterprises, gravitated to clustered designs. Over the forecast period, incremental hardware advances such as NVMe-oF and 400 GbE networking are expected to add momentum to the scale-out segment, reinforcing its position at the heart of the broader network-attached storage market.
On-premise configurations still commanded 52% of 2024 revenue, yet enterprises increasingly blended local arrays with on-demand cloud capacity. The hybrid tier is projected to notch a 21.1% CAGR, the fastest within the network-attached storage market. Organizations retained compliance-sensitive datasets onsite while redirecting inactive files to cloud buckets, a model supported by Dell's unstructured-data services that move snapshots seamlessly between environments.
Pure-cloud NAS grew too, propelled by corporate mandates to shrink data-center footprints and adopt cloud-first strategies. Vendors accordingly prioritized single dashboards for policy management across endpoints, default encryption at rest, and API hooks for DevOps automation. Over time, multi-cloud file services that span regions and providers are expected to flatten cost differentials and strengthen the overall pull toward hybrid architectures, cementing their role in the network-attached storage market size dialogue.
Network Attached Storage (NAS) Market Report is Segmented by Type (Scale-Up, Scale-Out), End-User Industry (BFSI, IT and Telecom, and More), Deployment (On-Premise, Cloud, and Hybrid), Product Tier (High-end/Enterprise, Mid-Market, Low-end/SOHO), and Geography. The Market Forecasts are Provided in Terms of Value (USD).
Geography Analysis
North America held 39% of 2024 revenue owing to deep cloud connectivity, a concentration of hyperscale buyers, and a mature channel ecosystem. United States enterprises continued to refresh file platforms to support AI inference as well as to satisfy rising cyber-insurance requirements. Canada and Mexico made progress in finance, government, and manufacturing upgrades, reinforcing the region's heavyweight status within the network attached storage market.
Asia-Pacific registered the quickest trajectory, clocking an expected 18% CAGR for 2025-2030. China's stimulus for digital infrastructure, India's 5G rollout, and Japan's investment in edge manufacturing robotics amplified capacity deployments. Local ODMs offered price-competitive all-flash gear, giving domestic firms alternatives to foreign incumbents. The combination of rising digital maturity and ambitious data-center construction positions Asia-Pacific to lift its slice of future network attached storage market share.
Europe remained significant, helped by GDPR-driven compliance spending and edge computing in automotive and pharmaceutical corridors. The Middle East and Africa saw early adoption in smart-city and oil-field telemetry projects, while Latin America trended upward more gradually as broadband quality and data-sovereignty frameworks matured. Across all regions, the common denominator was heightened scrutiny of data residency, further validating hybrid and edge-heavy deployment strategies sewn into the network attached storage market.
- Dell Technologies
- NetApp Inc.
- Synology Inc.
- QNAP Systems Inc.
- Hewlett Packard Enterprise
- Western Digital Corp.
- Seagate Technology PLC
- IBM Corporation
- Hitachi Vantara
- Cisco Systems Inc.
- Huawei Technologies Co. Ltd.
- Lenovo Group Ltd.
- Supermicro Computer Inc.
- Buffalo Inc.
- Zyxel Communications Corp.
- Asustor Inc.
- TerraMaster
- Thecus Technology Corp.
- Drobo Inc.
- Promise Technology
- Infortrend Technology Inc.
- Netgear Inc.
- HGST (WD subsidiary)
- TrueNAS (iXsystems)
- Fujitsu Ltd.
- NEC Corp.
Additional Benefits:
- The market estimate (ME) sheet in Excel format
- 3 months of analyst support
TABLE OF CONTENTS
1 INTRODUCTION
- 1.1 Study Assumptions and Market Definition
- 1.2 Scope of the Study
2 RESEARCH METHODOLOGY
3 EXECUTIVE SUMMARY
4 MARKET LANDSCAPE
- 4.1 Market Overview
- 4.2 Market Drivers
- 4.2.1 Explosion of unstructured data
- 4.2.2 Remote and hybrid-work data surge
- 4.2.3 Data-center virtualization and SD-NAS
- 4.2.4 5G edge build-out boosts on-prem NAS
- 4.2.5 AI/ML training workloads need parallel file access
- 4.2.6 Tariff-driven reshoring of NAS production
- 4.3 Market Restraints
- 4.3.1 Cloud-storage substitution
- 4.3.2 Performance bottlenecks at petabyte scale
- 4.3.3 High TCO with explosive data growth
- 4.3.4 Rising cyber-insurance premiums for on-prem file systems
- 4.4 Regulatory Landscape
- 4.5 Technological Outlook
- 4.6 Porter's Five Forces
- 4.6.1 Bargaining Power of Suppliers
- 4.6.2 Bargaining Power of Buyers/Consumers
- 4.6.3 Threat of New Entrants
- 4.6.4 Threat of Substitutes
- 4.6.5 Intensity of Competitive Rivalry
5 MARKET SIZE AND GROWTH FORECASTS (VALUE)
- 5.1 By Type
- 5.1.1 Scale-up
- 5.1.2 Scale-out
- 5.2 By End-user Industry
- 5.2.1 BFSI
- 5.2.2 IT and Telecom
- 5.2.3 Healthcare
- 5.2.4 Retail and E-commerce
- 5.2.5 Media and Entertainment
- 5.2.6 Government and Public Sector
- 5.2.7 Others (Education, Manufacturing)
- 5.3 By Deployment
- 5.3.1 On-premise
- 5.3.2 Cloud
- 5.3.3 Hybrid
- 5.4 By Product Tier
- 5.4.1 High-end / Enterprise
- 5.4.2 Mid-market
- 5.4.3 Low-end / SOHO
- 5.5 By Geography
- 5.5.1 North America
- 5.5.1.1 United States
- 5.5.1.2 Canada
- 5.5.1.3 Mexico
- 5.5.2 Europe
- 5.5.2.1 United Kingdom
- 5.5.2.2 Germany
- 5.5.2.3 France
- 5.5.2.4 Italy
- 5.5.2.5 Rest of Europe
- 5.5.3 Asia-Pacific
- 5.5.3.1 China
- 5.5.3.2 Japan
- 5.5.3.3 India
- 5.5.3.4 South Korea
- 5.5.3.5 Rest of Asia
- 5.5.4 Middle East
- 5.5.4.1 Israel
- 5.5.4.2 Saudi Arabia
- 5.5.4.3 United Arab Emirates
- 5.5.4.4 Turkey
- 5.5.4.5 Rest of Middle East
- 5.5.5 Africa
- 5.5.5.1 South Africa
- 5.5.5.2 Egypt
- 5.5.5.3 Rest of Africa
- 5.5.6 South America
- 5.5.6.1 Brazil
- 5.5.6.2 Argentina
- 5.5.6.3 Rest of South America
- 5.5.1 North America
6 COMPETITIVE LANDSCAPE
- 6.1 Market Concentration
- 6.2 Strategic Moves
- 6.3 Market Share Analysis
- 6.4 Company Profiles (includes Global level Overview, Market level overview, Core Segments, Financials as available, Strategic Information, Market Rank/Share for key companies, Products and Services, and Recent Developments)
- 6.4.1 Dell Technologies
- 6.4.2 NetApp Inc.
- 6.4.3 Synology Inc.
- 6.4.4 QNAP Systems Inc.
- 6.4.5 Hewlett Packard Enterprise
- 6.4.6 Western Digital Corp.
- 6.4.7 Seagate Technology PLC
- 6.4.8 IBM Corporation
- 6.4.9 Hitachi Vantara
- 6.4.10 Cisco Systems Inc.
- 6.4.11 Huawei Technologies Co. Ltd.
- 6.4.12 Lenovo Group Ltd.
- 6.4.13 Supermicro Computer Inc.
- 6.4.14 Buffalo Inc.
- 6.4.15 Zyxel Communications Corp.
- 6.4.16 Asustor Inc.
- 6.4.17 TerraMaster
- 6.4.18 Thecus Technology Corp.
- 6.4.19 Drobo Inc.
- 6.4.20 Promise Technology
- 6.4.21 Infortrend Technology Inc.
- 6.4.22 Netgear Inc.
- 6.4.23 HGST (WD subsidiary)
- 6.4.24 TrueNAS (iXsystems)
- 6.4.25 Fujitsu Ltd.
- 6.4.26 NEC Corp.
7 MARKET OPPORTUNITIES AND FUTURE OUTLOOK
- 7.1 White-space and Unmet-Need Assessment
 網路附加儲存 (NAS) 市場:按組件、設備類型、部署模式、組織規模、應用和行業分類——2026-2032 年全球市場預測
 2026年全球雲端網路附加儲存(NAS)閘道器市場報告2026年全球網路附加儲存市場報告
 網路附加儲存 (NAS) 市場分析及至 2035 年預測:按類型、產品類型、服務、技術、組件、應用、部署類型、最終用戶、功能和解決方案分類
 2026-2030年全球網路附加儲存(NAS)市場NAS網路儲存伺服器市場:2026-2032年全球預測(按部署類型、硬碟位元數量、硬碟類型、連接方式、儲存容量、垂直產業和企業規模分類)
 網路附加儲存 (NAS) 市場規模、佔有率、成長及全球產業分析:按類型、應用和地區劃分的洞察與預測 (2026-2034)
 網路附加儲存 (NAS) 市場規模、佔有率和成長分析(按儲存解決方案、產品、垂直產業和地區分類)- 產業預測 (2026-2033)
 網路附加儲存市場:按儲存解決方案、組織規模、垂直產業和地區分類
 全球 NAS 市場:依設計、產品類別、儲存解決方案、部署方式、最終用戶、地區、產業趨勢和預測