


 |
市場調查報告書
商品編碼
1850138
賭場管理系統:市場佔有率分析、行業趨勢、統計數據和成長預測(2025-2030 年)Casino Management Systems - Market Share Analysis, Industry Trends & Statistics, Growth Forecasts (2025 - 2030) |
||||||
※ 本網頁內容可能與最新版本有所差異。詳細情況請與我們聯繫。
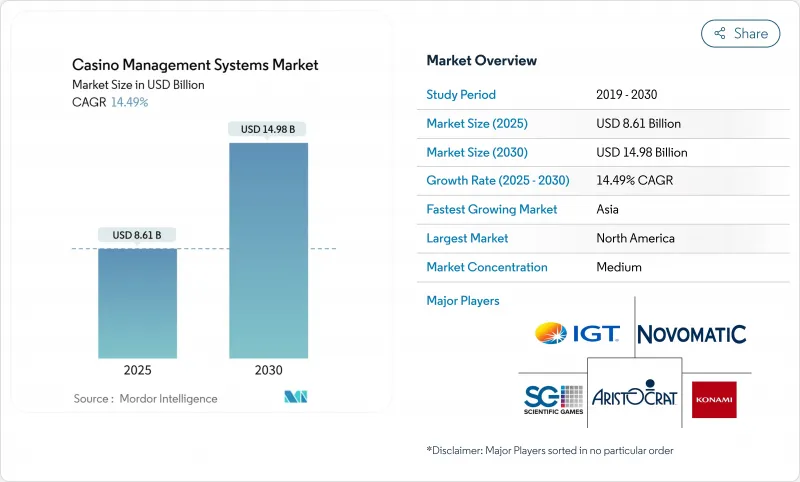
預計 2024 年賭場管理系統市場價值將達到 75.7 億美元,到 2030 年預計將達到 169.4 億美元,2025 年至 2030 年的複合年成長率為 14.49%。
隨著營運商從交易監控轉向數據主導的決策、預測分析和無現金營運,需求加速成長。亞太地區綜合度假村的擴張、美國體育博彩的成長以及洗錢防制法規是關鍵的成長動力,而持續的勞動力短缺和網路攻擊風險正在抑製成長勢頭。雲端運算的採用正在改變部落和小型場所的成本結構,使它們無需高昂的資本支出即可獲得企業級功能。同時,隨著供應商競相將人工智慧融入玩家追蹤、安全和行銷工作流程,以分析為中心的模組正在重塑競爭定位。
全球賭場管理系統市場趨勢與洞察
亞洲各地綜合度假村建設進展迅速
亞洲綜合度假村的快速建設,以及旨在將博彩、酒店和零售業務整合到單一資料層的新項目,正在加速對端到端賭場管理系統的需求。 2024年7月,銀河娛樂推出了一款智慧賭桌,可將即時投注數據傳輸到分析引擎,這充分展現了這些新度假村必須管理的數據規模。新濠博亞娛樂將類似的技術與永續性儀表板結合,將能源使用與賓客行為聯繫起來,突顯了其現代化平台如何在收益最佳化與環境目標之間取得平衡。此外,隨著業務擴展到菲律賓、日本和阿拉伯聯合大公國,多物業營運商正在尋求跨司法管轄區的合規工具。這些需求推動了更高價值的合約簽訂,這些合約捆綁了會計、玩家追蹤、酒店和零售模組。擁有預先整合區域合規庫的供應商將獲得先發優勢,預計將推動該地區賭場管理系統市場持續實現兩位數成長。
強制性無現金/TITO法規
澳洲2024年的改革強制要求使用銀行卡並設定1000澳元現金限額,這迫使昆士蘭州所有機構升級其支付、追蹤和反洗錢能力。內華達州逐步推動無現金支付,反映了監管和消費者壓力不斷匯聚的趨勢。 Everi和Crane Payment Innovations等供應商正在推出可改裝到現有基礎設施中的錢包整合服務,因此無需徹底維修即可逐步採用。合規期限縮小了決策窗口,推動了賭場管理系統市場的短期支出激增。長期的銀行卡交易歷史為忠誠度和負責任博彩演算法提供了豐富的資料集,加強了對分析的策略重點。
備受矚目的網路攻擊
2024年,米高梅度假村和凱撒娛樂遭遇網路攻擊,數百萬客戶記錄被洩露,促使整個行業重新評估安全通訊協定。由於董事會要求更高的滲透測試門檻,勒索軟體保險費的上漲和法律責任風險正在推遲採購決策。雖然供應商目前正在整合臉部辨識和行為分析技術來即時識別詐欺活動,但更嚴格的存取控制策略可能會使使用者工作流程更加複雜。由於銷售週期延長和安全成本的上升超過了內容管理系統(CMS)的升級,整體影響可能是短期成長的下行壓力。
細分分析
到 2024 年,軟體將佔據賭場管理系統市場的 70%,這反映了其在會計、玩家追蹤和法規遵循方面的作用。大型營運商青睞功能豐富的套件,例如 IGT ADVANTAGE,它捆綁了核心籠、老虎機和行銷模組。美國和澳洲的監管審核要求每日匯出會計數據,這強調了軟體的重要性。然而,隨著機構尋求客製化整合、分析調整和全天候託管支持,服務收入成長更快,複合年成長率達到 18.7%。臉部認證、無現金錢包和體育博彩數據饋送的加入增加了系統複雜性,推動了對專業服務的需求。包括服務在內的賭場管理系統市場預計將從 2024 年的 22.7 億美元擴大到 2030 年的 63.6 億美元。
嵌入供應商生態系統的顧問公司如今會指導場館進行分階段部署,以最大程度地減少停機時間。一個值得注意的例子是 eConnect 和 Table Trac 在德克薩斯州州一家美洲原住民賭場的聯合部署,該整合服務將臉部辨識與即時賭區資料結合。隨著 CMS 平台逐漸演變為戰略情報中心而非後勤部門實用程序,定期服務合約為供應商提供了穩定的年金收入,並加劇了認證實施合作夥伴之間的競爭。
到2024年,本地部署系統的佔有率將達到82%,因為許多監管機構仍然要求遊戲資料在本地存儲,並在網路中斷期間保持持續可用性。高可用性叢集和專用光纖鏈路有助於降低停機風險,但資本和人事費用仍然很高。目前,雲端採用率僅18%,但隨著供應商加強加密、提供區域資料中心並獲得監管部門的核准,其複合年成長率將達到22.4%。受雲端採用推動的賭場管理系統市場規模預計到2030年將達到48.8億美元。
部落和小型商業場所正在蓬勃發展,因為它們無需搭建昂貴的伺服器機房即可獲得企業級功能。 IGT 聲稱,其補充雲層可在五年內將總擁有成本降低 30%,其彈性處理能力可在離峰時段降低能源成本。新澤西州和昆士蘭州的監管機構已發布指導意見,承認在交易日誌不可篡改的情況下,雲端技術是可接受的選擇。隨著安全認證的廣泛應用,中端區域營運商正開始轉型,這標誌著整個賭場管理系統市場部署組合的轉捩點。
賭場管理系統市場細分:按組件(軟體、服務)、按部署類型(本地部署、雲端基礎)、按用途(會計與監控、保全與監控、酒店與度假村管理、分析與報告、其他)、按最終用戶(中小型賭場、大型賭場)以及按地區。市場預測以貨幣單位(美元)提供。
區域分析
2024年,北美將貢獻38%的賭場管理系統市場收益。美國體育博彩的擴張將推動支出成長,而加拿大安大略省市場的需求也將增加。部落賭場將採用雲端平台來彌補IT方面的差距,並整合臉部認證以確保安全。 2025年1月,伊利諾州、田納西州和新澤西州將推出23項新法規,迫使業者升級其報告和自我隔離介面。由於雲端技術應用的加速和跨通路忠誠度的提升,區域成長率將超過全球平均。
亞太地區是成長最快的地區,複合年成長率達18.1%。澳門和菲律賓的智慧賭桌能夠捕捉到精細的博彩數據,而澳洲的「了解你的客戶」規則正在加速無現金支付的普及。日本首個綜合度假村的落成以及印度潛在的監管改革,可能在2020年下半年釋放巨大的需求潛力。儘管澳門面臨資金限制,但亞太其他地區正在建造配備人工智慧基礎設施的待開發區度假村,這將推動亞太賭場管理系統市場規模到2030年突破40億美元。
歐洲市場正受到嚴格的反洗錢指令和負責任博彩標準的塑造。歐盟第六號指令已觸發能夠偵測實際所有權風險的分析模組的升級。英國引入了新的技術標準,限制自動播放並加快旋轉速率披露,強制內容合規性更新。拉丁美洲是一個新興的熱點。巴西將於2025年1月1日開始對iGaming進行監管,預計將推動供應商在地化,以適應葡萄牙語介面和當地稅收要求。中東和非洲仍在發展中,但受到阿拉伯聯合大公國和沙烏地阿拉伯旅遊主導計劃的支持,一旦立法允許,這些計畫可能會採用度假村規模的CMS套件。
其他福利:
- Excel 格式的市場預測 (ME) 表
- 3個月的分析師支持
目錄
第1章 引言
- 研究假設和市場定義
- 調查範圍
第2章調查方法
第3章執行摘要
第4章 市場狀況
- 市場概況
- 市場促進因素
- 亞洲各地綜合度假村的快速建造推動了CMS的採用
- 澳洲和內華達州強制實施無現金/TITO 法規
- 美國體育博彩合法化促使忠誠度系統升級
- Tribal Casino 實施雲端基礎的CMS 來填補 IT 短缺
- 歐盟第六項反洗錢指令加速了分析模組的需求
- 礦井作業勞動力短缺推動自動化模組的採用
- 市場限制
- 備受矚目的網路攻擊增加了企業責任
- 澳門特許經營經營資本支出凍結導致CMS新契約延期
- GDPR 等嚴格的資料隱私規則限制了玩家追蹤的深度
- 由於網路和手機遊戲,實體店客流量下降
- 監理展望
- 波特五力分析
- 供應商的議價能力
- 買方的議價能力
- 新進入者的威脅
- 替代品的威脅
- 競爭對手之間的競爭
- 投資分析
第5章市場規模與成長預測(價值)
- 按組件
- 軟體
- 服務
- 依部署方式
- 本地部署
- 雲端基礎
- 依目的
- 會計和籠子管理
- 安全與監控
- 酒店和度假村管理
- 分析和報告
- 玩家追蹤和忠誠度
- 媒體管理與數位電子看板
- 行銷與推廣
- 按最終用戶
- 中小型賭場
- 大型賭場
- 按地區
- 北美洲
- 美國
- 加拿大
- 南美洲
- 巴西
- 阿根廷
- 墨西哥
- 其他南美
- 歐洲
- 德國
- 英國
- 法國
- 義大利
- 西班牙
- 其他歐洲地區
- 亞太地區
- 中國
- 日本
- 韓國
- 印度
- 澳洲
- 紐西蘭
- 其他亞太地區
- 中東和非洲
- 中東
- 阿拉伯聯合大公國
- 沙烏地阿拉伯
- 土耳其
- 其他中東地區
- 非洲
- 南非
- 奈及利亞
- 肯亞
- 其他非洲國家
- 北美洲
第6章 競爭態勢
- Strategic Developments
- Vendor Positioning Analysis
- 公司簡介
- International Game Technology PLC
- Aristocrat Leisure Ltd.
- Novomatic AG
- Scientific Games Corp.(Light & Wonder)
- Konami Gaming Inc.
- Bally Technologies Inc.
- Winsystems Inc.
- TCS John Huxley
- Agilysys Inc.
- Oracle Hospitality
- Everi Holdings Inc.
- Table Trac Inc.
- DJOY Group Ltd.
- Amatic Industries GmbH
- Bluberi Gaming Technologies Inc.
- Apex Gaming Technology
- Decart Ltd.
- TransAct Technologies Inc.
- Genesis Gaming Solutions Inc.
- Syswin Solutions
- CasinoTrac
- Tangam Systems Inc.
- Axes.ai
- Advansys doo
- BetConstruct
- CT Gaming
- QUONTRA Solutions
第7章 市場機會與未來展望
The casino management system market is valued at USD 7.57 billion in 2024 and is forecast to reach USD 16.94 billion by 2030, advancing at a 14.49% CAGR from 2025 to 2030.
Demand accelerates as operators move from transactional oversight toward data-driven decision making, predictive analytics, and cashless operations. Asia-Pacific integrated-resort expansion, expanding U.S. sports wagering, and stricter anti-money-laundering rules are key growth catalysts, while persistent labor shortages and cyber-breach risks temper momentum. Cloud deployment is transforming cost structures for tribal and small properties, allowing them to access enterprise-grade capabilities without high capital outlays. Meanwhile, analytics-centric modules are reshaping competitive positioning as vendors race to embed artificial intelligence into player tracking, security, and marketing workflows.
Global Casino Management Systems Market Trends and Insights
Rapid Integrated-Resort Builds Across Asia
Asia's pipeline of integrated resorts is accelerating demand for end-to-end casino management systems as new properties aim to unify gaming, hospitality, and retail operations under a single data layer. July 2024 saw Galaxy Entertainment deploy smart tables that stream real-time wagering data to analytics engines, showcasing the scale of data that new venues must manage. Melco Resorts has paired similar technology with sustainability dashboards that tie energy use to guest behaviour, highlighting how modern platforms now balance revenue optimisation with environmental targets. Multi-property operators also seek cross-jurisdiction compliance tools as expansions reach the Philippines, Japan, and the United Arab Emirates. These requirements are propelling higher-value contracts that bundle accounting, player-tracking, hotel, and retail modules. Vendors able to pre-integrate regional compliance libraries are gaining early-mover advantage, positioning the casino management system market for sustained double-digit growth in the region.
Mandatory Cashless / TITO Regulations
Australia's 2024 reforms mandate carded play and sub-AUD 1,000 cash limits, forcing every property in Queensland to upgrade payment, tracking, and AML capabilities. Nevada's gradual push toward cashless floors mirrors this trajectory, converging regulatory and consumer pressure. Vendors such as Everi and Crane Payment Innovations respond with wallet integrations that retrofit into existing infrastructures, allowing gradual adoption without full rip-and-replace projects. Compliance deadlines compress decision windows, driving near-term spending spikes within the casino management system market. Long-term, card-based transaction histories supply richer datasets for loyalty and responsible-gaming algorithms, reinforcing the strategic pivot toward analytics.
High-Profile Cyber-breaches
The 2024 attacks on MGM Resorts and Caesars exposed millions of patron records, prompting industry-wide reassessment of security protocols. Rising ransomware premiums and liability risks delay procurement decisions as boards demand higher penetration-test thresholds. Vendors now integrate facial recognition and behavioural analytics to identify fraud in real time, but tighter access control policies can complicate user workflows. The overall effect is longer sales cycles and incremental security spend that can crowd out broader CMS upgrades, applying downward pressure on near-term growth.
Other drivers and restraints analyzed in the detailed report include:
- U.S. Sports-Betting Legalisation
- Cloud-based CMS Adoption by Tribal Casinos
- Macau Concession CapEx Freeze
For complete list of drivers and restraints, kindly check the Table Of Contents.
Segment Analysis
Software accounted for 70% of the casino management system market in 2024, reflecting its role in accounting, player tracking, and regulatory compliance. Large operators favour feature-rich suites such as IGT ADVANTAGE that bundle core cage, slot, and marketing modules. Regulatory audits in the United States and Australia require daily accounting exports, reinforcing software's criticality. However, services revenue is rising faster, growing at an 18.7% CAGR as properties seek custom integrations, analytics tuning, and 24x7 managed support. System complexity has increased with the addition of facial recognition, cashless wallets, and sports-book data feeds, boosting demand for professional services. The casino management system market size linked to services is projected to expand from USD 2.27 billion in 2024 to USD 6.36 billion in 2030.
Consulting firms embedded within vendor ecosystems now guide properties through staged deployments that minimise downtime. A notable example is the joint implementation by eConnect and Table Trac at a Native American casino in Texas, where integration services united facial recognition with real-time pit data. As CMS platforms evolve into strategic intelligence hubs rather than back-office utilities, recurring service contracts give vendors stable annuity streams, intensifying competition for certified implementation partners.
On-premise systems commanded an 82% share in 2024 because many regulators still require local storage of wagering data and continuous availability during network outages. High-availability clusters and dedicated fiber links help mitigate downtime risk, yet capital and staffing costs remain high. Cloud deployments, while only 18% today, are scaling at 22.4% CAGR as vendors strengthen encryption, offer region-specific data centres, and secure regulatory approvals. The casino management system market size attached to cloud installations is expected to reach USD 4.88 billion by 2030.
Tribal and small commercial properties drive momentum because they gain enterprise-grade functionality without building costly server rooms. IGT pitches a 30% total cost of ownership reduction over five years for its supplemental cloud layer, citing elastic processing that lowers energy costs during off-peak periods. Regulators in New Jersey and Queensland have issued guidance that recognises cloud as an acceptable option when transactional logs remain immutable. As security certifications proliferate, mid-tier regional operators are beginning phased migrations, signalling a tipping point in the deployment mix across the casino management system market.
Casino Management Systems Market Segmented by Component (Software, Services), Deployment Mode (On-Premise, Cloud-Based), Purpose (Accounting and Cage Operations, Security and Surveillance, Hotel and Resort Management, Analytics and Reporting, and More), End-User (Small and Medium Casinos, Large Casinos), Geography. The Market Forecasts are Provided in Terms of Value (USD).
Geography Analysis
North America generated 38% of the casino management system market revenue in 2024. The United States drives spend with expanding sports betting, while Canada's Ontario market adds incremental demand. Tribal casinos deploy cloud platforms to mitigate IT gaps and integrate facial recognition for security, exemplified by the Texas installation linking CasinoTrac data with eConnect biometrics. Compliance calendars remain active; January 2025 imposes 23 new mandates across Illinois, Tennessee, and New Jersey, pushing operators to upgrade reporting and self-exclusion interfaces. Accelerated cloud adoption and cross-channel loyalty upgrades keep regional growth above the global average.
Asia-Pacific is the fastest-growing territory, posting an 18.1% CAGR. Smart tables in Macau and the Philippines capture granular wagering data, while Australia's identity-verification rules accelerate cashless adoption. Japan's first integrated resort and India's potential regulatory reforms could unlock significant latent demand later in the decade. Despite capital constraints in Macau, properties elsewhere in the region are building greenfield resorts with AI-ready infrastructure, helping the casino management system market size in Asia-Pacific surpass USD 4 billion by 2030.
Europe's market is shaped by stringent AML directives and responsible-gaming standards. The EU 6th directive has triggered upgrades to analytics modules capable of detecting beneficial-ownership risks. The UK introduced new technical standards that limit autoplay and speed up spin-rate disclosures, forcing content compliance updates. Latin America is an emerging hotspot; Brazil began regulated iGaming on January 1 2025 and is expected to drive vendor localisation efforts for Portuguese interfaces and local tax requirements. The Middle East and Africa remain nascent but are underpinned by tourism-led projects in the UAE and Saudi Arabia that could adopt resort-scale CMS suites once legislation permits.
- International Game Technology PLC
- Aristocrat Leisure Ltd.
- Novomatic AG
- Scientific Games Corp. (Light & Wonder)
- Konami Gaming Inc.
- Bally Technologies Inc.
- Winsystems Inc.
- TCS John Huxley
- Agilysys Inc.
- Oracle Hospitality
- Everi Holdings Inc.
- Table Trac Inc.
- DJOY Group Ltd.
- Amatic Industries GmbH
- Bluberi Gaming Technologies Inc.
- Apex Gaming Technology
- Decart Ltd.
- TransAct Technologies Inc.
- Genesis Gaming Solutions Inc.
- Syswin Solutions
- CasinoTrac
- Tangam Systems Inc.
- Axes.ai
- Advansys d.o.o.
- BetConstruct
- CT Gaming
- QUONTRA Solutions
Additional Benefits:
- The market estimate (ME) sheet in Excel format
- 3 months of analyst support
TABLE OF CONTENTS
1 INTRODUCTION
- 1.1 Study Assumptions and Market Definition
- 1.2 Scope of the Study
2 RESEARCH METHODOLOGY
3 EXECUTIVE SUMMARY
4 MARKET LANDSCAPE
- 4.1 Market Overview
- 4.2 Market Drivers
- 4.2.1 Rapid Integrated-Resort Builds Across Asia Driving CMS Roll-outs
- 4.2.2 Mandatory Cashless/TITO Regulations in Australia & Nevada
- 4.2.3 U.S. Sports-Betting Legalisation Fuelling Loyalty-System Upgrades
- 4.2.4 Cloud-based CMS Adoption by Tribal Casinos to Offset IT Shortfalls
- 4.2.5 EU 6th AML Directive Accelerating Analytics-Module Demand
- 4.2.6 Labour Shortage in Pit Operations Prompting Automation Modules
- 4.3 Market Restraints
- 4.3.1 High-Profile Cyber-breaches Increasing Operator Liability
- 4.3.2 Macau Concession CapEx Freeze Delaying New CMS Contracts
- 4.3.3 Stricter GDPR-style Data-Privacy Rules Curb Player-Tracking Depth
- 4.3.4 Land-based Footfall Erosion from Online & Mobile Gaming
- 4.4 Regulatory Outlook
- 4.5 Porter's Five Forces Analysis
- 4.5.1 Bargaining Power of Suppliers
- 4.5.2 Bargaining Power of Buyers
- 4.5.3 Threat of New Entrants
- 4.5.4 Threat of Substitutes
- 4.5.5 Intensity of Competitive Rivalry
- 4.6 Investment Analysis
5 MARKET SIZE AND GROWTH FORECASTS (VALUES)
- 5.1 By Component
- 5.1.1 Software
- 5.1.2 Services
- 5.2 By Deployment Mode
- 5.2.1 On-premise
- 5.2.2 Cloud-based
- 5.3 By Purpose
- 5.3.1 Accounting and Cage Operations
- 5.3.2 Security and Surveillance
- 5.3.3 Hotel and Resort Management
- 5.3.4 Analytics and Reporting
- 5.3.5 Player Tracking and Loyalty
- 5.3.6 Media Management and Digital Signage
- 5.3.7 Marketing and Promotions
- 5.4 By End Users
- 5.4.1 Small and Medium Casinos
- 5.4.2 Large Casinos
- 5.5 By Geography
- 5.5.1 North America
- 5.5.1.1 United States
- 5.5.1.2 Canada
- 5.5.2 South America
- 5.5.2.1 Brazil
- 5.5.2.2 Argentina
- 5.5.2.3 Mexico
- 5.5.2.4 Rest of South America
- 5.5.3 Europe
- 5.5.3.1 Germany
- 5.5.3.2 United Kingdom
- 5.5.3.3 France
- 5.5.3.4 Italy
- 5.5.3.5 Spain
- 5.5.3.6 Rest of Europe
- 5.5.4 Asia-Pacific
- 5.5.4.1 China
- 5.5.4.2 Japan
- 5.5.4.3 South Korea
- 5.5.4.4 India
- 5.5.4.5 Australia
- 5.5.4.6 New Zealand
- 5.5.4.7 Rest of Asia-Pacific
- 5.5.5 Middle East and Africa
- 5.5.5.1 Middle East
- 5.5.5.1.1 United Arab Emirates
- 5.5.5.1.2 Saudi Arabia
- 5.5.5.1.3 Turkey
- 5.5.5.1.4 Rest of Middle East
- 5.5.5.2 Africa
- 5.5.5.2.1 South Africa
- 5.5.5.2.2 Nigeria
- 5.5.5.2.3 Kenya
- 5.5.5.2.4 Rest of Africa
- 5.5.1 North America
6 COMPETITIVE LANDSCAPE
- 6.1 Strategic Developments
- 6.2 Vendor Positioning Analysis
- 6.3 Company Profiles (includes Global level Overview, Market level overview, Core Segments, Financials as available, Strategic Information, Products & Services, and Recent Developments)
- 6.3.1 International Game Technology PLC
- 6.3.2 Aristocrat Leisure Ltd.
- 6.3.3 Novomatic AG
- 6.3.4 Scientific Games Corp. (Light & Wonder)
- 6.3.5 Konami Gaming Inc.
- 6.3.6 Bally Technologies Inc.
- 6.3.7 Winsystems Inc.
- 6.3.8 TCS John Huxley
- 6.3.9 Agilysys Inc.
- 6.3.10 Oracle Hospitality
- 6.3.11 Everi Holdings Inc.
- 6.3.12 Table Trac Inc.
- 6.3.13 DJOY Group Ltd.
- 6.3.14 Amatic Industries GmbH
- 6.3.15 Bluberi Gaming Technologies Inc.
- 6.3.16 Apex Gaming Technology
- 6.3.17 Decart Ltd.
- 6.3.18 TransAct Technologies Inc.
- 6.3.19 Genesis Gaming Solutions Inc.
- 6.3.20 Syswin Solutions
- 6.3.21 CasinoTrac
- 6.3.22 Tangam Systems Inc.
- 6.3.23 Axes.ai
- 6.3.24 Advansys d.o.o.
- 6.3.25 BetConstruct
- 6.3.26 CT Gaming
- 6.3.27 QUONTRA Solutions
7 MARKET OPPORTUNITIES AND FUTURE OUTLOOK
- 7.1 White-space and Unmet-Need Assessment
 賭場管理系統市場(按組件、安全系統、支付系統、最終用戶和應用分類)—2025-2032 年全球預測
 日本賭場管理系統市場報告(按組件、應用、最終用戶和地區)2025 年至 2033 年
 2026 年至 2032 年賭場管理系統市場(按模組、應用和地區分類)2025 年至 2033 年賭場管理系統市場報告(按組件、應用、最終用戶和地區)
 歐洲賭場管理:市場佔有率分析、行業趨勢和統計、成長預測(2025-2030 年)
 賭場管理系統市場規模、佔有率、趨勢分析報告:按應用程式、地區、細分市場、預測,2025 年至 2030 年
 賭場管理系統市場規模、佔有率、成長分析,按組件、按應用、按最終用戶、按地區 - 行業預測,2024-2031 年
 賭場管理系統的全球市場規模、佔有率和行業趨勢分析報告:2023-2030 年按組件、最終用戶、應用程式和地區分類的展望和預測