


 |
市場調查報告書
商品編碼
1850137
資料中心自動化:市場佔有率分析、產業趨勢、統計資料和成長預測(2025-2030 年)Data Center Automation - Market Share Analysis, Industry Trends & Statistics, Growth Forecasts (2025 - 2030) |
||||||
※ 本網頁內容可能與最新版本有所差異。詳細情況請與我們聯繫。
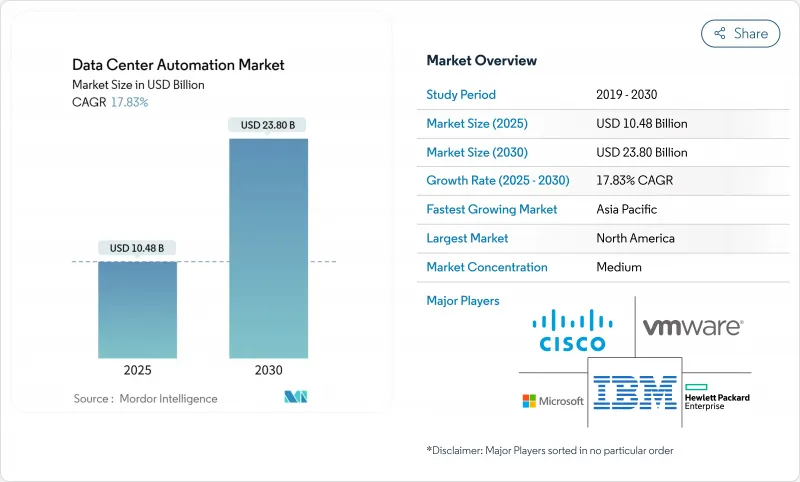
資料中心自動化市場規模預計到 2025 年將達到 104.8 億美元,預計到 2030 年將達到 238 億美元,在此期間的複合年成長率為 17.83%。
在對雲端平台依賴性日益增強、人工智慧工作負載呈現爆炸性成長以及降低能耗壓力不斷增加的推動下,自動化正從營運層面的便利措施轉變為董事會層面的強制性要求。超大規模資料中心的建設推動了對軟體定義編配的需求,以在降低電力成本的同時維持服務品質。同時,模組化設計和液冷系統的部署需要精細化的即時控制,而這只有自動化系統才能實現。供應商透過整合能夠自我調整基礎設施並預測硬體故障的人工智慧引擎,加速了競爭,從而顯著節省了人工、能源和停機時間。此外,美國能源局報告預測,到2028年,資料中心的電力需求可能會翻倍甚至兩番,而人工智慧應用將是推動這一成長的主要動力,這使得能夠最佳化能源使用的自動化解決方案的需求變得迫切。日益成熟的電網互動計劃進一步促進了自動化解決方案的普及,這些計劃獎勵營運商轉移負載並將能源靈活性轉化為收入來源。
全球資料中心自動化市場趨勢與洞察
雲端運算和超大規模建築的激增
到2025年,超大規模園區投資計畫超過2,500億美元,自動化需求涵蓋容量規劃、溫度控管和即時工作負載遷移等各個面向。營運商正在圍繞人工智慧主導的控制器設計設施,這些控制器能夠即時分配運算、電力和冷卻資源,以在最大限度減少人工干預的情況下滿足服務等級需求。如今,資本密集的擴充功能透過預先接線和預先測試的模組化模組進行協調,這需要編配軟體來即時發現、基準並整合每個模組。全球供應商正在透過基於意圖的平台來響應這一需求,這些平台可以跨越數千個資產應用策略,從而將建置速度轉化為競爭優勢。
對節能和永續營運的需求
目前,資料中心的用電量佔全球總用電量的1%至3%,但隨著人工智慧的加速應用,預計到2030年這一比例將上升至5%。諸如歐洲氣候中和資料中心協議等嚴格舉措將新建資料中心的PUE(電源使用效率)上限設定為1.3,鼓勵業者採用自動化系統,持續調整氣流、風扇轉速和工作負載佈局。在早期部署中,人工智慧控制系統已將冷卻能耗降低高達40%,而能夠證明其碳減檢驗的營運商正在吸引那些必須滿足自身ESG(環境、社會和治理)目標的超大規模租戶。自動化的永續性報告進一步降低了合規成本,並提高了與監管機構溝通的透明度。
舊有系統互通性障礙
許多營運商仍然使用專有硬體,其API有限,迫使他們在現代編配得以應用之前,必須使用成本高昂的客製化連接器。網路團隊往往因為擔心配置錯誤導致腳本中斷,而對處理關鍵業務流量的核心交換器的自動化猶豫不決。傳統設施缺乏標準化設計進一步加劇了部署的複雜性,因為為一個站點建置的模板很少能順利移植到其他站點。供應商正在透過豐富的插件市場和基於人工智慧的設備配置逆向工程工具來應對這項挑戰,但對於技術債權沉重的企業而言,遷移週期仍然漫長。
細分市場分析
到2024年,伺服器自動化將佔據資料中心自動化市場51.8%的佔有率,而網路自動化預計到2030年將以19.20%的複合年成長率成長,成為成長最快的市場。網路專用平台的成長反映了微服務、容器叢集和東西向流量模式的普及導致手動命令列變更的主導地位。企業正在轉向使用能夠將業務意圖轉化為設備配置並透過閉合迴路遙測檢驗結果的控制器。這種轉變釋放了可程式服務品質(QoS)、微隔離和自動回滾功能,從而減少了停機事件的發生。
從中長期來看,編配套件會將組態管理、效能分析和合規性檢查等以往各自獨立的功能整合到一個由基於角色的存取控制的整合工具鏈中。人工智慧驅動的診斷功能將識別延遲的根本原因並提案修復建議,從而縮短平均故障解決時間。因此,企業主管開始將網路自動化視為策略性投資,而非成本中心。到了2026年,30%的企業計劃實現至少一半網路活動的自動化,這為意圖式網路的廣泛應用奠定基礎。
到2024年,三級資料中心將佔資料中心自動化市場規模的45.20%,而四級資料中心預計將以18.34%的複合年成長率成長,因為它們預期正常執行時間將達到99.995%。四級資料中心編配依賴精心設計的容錯移轉流程、即時健康評分和自癒網狀架構。自動化診斷系統每分鐘對冗餘路徑和環境感測器進行數千次測試,從而實現零件的預先更換和負載轉移。
相反,預算限制促使一級和二級站點採取選擇性自動化,重點是備份調度和修補程式管理。然而,軟體成本的下降和模組化控制器設計的出現降低了進入門檻。災難復原編配正成為一項普遍優先事項:自動化運作手冊現在每月無需人工干預即可測試容錯移轉序列,從而保障收入並滿足審核要求。這些功能正在逐步縮小不同層級站點之間的營運差距,並提高整個產業的基本期望。
資料中心自動化市場按解決方案類型(伺服器自動化、網路自動化等)、資料中心層級(Tier 1 和 Tier 2、Tier 3、Tier 4)、部署模式(本地部署、雲端部署)、資料中心類型(超大規模/雲端服務供應商、託管服務提供者等)和地區進行細分。市場預測以美元計價。
區域分析
受雲端運算普及和雄厚資本的推動,北美地區預計在2024年仍將佔據資料中心自動化市場46.30%的佔有率。北維吉尼亞等核心區域電力供應緊張,促使企業更加關注電網互動自動化,以最大限度地利用可用電力。聯邦政府的研究表明,到2028年資料中心電力需求可能加倍,這推動了企業對能夠最大限度減少閒置能耗並透過需量反應計畫實現靈活性的平台的興趣。企業永續性目標也進一步推動了人工智慧輔助冷卻和容量規劃工具的廣泛應用。
亞太地區是成長最快的地區,預計2025年至2030年的複合年成長率將達到19.45%。中國、日本和印度的國家級舉措正在鼓勵建造本地雲端區域和邊緣運算,推動了自動化需求,以彌補勞動力短缺。泰國和印尼的大型計劃涉及數十億美元的投資,這些專案將液冷技術與可再生能源結合,從一開始就需要一個編配層來整合不同的技術。
歐洲擁有成熟的資料中心和嚴格的環境法規,是先進永續自動化技術的溫床。 2030年實現氣候中和設施的承諾促使營運商將PUE值維持在1.3或以下,並實施持續最佳化引擎以檢驗可再生能源的使用。需量反應參與和餘熱再利用計劃的獎勵進一步增強了其商業價值。沙烏地阿拉伯、阿拉伯聯合大公國和南非的大型計劃需要淨零排放示範點和自主運行,以克服偏遠地區人員配備不足的問題,因此自動化成為融資和吸引租戶的先決條件。
其他福利:
- Excel格式的市場預測(ME)表
- 3個月的分析師支持
目錄
第1章 引言
- 研究假設和市場定義
- 調查範圍
第2章調查方法
第3章執行摘要
第4章 市場情勢
- 市場概覽
- 市場促進因素
- 雲端運算和超大規模建築的激增
- 對能源效率和永續營運的需求
- 對人工智慧/機器學習工作負載自動化的需求日益成長
- 混合雲和多重雲端架構的複雜性
- 以資料中心為導向的 Grid Interactive獎勵計劃
- 新興經濟體的邊緣定位
- 市場限制
- 舊有系統互通性障礙
- 網路安全和合規風險日益加劇
- 網路維運/自動化人才短缺
- 主要地區出現電力和供水短缺
- 供應鏈分析
- 監管環境
- 技術展望
- 波特五力分析
- 供應商的議價能力
- 買方的議價能力
- 新進入者的威脅
- 替代品的威脅
- 競爭對手之間的競爭
- 對宏觀經濟趨勢的市場評估
- 永續性和碳中和計劃
- 容量和電力需求分析
第5章 市場規模與成長預測
- 透過解決方案
- 伺服器自動化
- 網路自動化
- 儲存/資料庫自動化
- 編配與設定管理
- 績效與合規管理
- 按資料中心層級類型
- 一級和二級
- 三級
- 第四級
- 透過部署模式
- 本地部署
- 雲
- 依資料中心類型
- 超大規模資料中心業者雲端伺服器供應商
- 託管服務提供者
- 企業和邊緣運算
- 按地區
- 北美洲
- 美國
- 加拿大
- 墨西哥
- 歐洲
- 英國
- 德國
- 法國
- 義大利
- 西班牙
- 其他歐洲地區
- 亞太地區
- 中國
- 日本
- 印度
- 新加坡
- 澳洲
- 馬來西亞
- 亞太其他地區
- 南美洲
- 巴西
- 智利
- 阿根廷
- 其他南美洲
- 中東
- 阿拉伯聯合大公國
- 沙烏地阿拉伯
- 土耳其
- 其他中東地區
- 非洲
- 南非
- 奈及利亞
- 其他非洲地區
- 北美洲
第6章 競爭情勢
- 市場集中度
- 策略趨勢
- 市佔率分析
- 公司簡介
- Cisco Systems Inc.
- VMware Inc.
- Microsoft Corporation
- IBM Corporation
- Hewlett Packard Enterprise(HPE)
- Dell Technologies Inc.
- BMC Software Inc.
- ServiceNow Inc.
- Oracle Corporation
- Fujitsu Ltd.
- Juniper Networks Inc.
- ABB Ltd.
- Citrix Systems Inc.
- Chef Software Inc.(Progress Software)
- Brocade Communications Systems
- HashiCorp Inc.
- Puppet Labs LLC
- Micro Focus Intl. plc
- Huawei Technologies Co. Ltd.
- Schneider Electric SE
- NetApp Inc.
第7章 市場機會與未來展望
The data center automation market size is estimated at USD 10.48 billion in 2025 and is forecast to reach USD 23.80 billion by 2030, registering a 17.83% CAGR over the period.
Rising reliance on cloud platforms, surging AI workloads, and growing pressure to reduce energy footprints are moving automation from an operational convenience to a board-level mandate. Hyperscale build-outs have intensified the need for software-defined orchestration that maintains service quality while trimming power bills. In parallel, modular designs and liquid-cooling rollouts demand fine-grained, real-time controls that only automated systems can deliver. Competitive intensity is accelerating as vendors embed AI engines that self-tune infrastructure and predict hardware failures, yielding measurable savings on labor, energy, and downtime. Further, the U.S. Department of Energy reports that data center electricity demand could double or triple by 2028, with AI applications driving much of this growth, creating urgent pressure for automation solutions that can optimize energy usage. Adoption is further strengthened by maturing grid-interactive programs that pay operators to shift loads, turning energy flexibility into a revenue stream.
Global Data Center Automation Market Trends and Insights
Surge in cloud and hyperscale build-outs
Hyperscale campuses scheduled for 2025 investment exceed USD 250 billion, creating an automation imperative that spans capacity planning, thermal management, and live migration of workloads. Operators are designing facilities around AI-driven controllers able to allocate compute, power, and cooling resources in seconds, matching service-level demands while shaving operator intervention to a minimum. Capital-intensive expansions are now coupled with modular blocks that ship pre-wired and pre-tested, so orchestration software must instantly discover, baseline, and integrate each block. Global vendors are responding with intent-based platforms that enforce policies across thousands of assets, turning build-out velocity into a competitive weapon.
Demand for energy-efficient and sustainable operations
Datacenters currently use 1-3% of global electricity, and projections suggest the share could rise to 5% by 2030 if AI uptake accelerates. Strict initiatives such as the Climate Neutral Data Centre Pact in Europe set a PUE ceiling of 1.3 for new builds, prompting operators to adopt automation that continually tunes airflows, fan speeds, and workload placements. AI-enhanced controls have already trimmed cooling power by up to 40% in early deployments, and operators showcasing verifiable carbon reductions are attracting hyperscale tenants that must hit their own ESG targets. Automated sustainability reporting is further lowering compliance overheads and improving transparency with regulators.
Legacy system interoperability hurdles
Many operators still run proprietary hardware with limited APIs, forcing costly custom connectors before modern orchestration can take hold. Network teams often hesitate to automate core switches that handle mission-critical traffic, fearing outages from mis-configured scripts. Lack of design standardization across legacy estates further complicates rollouts because templates built for one site rarely port cleanly to another. Vendors are responding with extensive plugin marketplaces and AI-based discovery tools that reverse-engineer device configurations, yet migration timelines remain protracted for organizations with deep technical debt
Other drivers and restraints analyzed in the detailed report include:
- Rising AI/ML workload automation needs
- Complexity of hybrid and multi-cloud architectures
- Heightened cyber-security and compliance risks
For complete list of drivers and restraints, kindly check the Table Of Contents.
Segment Analysis
Network Automation is the fastest-growing segment with a 19.20% CAGR projected through 2030, although Server Automation retained 51.8% of the data center automation market share in 2024. Growth in network-focused platforms mirrors the proliferation of micro-services, container clusters, and east-west traffic patterns that overwhelm manual command-line changes. Enterprises are shifting to controllers that translate business intent into device configurations, then verify outcomes through closed-loop telemetry. This shift unlocks programmable QoS, micro-segmentation, and automatic rollback capabilities that reduce downtime incidents.
In the medium term, orchestration suites are converging previously separate functions- configuration management, performance analytics, and compliance checks- into unified toolchains governed by role-based access. AI-powered diagnostics pinpoint latency roots and suggest remediations, shortening mean time to resolution. As a result, senior leadership now views network automation as a strategic investment rather than a cost center. Momentum is expected to continue as 30% of enterprises aim to automate at least half of their network activities by 2026, setting the foundation for widespread intent-based networking adoption.
Tier 3 facilities commanded 45.20% of the data center automation market size in 2024, but Tier 4 deployments are on track for an 18.34% CAGR thanks to stringent 99.995% uptime expectations. Operators of Tier 4 campuses rely on orchestrated failover processes, real-time health scoring, and self-healing mesh architectures. Automated diagnostics inspect redundant paths and environmental sensors thousands of times per minute, triggering pre-emptive part swaps or load transfers.
Conversely, Tier 1 and Tier 2 sites pursue selective automation, often focusing on backup scheduling and patch management, due to budget limits. Yet falling software costs and modular controller designs are lowering entry barriers. Disaster-recovery orchestration is becoming a universal priority: Automated runbooks now test failover sequences monthly without human intervention, fulfilling audit requirements while safeguarding revenue. These capabilities gradually narrow the operational disparities between tier levels and raise baseline expectations across the industry.
Data Center Automation Market is Segmented by Solution (Server Automation, Network Automation, and More), by Data Center Tier Type (Tier 1 and 2, Tier 3, and Tier 4), by Deployment Mode (On-Premise, Cloud), by Data Center Type (Hyperscalers/Cloud Service Providers, Colocation Providers, and More), and by Geography. The Market Forecasts are Provided in Terms of Value (USD).
Geography Analysis
North America retained 46.30% of the data center automation market share in 2024, benefiting from deep cloud adoption and access to large capital pools. Power constraints in core corridors such as Northern Virginia sharpen the focus on grid-interactive automation that maximizes every available megawatt. Federal research indicating that data-center electricity demand may double by 2028 magnifies interest in platforms that minimize idle consumption and monetize flexibility through demand-response programs. Corporate sustainability narratives further encourage aggressive deployment of AI-guided cooling and capacity-planning tools.
Asia-Pacific is the fastest-growing territory with a 19.45% CAGR expected between 2025-2030. National initiatives in China, Japan, and India incentivize local cloud zones and edge build-outs, magnifying the need for automation that can compensate for labor shortages. Large-scale projects, including multi-billion-dollar investments in Thailand and Indonesia, bundle liquid-cooling and renewable power sources, demanding orchestration layers able to harmonize disparate technologies from day one.
Europe combines mature colocation hubs with tight environmental regulation, creating a crucible for advanced sustainability automation. Commitments to achieve climate-neutral facilities by 2030 push operators to deploy continuous-optimization engines that maintain sub-1.3 PUE targets and verify renewable-energy usage. Incentives for demand-response participation and heat-re-use schemes reinforce the business case. Growing activity in the Middle East and Africa mirrors this momentum: flagship projects in Saudi Arabia, the United Arab Emirates, and South Africa require net-zero proof points and autonomous operation to overcome remote-site staffing limitations, positioning automation as a prerequisite for securing financing and tenants.
- Cisco Systems Inc.
- VMware Inc.
- Microsoft Corporation
- IBM Corporation
- Hewlett Packard Enterprise (HPE)
- Dell Technologies Inc.
- BMC Software Inc.
- ServiceNow Inc.
- Oracle Corporation
- Fujitsu Ltd.
- Juniper Networks Inc.
- ABB Ltd.
- Citrix Systems Inc.
- Chef Software Inc. (Progress Software)
- Brocade Communications Systems
- HashiCorp Inc.
- Puppet Labs LLC
- Micro Focus Intl. plc
- Huawei Technologies Co. Ltd.
- Schneider Electric SE
- NetApp Inc.
Additional Benefits:
- The market estimate (ME) sheet in Excel format
- 3 months of analyst support
TABLE OF CONTENTS
1 INTRODUCTION
- 1.1 Study Assumptions and Market Definition
- 1.2 Scope of the Study
2 RESEARCH METHODOLOGY
3 EXECUTIVE SUMMARY
4 MARKET LANDSCAPE
- 4.1 Market Overview
- 4.2 Market Drivers
- 4.2.1 Surge in cloud and hyperscale build-outs
- 4.2.2 Demand for energy-efficient and sustainable operations
- 4.2.3 Rising AI/ML workload automation needs
- 4.2.4 Complexity of hybrid and multi-cloud architectures
- 4.2.5 Grid-interactive incentive programs for data centers
- 4.2.6 Edge localization in emerging economies
- 4.3 Market Restraints
- 4.3.1 Legacy system interoperability hurdles
- 4.3.2 Heightened cyber-security and compliance risks
- 4.3.3 NetOps/automation talent shortage
- 4.3.4 Power and water scarcity in major hubs
- 4.4 Supply-Chain Analysis
- 4.5 Regulatory Landscape
- 4.6 Technological Outlook
- 4.7 Porter's Five Forces Analysis
- 4.7.1 Bargaining Power of Suppliers
- 4.7.2 Bargaining Power of Buyers
- 4.7.3 Threat of New Entrants
- 4.7.4 Threat of Substitutes
- 4.7.5 Intensity of Competitive Rivalry
- 4.8 Assessment of Macro-economic Trends on the Market
- 4.9 Sustainability and Carbon-Neutral Initiatives
- 4.10 Capacity and Power-Demand Analysis
5 MARKET SIZE AND GROWTH FORECASTS (VALUES)
- 5.1 By Solution
- 5.1.1 Server Automation
- 5.1.2 Network Automation
- 5.1.3 Storage/Database Automation
- 5.1.4 Orchestration and Configuration Mgmt.
- 5.1.5 Performance and Compliance Mgmt.
- 5.2 By Data Center Tier Type
- 5.2.1 Tier 1 and 2
- 5.2.2 Tier 3
- 5.2.3 Tier 4
- 5.3 By Deployment Mode
- 5.3.1 On-premise
- 5.3.2 Cloud
- 5.4 By Data Center Type
- 5.4.1 Hyperscalers/Cloud Server Providers
- 5.4.2 Colocation Providers
- 5.4.3 Enterprise and Edge
- 5.5 By Geography
- 5.5.1 North America
- 5.5.1.1 United States
- 5.5.1.2 Canada
- 5.5.1.3 Mexico
- 5.5.2 Europe
- 5.5.2.1 United Kingdom
- 5.5.2.2 Germany
- 5.5.2.3 France
- 5.5.2.4 Italy
- 5.5.2.5 Spain
- 5.5.2.6 Rest of Europe
- 5.5.3 Asia-Pacific
- 5.5.3.1 China
- 5.5.3.2 Japan
- 5.5.3.3 India
- 5.5.3.4 Singapore
- 5.5.3.5 Australia
- 5.5.3.6 Malaysia
- 5.5.3.7 Rest of Asia-Pacific
- 5.5.4 South America
- 5.5.4.1 Brazil
- 5.5.4.2 Chile
- 5.5.4.3 Argentina
- 5.5.4.4 Rest of South America
- 5.5.5 Middle East
- 5.5.5.1 United Arab Emirate
- 5.5.5.2 Saudi Arabia
- 5.5.5.3 Turkey
- 5.5.5.4 Rest of Middle East
- 5.5.6 Africa
- 5.5.6.1 South Africa
- 5.5.6.2 Nigeria
- 5.5.6.3 Rest of Africa
- 5.5.1 North America
6 COMPETITIVE LANDSCAPE
- 6.1 Market Concentration
- 6.2 Strategic Moves
- 6.3 Market Share Analysis
- 6.4 Company Profiles (includes Global level Overview, Market level overview, Core Segments, Financials as available, Strategic Information, Market Rank/Share for key companies, Products and Services, and Recent Developments)
- 6.4.1 Cisco Systems Inc.
- 6.4.2 VMware Inc.
- 6.4.3 Microsoft Corporation
- 6.4.4 IBM Corporation
- 6.4.5 Hewlett Packard Enterprise (HPE)
- 6.4.6 Dell Technologies Inc.
- 6.4.7 BMC Software Inc.
- 6.4.8 ServiceNow Inc.
- 6.4.9 Oracle Corporation
- 6.4.10 Fujitsu Ltd.
- 6.4.11 Juniper Networks Inc.
- 6.4.12 ABB Ltd.
- 6.4.13 Citrix Systems Inc.
- 6.4.14 Chef Software Inc. (Progress Software)
- 6.4.15 Brocade Communications Systems
- 6.4.16 HashiCorp Inc.
- 6.4.17 Puppet Labs LLC
- 6.4.18 Micro Focus Intl. plc
- 6.4.19 Huawei Technologies Co. Ltd.
- 6.4.20 Schneider Electric SE
- 6.4.21 NetApp Inc.
7 MARKET OPPORTUNITIES AND FUTURE OUTLOOK
- 7.1 White-space and Unmet-need Assessment
 資料中心自動化市場:商業機會、成長要素、產業趨勢分析及2026-2035年預測
 2026年全球資料中心編配市場報告
 資料中心自動化市場報告:按類型、解決方案、部署模式、最終用戶、產業和地區分類(2026-2034 年)
 資料中心自動化市場規模、佔有率、成長及全球產業分析:按類型、應用和地區分類的洞察,2026-2034 年預測
 資料中心自動化市場:按元件、產業、部署類型和組織規模分類 - 2026-2032 年全球預測2026年全球資料中心自動化市場報告2026年全球資料中心自動化軟體與服務市場報告全球資料中心自動化市場規模、佔有率、趨勢和成長分析報告(2026-2034)
 全球資料中心自動化軟體市場預測(至2034年):按組件、部署類型、資料中心類型、應用程式、最終用戶和地區分類
 資料中心自動化市場規模、佔有率和成長分析(按組件、部署類型、最終用戶和地區分類)-2026-2033年產業預測