


 |
市場調查報告書
商品編碼
1850128
農業接種劑:市場佔有率分析、產業趨勢、統計數據和成長預測(2025-2030 年)Agricultural Inoculants - Market Share Analysis, Industry Trends & Statistics, Growth Forecasts (2025 - 2030) |
||||||
※ 本網頁內容可能與最新版本有所差異。詳細情況請與我們聯繫。
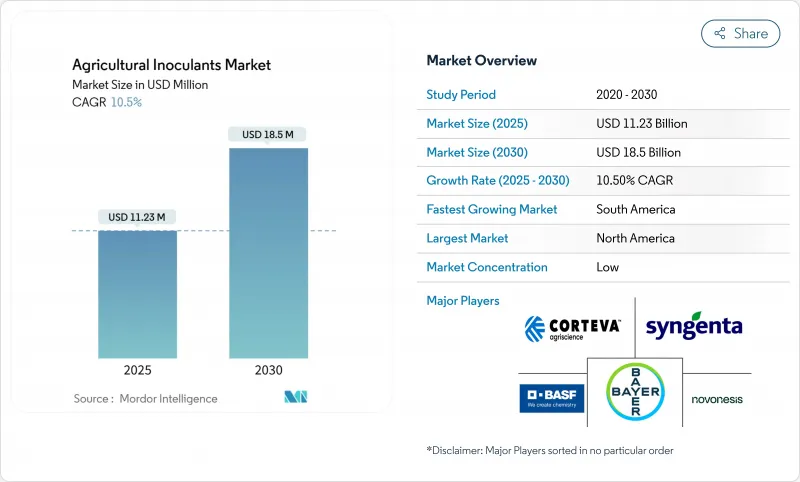
預計到 2025 年,農業接種劑市場價值將達到 112.3 億美元,到 2030 年將達到 185 億美元,複合年成長率為 10.5%。
這些因素包括:旨在遏制合成肥料排放的政策壓力日益增大;旨在獎勵生物固氮的碳權獎勵力度加大;以及消費者對符合永續性成長。隨著農民認知到生物製劑能夠帶來可衡量的產量穩定性和土壤健康改善,該行業已從一種小眾生物投入品轉型為主流作物管理工具。供應商透過符合永續發展目標的優質多菌株配方獲得可觀的利潤,同時降低了種植者的養分成本。大量資本流入進一步鞏固了這一上升趨勢。微生物包埋和人工智慧引導應用系統領域的資金籌措正在迅速成長,為新興企業提供了將差異化技術商業化的資源。同時,現有企業正在加速研發下一代遞送方法,以延長微生物的存活時間並簡化農場使用。這種創新與整合的雙軌發展軌跡表明,隨著價值從單一菌株的商品產品轉向能夠提供檢驗農藝效果的綜合生物平台,市場有望持續擴張。
全球農業接種劑市場趨勢與洞察
轉向有機認證標準
零售商和消費者如今都要求產品不含農藥,這為符合嚴格有機標準的投入品創造了龐大的市場。歐盟的「從農場到餐桌」策略旨在到2030年將化學農藥的使用量減少50%,該戰略加速了微生物接種劑在歐盟範圍內的應用。美國農業部(USDA)的國家有機計劃法規已更新,明確了可接受的微生物生產規範,從而降低了買家的不確定性,並支持了供應商的投資。有機產品20%至40%的溢價證明了生物接種劑高昂的初始成本是合理的。然而,缺乏專業倉儲和處理基礎設施的小型生產商在整個供應鏈中維持認證面臨許多挑戰。
耕地面積減少和糧食安全壓力
全球人均耕地面積已從1970年的0.38公頃下降到2020年的0.19公頃,導致人們更重視提高產量而非擴大耕地面積。在亞太地區,快速的都市化加劇了這種壓力。田間研究表明,微生物接種劑可透過改善養分循環和土壤結構,即使在低產土壤中也能將產量提高4.8%至6.2%。在土地價格超過每公頃1萬美元的地區,生物投入物為提高產量提供了經濟有效的途徑。由於能源市場供應緊張導致化肥價格波動,這一優勢更加凸顯。
農民意識不足以及農場操作的複雜性
許多農民缺乏微生物儲存、活性檢測和施用時間的培訓。推廣人員往往專注於化學肥料和農藥,導致他們在生物肥料方面知識匱乏。因此,產品處理不當會導致效果不穩定,並引發消費者的質疑。巴西的「根瘤破碎」技術,即從根瘤中培養根瘤菌,顯示基層創新可以彌合推廣方面的差距,降低推廣應用的門檻。
細分市場分析
到2024年,作物營養應用將佔總收入的52%,因為固氮和溶磷微生物將部分取代合成肥料。隨著化肥成本上漲推動生物替代,營養領域農業接種劑的市場規模預計將穩定擴大。農民表示,他們可以在保持產量的同時節省15-25%的氮肥投入,這意味著更快的投資回收期。
儘管作物保護生物製藥的市佔率貢獻較小,但到2030年,其複合年成長率將達到10.9%。推動市場需求成長的因素包括:政府對化學農藥的監管力度加大,以及主要病原體抗藥性問題的日益嚴重。目前,各公司正將微生物保護劑與營養物質捆綁銷售,承諾提供從土壤到葉片的全面覆蓋。這種融合趨勢迫使獨立營養物質生產商拓展產品線,否則將面臨市場佔有率被整合型產品蠶食的風險。
到2024年,細菌將佔據農業接種劑市場71%的佔有率,這反映了根瘤菌在豆類作物中數十年的成功應用及其在穀類中日益廣泛的應用。其領先地位歸功於其已充分證實的功效、低成本以及監管機構的熟悉程度。
真菌是成長最快的生物類群,預計到2030年將以11.5%的複合年成長率成長。木黴屬和菌根真菌在抑制病害和吸收磷方面日益受到核准。儘管細菌類生物製劑仍保持著規模優勢,但真菌類創新企業憑藉其卓越的抗逆性優勢正吸引投資。
區域分析
2024年,北美地區仍保持最大的區域市場佔有率,這得益於其強大的研發活動和完善的投入品分銷網路。該地區到2030年的複合年成長率為6.9%,低於全球平均水平,因為許多種植者對生物肥料的可靠性缺乏信心,認為其無法與合成肥料相提並論。監管途徑正在逐步完善,美國環保署近期對芽孢桿菌和木黴菌株的豁免縮短了新產品的上市時間。持續進行農民教育以及碳權額度的整合有望推動玉米帶和草原省份地區對生物肥料的採用。
南美洲是成長最快的地區,複合年成長率達10.4%。巴西國家生物投入品計畫累計在2023-24年度將創造50億雷亞爾(10億美元)的銷售額,年增15%。阿根廷成熟的大豆接種基礎設施與巴西積極推進的新作物種植計畫相輔相成,共同打造了覆蓋整個南美洲的生物投入熱點。跨國公司正在深化與當地企業的合作,以確保獲得監管支持和生產能力,例如ICL收購Nitro 1000以及FMC與Ballagro的合作。
亞太和非洲蘊藏新的商機,其複合年成長率分別高達9.8%和8.3%。中國已註冊超過550種微生物農藥產品,展現出強勁的監管動能;印度中央殺蟲劑委員會已核准416種生物製藥,預計到2024年初即可上市。在非洲,諸如農場根瘤菌繁殖等適合小農戶的種植方式可以規避低溫運輸限制,但更廣泛的市場發展取決於能否獲得推廣支持和接種劑施用設施的資金。
其他福利:
- Excel格式的市場預測(ME)表
- 3個月的分析師支持
目錄
第1章 引言
- 研究假設和市場定義
- 調查範圍
第2章調查方法
第3章執行摘要
第4章 市場情勢
- 市場概覽
- 市場促進因素
- 向有機認證標準過渡
- 耕地減少和糧食安全壓力
- 調整政府化肥補貼結構,轉向生物投入品
- 種子應用生物學聯盟的快速擴張
- 對微生物封裝技術的創投
- 將生物固氮的碳權貨幣化
- 市場限制
- 農民意識不足以及農場操作的複雜性
- 偏好速效合成肥料
- 微生物混合物監管中的灰色地帶
- 延伸供應鏈中的生物污染風險
- 監管環境
- 技術展望
- 波特五力分析
- 供應商的議價能力
- 買方的議價能力
- 新進入者的威脅
- 替代品的威脅
- 競爭對手之間的競爭
第5章 市場規模與成長預測
- 按功能
- 作物營養
- 作物保護
- 微生物
- 細菌
- 根際細菌
- 固氮菌
- 磷酸化細菌
- 其他細菌
- 真菌
- 木黴
- 菌根
- 其他真菌
- 其他微生物
- 細菌
- 使用方法
- 種子接種
- 土壤接種
- 按作物類型
- 糧食
- 豆類和油籽
- 經濟作物
- 水果和蔬菜
- 其他用途
- 按地區
- 北美洲
- 美國
- 加拿大
- 墨西哥
- 北美其他地區
- 歐洲
- 德國
- 英國
- 法國
- 西班牙
- 義大利
- 俄羅斯
- 其他歐洲地區
- 亞太地區
- 中國
- 日本
- 印度
- 澳洲
- 亞太其他地區
- 南美洲
- 巴西
- 阿根廷
- 其他南美洲
- 中東
- 沙烏地阿拉伯
- 阿拉伯聯合大公國
- 其他中東地區
- 非洲
- 南非
- 肯亞
- 其他非洲地區
- 北美洲
第6章 競爭情勢
- 市場集中度
- 策略趨勢
- 市佔率分析
- 公司簡介
- BASF SE
- Novonesis(Novozymes A/S)
- Corteva Agriscience
- Premier Tech Ltd.
- Lallemand Inc.
- Lesaffre-Agrauxine(Lesaffre Group)
- Bioceres Crop Solutions Corp.
- Verdesian Life Sciences(AEA Investors)
- Mapleton Agri Biotec
- New Edge Microbials
- T. Stanes and Company(Amalgamations Group)
- Valent BioSciences(Sumitomo Chemical)
- Bayer AG
- Syngenta AG(ChemChina)
第7章 市場機會與未來展望
The agricultural inoculants market is valued at USD 11.23 billion in 2025 and is projected to reach USD 18.50 billion by 2030, reflecting a 10.5% CAGR.
Growth now rests on these converging forces: mounting policy pressure to curb synthetic fertilizer emissions, stronger carbon-credit incentives that reward biological nitrogen fixation, and rising retail demand for residue-free food that meets tightening organic standards. The sector has moved from niche biological inputs toward mainstream crop-management tools as farmers recognize measurable yield stability and soil health gains. Suppliers capture attractive margins through premium, multi-strain formulations that align with sustainability targets while lowering nutrient costs for growers. Key capital inflows reinforce the uptrend. Venture funding in microbial encapsulation and AI-guided application systems is scaling quickly, giving start-ups the resources to commercialize differentiated technologies. At the same time, incumbents accelerate research and development in next-generation delivery methods that extend microbial viability and simplify on-farm use. This dual track of innovation and consolidation signals a market poised for continued expansion as value shifts from commodity single-strain products to integrated biological platforms that deliver verifiable agronomic outcomes.
Global Agricultural Inoculants Market Trends and Insights
Shift toward organic certification standards
Retailers and consumers now demand residue-free produce, creating a sizable market for inputs that meet strict organic standards. The European Union's Farm to Fork strategy, aiming for a 50% cut in chemical pesticide use by 2030, accelerated microbial adoption across the bloc. Updated USDA National Organic Program rules clarify acceptable microbial production practices, reducing buyer uncertainty and supporting supplier investment. Organic price premiums ranging from 20% to 40% justify higher upfront costs for biological inoculants. Nevertheless, smaller growers without specialized storage and handling infrastructure face hurdles in maintaining certification throughout the supply chain.
Shrinking arable land and food-security pressures
Global arable land per capita fell from 0.38 ha in 1970 to 0.19 ha in 2020, sharpening the focus on yield intensification rather than land expansion. In Asia-Pacific, rapid urbanization amplifies this pressure. Field studies show microbial inoculants can raise yields 4.8-6.2% in low-productivity soils by improving nutrient cycling and soil structure. For regions where land prices exceed USD 10,000 per hectare, biological inputs offer a cost-effective intensification pathway. The benefit grows as synthetic fertilizer prices remain volatile due to energy-market tightness.
Farmer awareness gaps and on-farm handling complexity
Many farmers lack training on microbial storage, viability testing, and application timing. Extension agents often focus on fertilizers and pesticides, leaving a knowledge gap for biologicals. As a result, product mishandling leads to inconsistent performance and skepticism. Brazil's "nodule crushing" technique, which lets growers propagate rhizobia from root nodules, shows that grassroots innovation can fill extension gaps and lower adoption barriers.
Other drivers and restraints analyzed in the detailed report include:
- Rapid expansion of seed-applied biological consortia
- Venture investment in encapsulation tech for microbes
- Preference for fast-response synthetic fertilizers
For complete list of drivers and restraints, kindly check the Table Of Contents.
Segment Analysis
Crop nutrition applications captured 52% of 2024 revenue as nitrogen-fixing and phosphorus-solubilizing microbes replaced portions of synthetic fertilizers. The agricultural inoculants market size for nutrition is projected to expand steadily as rising fertilizer costs encourage biological substitution. Farmers appreciate documented savings of 15-25% on nitrogen inputs while maintaining yields, which translates into rapid payback periods.
Crop protection biologicals, while contributing a smaller base, are set for a 10.9% CAGR through 2030. Regulatory crackdowns on chemical pesticides and a surge in resistance issues among major pathogens are accelerating demand. Companies now bundle microbial protectants with nutritional strains, promising holistic soil-to-leaf coverage. This convergence pressures standalone nutrition providers to broaden portfolios or risk losing share to integrated offerings.
Bacteria held 71% of the agricultural inoculants market share in 2024, reflecting decades of rhizobia success in legumes and growing use in cereals. This leadership rests on well-documented efficacy, low cost, and familiarity among regulators.
Fungi are the fastest-growing group, projected at an 11.5% CAGR to 2030. Trichoderma and mycorrhiza strains gain traction for disease suppression and phosphorus uptake. Advances in encapsulation enhance shelf stability, while recent EPA tolerance exemptions smooth approvals. Although bacterial incumbents retain scale advantages, fungal innovators attract investment for premium stress-mitigation benefits.
The Agricultural Inoculants Market Report is Segmented by Function (Crop Nutrition and Crop Protection), Microorganism (Bacteria, Fungi, and Other Microorganisms), Mode of Application (Seed Inoculation and Soil Inoculation), Crop Type (Grains and Cereals, Pulses and Oilseeds, and More), and Geography (North America, South America, Europe, Asia-Pacific, and More). The Market Forecasts are Provided in Terms of Value (USD).
Geography Analysis
North America maintained the largest regional share in 2024, supported by robust research and development activity and well-established ag-input distribution networks. The region's 6.9% CAGR to 2030 trails the global average because many growers remain unconvinced that biologicals can match the reliability of synthetic fertilizers. Regulatory pathways are gradually improving, and recent EPA exemptions for Bacillus and Trichoderma strains shorten the time to market for new products. Continued farmer education and carbon-credit integration could lift adoption across the Corn Belt and Prairie Provinces.
South America is the fastest-growing region with a 10.4% CAGR. Brazil's National Bio-inputs Program generated BRL 5 billion (USD 1 billion) in sales in the 2023-24 season, up 15%, underscoring strong policy support. Argentina's mature soybean inoculation infrastructure complements Brazil's aggressive new-crop initiatives, creating a continent-wide hotspot. Multinational firms are deepening local partnerships, as shown by ICL's acquisition of Nitro 1000 and FMC's pact with Ballagro, to secure regulatory footholds and production capacity.
Asia-Pacific and Africa present emerging opportunities, growing at 9.8% and 8.3% CAGRs, respectively. China's registration of over 550 microbial pesticide products shows regulatory momentum, while India's Central Insecticides Board approved 416 biologic agendas in early 2024. In Africa, smallholder-friendly approaches such as on-farm rhizobia propagation bypass cold-chain constraints, but broader market development still depends on extension support and finance access for inoculant application equipment.
- BASF SE
- Novonesis (Novozymes A/S)
- Corteva Agriscience
- Premier Tech Ltd.
- Lallemand Inc.
- Lesaffre - Agrauxine (Lesaffre Group)
- Bioceres Crop Solutions Corp.
- Verdesian Life Sciences (AEA Investors)
- Mapleton Agri Biotec
- New Edge Microbials
- T. Stanes and Company (Amalgamations Group)
- Valent BioSciences (Sumitomo Chemical)
- Bayer AG
- Syngenta AG (ChemChina)
Additional Benefits:
- The market estimate (ME) sheet in Excel format
- 3 months of analyst support
TABLE OF CONTENTS
1 Introduction
- 1.1 Study Assumptions and Market Definition
- 1.2 Scope of the Study
2 Research Methodology
3 Executive Summary
4 Market Landscape
- 4.1 Market Overview
- 4.2 Market Drivers
- 4.2.1 Shift toward organic certification standards
- 4.2.2 Shrinking arable land and food-security pressures
- 4.2.3 Government fertilizer subsidy realignment toward bio-inputs
- 4.2.4 Rapid expansion of seed-applied biological consortia
- 4.2.5 Venture investment in encapsulation technology for microbes
- 4.2.6 Carbon-credit monetization for biological nitrogen fixation
- 4.3 Market Restraints
- 4.3.1 Farmer awareness gaps and on-farm handling complexity
- 4.3.2 Preference for fast-response synthetic fertilizers
- 4.3.3 Regulatory gray zones for stacked microbial cocktails
- 4.3.4 Biological contamination risk in extended supply chains
- 4.4 Regulatory Landscape
- 4.5 Technological Outlook
- 4.6 Porter's Five Forces Analysis
- 4.6.1 Bargaining Power of Suppliers
- 4.6.2 Bargaining Power of Buyers
- 4.6.3 Threat of New Entrants
- 4.6.4 Threat of Substitutes
- 4.6.5 Intensity of Competitive Rivalry
5 Market Size and Growth Forecasts
- 5.1 By Function (Value)
- 5.1.1 Crop Nutrition
- 5.1.2 Crop Protection
- 5.2 By Microorganism (Value)
- 5.2.1 Bacteria
- 5.2.1.1 Rhizobacteria
- 5.2.1.2 Azotobacter
- 5.2.1.3 Phosphobacteria
- 5.2.1.4 Other Bacteria
- 5.2.2 Fungi
- 5.2.2.1 Trichoderma
- 5.2.2.2 Mycorrhiza
- 5.2.2.3 Other Fungi
- 5.2.3 Other Microorganisms
- 5.2.1 Bacteria
- 5.3 By Mode of Application (Value)
- 5.3.1 Seed Inoculation
- 5.3.2 Soil Inoculation
- 5.4 By Crop Type (Value)
- 5.4.1 Grains and Cereals
- 5.4.2 Pulses and Oilseeds
- 5.4.3 Commercial Crops
- 5.4.4 Fruits and Vegetables
- 5.4.5 Other Applications
- 5.5 By Geography (Value)
- 5.5.1 North America
- 5.5.1.1 United States
- 5.5.1.2 Canada
- 5.5.1.3 Mexico
- 5.5.1.4 Rest of North America
- 5.5.2 Europe
- 5.5.2.1 Germany
- 5.5.2.2 United Kingdom
- 5.5.2.3 France
- 5.5.2.4 Spain
- 5.5.2.5 Italy
- 5.5.2.6 Russia
- 5.5.2.7 Rest of Europe
- 5.5.3 Asia-Pacific
- 5.5.3.1 China
- 5.5.3.2 Japan
- 5.5.3.3 India
- 5.5.3.4 Australia
- 5.5.3.5 Rest of Asia-Pacific
- 5.5.4 South America
- 5.5.4.1 Brazil
- 5.5.4.2 Argentina
- 5.5.4.3 Rest of South America
- 5.5.5 Middle East
- 5.5.5.1 Saudi Arabia
- 5.5.5.2 United Arab Emirates
- 5.5.5.3 Rest of Middle East
- 5.5.6 Africa
- 5.5.6.1 South Africa
- 5.5.6.2 Kenya
- 5.5.6.3 Rest of Africa
- 5.5.1 North America
6 Competitive Landscape
- 6.1 Market Concentration
- 6.2 Strategic Moves
- 6.3 Market Share Analysis
- 6.4 Company Profiles {(includes Global level Overview, Market level overview, Core Segments, Financials as available, Strategic Information, Market Rank/Share, Products and Services, and Recent Developments)}
- 6.4.1 BASF SE
- 6.4.2 Novonesis (Novozymes A/S)
- 6.4.3 Corteva Agriscience
- 6.4.4 Premier Tech Ltd.
- 6.4.5 Lallemand Inc.
- 6.4.6 Lesaffre - Agrauxine (Lesaffre Group)
- 6.4.7 Bioceres Crop Solutions Corp.
- 6.4.8 Verdesian Life Sciences (AEA Investors)
- 6.4.9 Mapleton Agri Biotec
- 6.4.10 New Edge Microbials
- 6.4.11 T. Stanes and Company (Amalgamations Group)
- 6.4.12 Valent BioSciences (Sumitomo Chemical)
- 6.4.13 Bayer AG
- 6.4.14 Syngenta AG (ChemChina)
7 Market Opportunities and Future Outlook
 農業接種劑市場:按類型、作物、配方、最終用途、應用方法和銷售管道分類-2026-2032年全球市場預測
 農業接種劑市場報告:按類型、微生物、應用方法、劑型、作物類型和地區分類(2026-2034 年)
 2026-2034年全球農業接種劑市場規模、佔有率、趨勢和成長分析報告
 農業接種劑市場-全球產業規模、佔有率、趨勢、機會及預測(按類型、作物類型、微生物、應用方法、地區和競爭格局分類,2021-2031年)
 農業接種劑市場規模、佔有率和成長分析(按類型、微生物、作物類型、應用方法和地區分類)—產業預測(2026-2033 年)
 全球農業接種劑市場