


 |
市場調查報告書
商品編碼
1850125
資料中心電力:市場佔有率分析、行業趨勢、統計數據和成長預測(2025-2030 年)Data Center Power - Market Share Analysis, Industry Trends & Statistics, Growth Forecasts (2025 - 2030) |
||||||
※ 本網頁內容可能與最新版本有所差異。詳細情況請與我們聯繫。
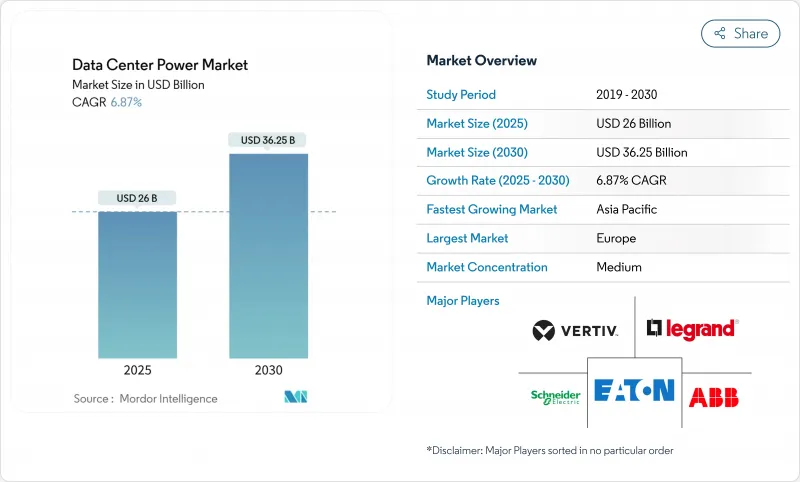
預計到 2025 年,資料中心電力市場規模將達到 245.6 億美元,到 2030 年將達到 348.6 億美元,年複合成長率為 7.25%。
人工智慧部署的不斷擴展、超大規模資料中心容量的積極成長以及日益嚴格的可靠性要求正在再形成電力基礎設施的優先事項,並推動資料中心電力市場的擴張。高密度人工智慧工作負載的功耗是傳統CPU的三倍,促使營運商轉向更高電壓的配電、液冷和併網供電系統。隨著公用事業公司、監管機構和雲端服務供應商在需要多吉瓦級互聯的大型計劃上達成共識,設備供應商之間的整合也在加劇。隨著越來越多的參與企業將退役的燃煤電廠改造為園區式資料中心,資料中心電力市場正從被動能源消耗轉向主動參與電網,並透過配套服務開闢新的收入來源。
全球資料中心電力市場趨勢與洞察
超大規模和雲端運算的興起
超大規模營運商正在為規模堪比中型城市的園區運作電力。 Meta 的 2 吉瓦開發案和 Wonder Valley 的 5.6 吉瓦計畫都展現了維持雲端運算成長所需的規模。Schneider Electric透露,資料中心將佔其 2025 年訂單的 24%。將公用事業互聯與逐步釋放容量掛鉤的結構化合約正變得越來越普遍,從而改善了公用事業公司、業主和雲端租戶之間的風險分配。資料中心電力市場將直接受益,因為 IT 負載每增加一兆瓦,就需要相應增加對開關設備、UPS 和中壓系統的投資。
AI密集型工作負載
AI加速器正推動機架密度從5-10kW提升至50-100kW,進而促使電源分配方式轉向48V直流、更高相數和液冷方向。 Vertiv的360AI平台支援每個機架100kW的功率,並整合了母線槽、液冷分配和洩漏偵測控制功能。持續的熱負荷會增加UPS設備的佔空比,因此部分負載效率曲線成為關鍵的選擇指標。根據國際能源總署的預測,到2029年,AI可能消耗全球1.5%的電力,這使得能夠根據GPU利用率動態調節功率的節能型電源系統變得更加迫切。隨著營運商對可預測部署計劃的需求不斷成長,那些將電源和冷卻整合到緊湊型預製模組中的供應商正在贏得市場佔有率。
電力基礎設施資本支出高
一座人工智慧賦能的資料中心園區,其端到端成本接近每兆瓦3800萬美元,而液冷系統會使動力傳動系統成本比風冷設計高出15到20倍。規模較小的託管業者難以獲得客製化中壓設備、長週期變壓器和專用電池的融資。儘管設施即服務(FaaS)合約正在興起,但由於客製化開關設備的次市場價值有限,金融機構仍保持謹慎。預算限制正在減緩新興市場的擴張,削弱資料中心電力市場的積極發展勢頭。資金籌措缺口也促使業主和公用事業公司採用合資模式,共同投資,雖然會稀釋收益,但能確保計劃的可行性。
細分市場分析
到2024年,UPS平台將維持資料中心電力市場62.1%的佔有率,凸顯其作為電網不穩定的最後一道防線的重要作用。儘管鋰離子電池的普及仍在繼續,但由於閥控式鉛酸電池在低密度機房中具有成本優勢,因此仍佔據主導地位。智慧開關模式整流器可降低轉換損耗,並改善設施的整體能源狀況。同時,隨著營運商將支路監控、溫度感測和安全韌體等功能整合到配電設備中,配電設備的複合年成長率 (CAGR) 達到7.5%。雖然發電機仍然必不可少,但隨著氫燃料電池發電機的試驗,情況正在改變。為了滿足人工智慧機架所需的高電壓,需要對開關設備進行升級,而電池能源儲存系統因其抑低尖峰負載和收益累積的優勢而越來越受歡迎。
隨著UPS供應商增加電網服務模組,生態系統動態發生變化,這些模組能夠在不影響跨接運作效能的前提下進行頻率調整。 Vertiv的電網互動韌體可在非關鍵時段調度備用容量。Delta的Smart PDU I-Type面向高密度AI機櫃,將計量和遠端升級功能整合到42mm厚的底盤中。由於高密度機房的試運行需要進行熱成像、諧波測試和持續的韌體檢驗,服務收入也隨之增加。因此,營運商將生命週期支援外包,為整合商帶來可預測的年金收入,並促進了資料中心電源市場的繁榮。
至2024年,託管資料中心將佔資料中心電力市場規模的43.8%。然而,受蘋果、微軟和Google自建AI託管區策略的推動,超大規模資料中心將以8.7%的複合年成長率成長。對於合規性要求較高的行業,企業園區仍將繼續存在,而邊緣節點將在人口密集區附近大量湧現,以降低延遲。超大規模資料中心將設計獨特的電力拓撲結構,整合現場變電站和電池儲能系統,而託管資料中心營運商則會以靈活的功率密度和互連架構來應對挑戰。
競爭推動創新:Coresight 將液冷晶片和 48V 母線槽標榜為下一代機房的標準,而雲端巨頭則以 15MW 為增量改進模組。雙方都採用計量型契約,將資本投入與即時運作脫鉤。邊緣營運商引入標準化微功率模組,以跟上 5G 部署的步伐。這些相互交織的策略推動了資料中心電力市場設備數量的成長。
區域分析
維修風力強勁地區的電網,進一步鞏固了歐洲在永續設計領域的領先地位。企業買家青睞歐洲的資料中心,因為其可再生能源生產的產品有助於實現淨零排放目標,並維持整個資料中心電力市場的設備需求。
亞太地區將以9.2%的複合年成長率成為成長最快的地區,這主要得益於各國政府對雲走廊的資助以及對土地、光纖和電力的補貼。截至2024年下半年,亞太地區將擁有12,206兆瓦的運作IT容量,另有14,338兆瓦正在興建中。微軟宣布了在印度和日本的數十億美元投資計劃,凸顯了其擴張的規模。中國的PUE(電源使用效率)上限政策加速了對高效率電源組件的需求。印度的《數位個人資料保護法》將促進國內託管,並刺激在可再生能源叢集附近建造新的園區。東南亞各國正在提供稅收優惠以吸引超大規模資料中心業者資料中心營運商,這將進一步擴大開關設備、UPS(不間斷電源)和智慧PDU(配電單元)的採購管道。
其他福利:
- Excel格式的市場預測(ME)表
- 3個月的分析師支持
目錄
第1章 引言
- 研究假設和市場定義
- 調查範圍
第2章調查方法
第3章執行摘要
第4章 市場情勢
- 市場概覽
- 市場促進因素
- 超大規模和雲端運算的擴展
- AI驅動的密集型工作負載
- 更嚴格的運作和冗餘標準
- 永續性和能源效率要求
- 網格互動收入流
- 燃煤發電廠改建為校園
- 市場限制
- 對電力基礎設施的高額資本投資
- 碳強度監理與報告
- 變壓器/配電設備供應瓶頸
- 當地民眾反對擴建變電站。
- 供應鏈分析
- 監管環境
- 技術展望
- 波特五力模型
- 供應商的議價能力
- 買方的議價能力
- 新進入者的威脅
- 替代品的威脅
- 競爭程度
第5章 市場規模與成長預測
- 按組件
- 電氣解決方案
- UPS系統
- 發電機
- 柴油發電機
- 瓦斯發電機
- 氫燃料電池發電機
- 配電單元
- 開關設備
- 傳輸開關
- 遠端電源面板
- 能源儲存系統
- 服務
- 安裝和試運行
- 維護和支援
- 培訓和諮詢
- 電氣解決方案
- 依資料中心類型
- 超大規模資料中心業者/雲端服務供應商
- 託管服務提供者
- 企業和邊緣資料中心
- 按資料中心規模
- 小型資料中心
- 中型資料中心
- 大型資料中心
- 大型資料中心
- 超大型資料中心
- 按等級
- 一級和二級
- 三級
- 四級
- 按地區
- 北美洲
- 美國
- 加拿大
- 墨西哥
- 南美洲
- 巴西
- 阿根廷
- 其他南美洲
- 歐洲
- 德國
- 英國
- 法國
- 俄羅斯
- 其他歐洲地區
- 亞太地區
- 中國
- 日本
- 印度
- 韓國
- 澳洲和紐西蘭
- 亞太其他地區
- 中東和非洲
- 中東
- 阿拉伯聯合大公國
- 沙烏地阿拉伯
- 土耳其
- 其他中東地區
- 非洲
- 南非
- 奈及利亞
- 其他非洲地區
- 北美洲
第6章 競爭情勢
- 市場集中度
- 策略趨勢
- 市佔率分析
- 公司簡介
- Schneider Electric SE
- Vertiv Holdings Co.
- ABB Ltd
- Eaton Corporation plc
- Legrand SA
- Huawei Technologies Co. Ltd
- Fujitsu Ltd
- Cisco Systems Inc.
- Rittal GmbH and Co. KG
- Mitsubishi Electric Corp.
- Cummins Inc.
- Kohler Power Systems
- PDU Experts UK Ltd
- Schleifenbauer Products BV
- Delta Electronics Inc.
- Caterpillar Inc.
- Socomec Group
- Tripp Lite(by Eaton)
- Riello UPS SpA
- KEHUA Tech
第7章 市場機會與未來展望
The data center power market size is expected to be valued at USD 24.56 billion in 2025 and is projected to advance at a 7.25% CAGR, reaching USD 34.86 billion by 2030.
Growing deployment of artificial intelligence, aggressive hyperscale capacity additions, and stricter reliability mandates are reshaping electrical infrastructure priorities and fueling expansion in the data center power market. High-density AI workloads consume three times more electricity than conventional CPUs, pushing operators toward higher-voltage distribution, liquid cooling, and grid-interactive power trains. Consolidation among equipment suppliers is strengthening as utilities, regulators, and cloud providers align on large-scale projects that require multi-gigawatt interconnections. With more operators repurposing retired coal plants for campus-style facilities, the data center power market is transitioning from passive energy consumption to active grid participation, unlocking new revenue streams through ancillary services.
Global Data Center Power Market Trends and Insights
Hyperscale & Cloud Computing Expansion
Hyperscale operators are commissioning campuses that equal the electricity demand of medium-sized cities. Meta's 2 GW development and the 5.6 GW Wonder Valley site illustrate the scale now required to sustain cloud growth. Orders for modular, factory-integrated power trains are rising sharply, and Schneider Electric disclosed that data centers made up 24% of its incoming orders in 2025. Structured agreements tying utility interconnections to phased capacity releases are becoming common, improving risk allocation among utilities, landlords, and cloud tenants. The data center power market benefits directly because every incremental megawatt of IT load drives proportional investment in switchgear, UPS, and medium-voltage systems.
AI-Driven High-Density Workloads
AI accelerators raise rack densities from 5-10 kW to 50-100 kW, forcing a move to 48 V DC distribution, higher phase counts, and liquid cooling. Vertiv's 360AI platform supports 100 kW per rack with integrated busway, coolant distribution, and leak-detection controls. Persistent thermal loads increase the duty cycle of UPS equipment, making efficiency curves at partial load a critical selection metric. International Energy Agency projections indicate AI could consume 1.5% of global electricity by 2029, reinforcing the urgency for energy-proportional power systems that dynamically throttle in sync with GPU utilization. Vendors that marry power and cooling into a compact, prefabricated block are capturing share as operators seek predictable deployment timelines.
High CAPEX of Electrical Infrastructure
End-to-end cost for AI-ready campuses approaches USD 38 million per MW, with liquid cooling inflating power-train expenditures by 15-20X compared with air-based designs. Smaller colocation players find it challenging to secure financing for customized medium-voltage gear, long-lead transformers, and specialized batteries. Equipment-as-a-service contracts are emerging, yet lenders remain cautious because secondary-market values for bespoke switchgear are limited. Budget restrictions slow expansion in emerging economies, tempering the otherwise robust trajectory of the data center power market. Financing gaps also spur joint-venture models where landlords and utilities co-invest, diluting returns but enabling project viability.
Other drivers and restraints analyzed in the detailed report include:
- Stricter Uptime & Redundancy Standards
- Sustainability & Energy-Efficiency Mandates
- Transformer/Switchgear Supply Bottlenecks
For complete list of drivers and restraints, kindly check the Table Of Contents.
Segment Analysis
UPS platforms retained 62.1% of the data center power market share in 2024, underscoring their role as the last defense against grid instability. Lithium-ion adoption continues, but valve-regulated lead-acid remains prevalent due to cost advantage in lower-density halls. Intelligent switch-mode rectifiers trim conversion losses, improving overall facility energy profiles. In parallel, power distribution units record 7.5% CAGR because operators now embed branch-circuit monitoring, temperature sensing, and secure firmware. Generators stay indispensable, yet the narrative shifts as hydrogen-ready gensets enter pilot use. Switchgear upgrades align with higher voltages demanded by AI racks, and battery energy storage systems gain favor for peak-shaving and revenue stacking.
Ecosystem dynamics shift as UPS vendors add grid services modules, enabling frequency regulation without undermining ride-through performance. Vertiv's grid-interactive firmware dispatches reserve capacity during non-critical intervals. Delta's Smart PDU I-Type consolidates metering and remote-upgrade functions into a 42 mm chassis aimed at dense AI enclosures. Services revenue rises because commissioning high-density halls requires thermal mapping, harmonic studies, and ongoing firmware validation. Consequently, operators outsource lifecycle support, driving predictable, annuity-style income streams for integrators and enriching the data center power market.
Colocation facilities held a 43.8% share of the data center power market size in 2024, thanks to shared infrastructure economics and rapid time-to-market. Yet hyperscalers post an 8.7% CAGR, propelled by Apple, Microsoft, and Google's strategies to self-build AI hosting zones. Enterprise campuses persist for compliance-sensitive industries, and edge nodes proliferate near population clusters to lower latency. Hyperscalers design proprietary power topologies, integrating on-site substations and battery farms, while colocation players counter with flexible power densities and interconnect fabrics.
Competitive tension fosters innovation: CoreSite advertises liquid-to-chip cooling and 48 V busway as standard in next-gen halls, whereas cloud majors refine modular blocks for 15 MW increments. Pay-as-you-grow contracts appear in both camps, decoupling capital allocation from immediate occupancy. Edge operators deploy standardized micro power modules to keep pace with 5G rollouts. These intertwined strategies collectively elevate equipment volumes flowing into the data center power market.
The Data Center Power Market is Segmented by Component (Electrical Solutions and Services), Data Center Type (Hyperscaler/Cloud Service Providers, Colocation Providers, and More), Data Center Size (Small Size Data Centers, Medium Size Data Centers, Large Size Data Centers and More), Tier Type (Tier I and II, Tier III, Tier IV) and by Geography. The Market Forecasts are Provided in Terms of Value (USD)
Geography Analysis
Europe led with 34.18% revenue share in 2024, driven by binding energy-efficiency legislation, stringent reporting rules, and aggressive renewable goals. Operators retrofit legacy facilities with high-efficiency UPS and battery storage to satisfy the Energy Efficiency Directive. Coal-plant conversions such as Sines DC repurpose existing grid interconnections and seawater intake lines, accelerating deployment while curbing environmental impact. Vendors supply grid-interactive UPS that help stabilize wind-heavy regional grids, strengthening the continent's leadership in sustainable design. Corporate buyers prefer European sites because renewable guarantees of origin support net-zero pledges, sustaining equipment demand across the data center power market.
Asia-Pacific delivers the fastest 9.2% CAGR as governments fund cloud corridors and subsidize land, fiber, and electricity. Regional capacity totaled 12,206 MW of live IT load with 14,338 MW in construction as of H2 2024. Microsoft pledged multi-billion-dollar plans in India and Japan, highlighting the scale of expansion. China enforces a national PUE cap that accelerates high-efficiency power component orders. India's Digital Personal Data Protection Act drives domestic hosting and stimulates new campuses near renewable clusters. Southeast Asian nations offer tax breaks to attract hyperscalers, further widening procurement pipelines for switchgear, UPS, and smart PDUs.
- Schneider Electric SE
- Vertiv Holdings Co.
- ABB Ltd
- Eaton Corporation plc
- Legrand SA
- Huawei Technologies Co. Ltd
- Fujitsu Ltd
- Cisco Systems Inc.
- Rittal GmbH and Co. KG
- Mitsubishi Electric Corp.
- Cummins Inc.
- Kohler Power Systems
- PDU Experts UK Ltd
- Schleifenbauer Products BV
- Delta Electronics Inc.
- Caterpillar Inc.
- Socomec Group
- Tripp Lite (by Eaton)
- Riello UPS S.p.A.
- KEHUA Tech
Additional Benefits:
- The market estimate (ME) sheet in Excel format
- 3 months of analyst support
TABLE OF CONTENTS
1 INTRODUCTION
- 1.1 Study Assumptions and Market Definition
- 1.2 Scope of the Study
2 RESEARCH METHODOLOGY
3 EXECUTIVE SUMMARY
4 MARKET LANDSCAPE
- 4.1 Market Overview
- 4.2 Market Drivers
- 4.2.1 Hyperscale and cloud?computing expansion
- 4.2.2 AI-driven high-density workloads
- 4.2.3 Stricter uptime and redundancy standards
- 4.2.4 Sustainability and energy-efficiency mandates
- 4.2.5 Grid-interactive revenue streams
- 4.2.6 Coal-plant site repurposing for campuses
- 4.3 Market Restraints
- 4.3.1 High CAPEX of electrical infrastructure
- 4.3.2 Carbon-intensity regulations and reporting
- 4.3.3 Transformer/switchgear supply bottlenecks
- 4.3.4 Local opposition to sub-station expansion
- 4.4 Supply-Chain Analysis
- 4.5 Regulatory Landscape
- 4.6 Technological Outlook
- 4.7 Porter's Five Forces
- 4.7.1 Bargaining Power of Suppliers
- 4.7.2 Bargaining Power of Buyers
- 4.7.3 Threat of New Entrants
- 4.7.4 Threat of Substitutes
- 4.7.5 Degree of Competition
5 MARKET SIZE and GROWTH FORECASTS (VALUE)
- 5.1 By Component
- 5.1.1 Electrical Solutions
- 5.1.1.1 UPS Systems
- 5.1.1.2 Generators
- 5.1.1.2.1 Diesel Generators
- 5.1.1.2.2 Gas Generators
- 5.1.1.2.3 Hydrogen Fuel-cell Generators
- 5.1.1.3 Power Distribution Units
- 5.1.1.4 Switchgear
- 5.1.1.5 Transfer Switches
- 5.1.1.6 Remote Power Panels
- 5.1.1.7 Energy-storage Systems
- 5.1.2 Service
- 5.1.2.1 Installation and Commissioning
- 5.1.2.2 Maintenance and Support
- 5.1.2.3 Training and Consulting
- 5.1.1 Electrical Solutions
- 5.2 By Data Center Type
- 5.2.1 Hyperscaler/Cloud Service Providers
- 5.2.2 Colocation Providers
- 5.2.3 Enterprise and Edge Data Center
- 5.3 By Data Center Size
- 5.3.1 Small Size Data Centers
- 5.3.2 Medium Size Data Centers
- 5.3.3 Large Size Data Centers
- 5.3.4 Massive Size Data Centers
- 5.3.5 Mega Size Data Centers
- 5.4 By Tier Level
- 5.4.1 Tier I and II
- 5.4.2 Tier III
- 5.4.3 Tier IV
- 5.5 By Geography
- 5.5.1 North America
- 5.5.1.1 United States
- 5.5.1.2 Canada
- 5.5.1.3 Mexico
- 5.5.2 South America
- 5.5.2.1 Brazil
- 5.5.2.2 Argentina
- 5.5.2.3 Rest of South America
- 5.5.3 Europe
- 5.5.3.1 Germany
- 5.5.3.2 United Kingdom
- 5.5.3.3 France
- 5.5.3.4 Russia
- 5.5.3.5 Rest of Europe
- 5.5.4 Asia-Pacific
- 5.5.4.1 China
- 5.5.4.2 Japan
- 5.5.4.3 India
- 5.5.4.4 South Korea
- 5.5.4.5 Australia and New Zealand
- 5.5.4.6 Rest of Asia-Pacific
- 5.5.5 Middle East and Africa
- 5.5.5.1 Middle East
- 5.5.5.1.1 United Arab Emirates
- 5.5.5.1.2 Saudi Arabia
- 5.5.5.1.3 Turkey
- 5.5.5.1.4 Rest of Middle East
- 5.5.5.2 Africa
- 5.5.5.2.1 South Africa
- 5.5.5.2.2 Nigeria
- 5.5.5.2.3 Rest of Africa
- 5.5.1 North America
6 COMPETITIVE LANDSCAPE
- 6.1 Market Concentration
- 6.2 Strategic Moves
- 6.3 Market Share Analysis
- 6.4 Company Profiles (includes Global-level Overview, Market-level Overview, Core Segments, Financials as available, Strategic Information, Market Rank/Share for key companies, Products and Services, and Recent Developments)
- 6.4.1 Schneider Electric SE
- 6.4.2 Vertiv Holdings Co.
- 6.4.3 ABB Ltd
- 6.4.4 Eaton Corporation plc
- 6.4.5 Legrand SA
- 6.4.6 Huawei Technologies Co. Ltd
- 6.4.7 Fujitsu Ltd
- 6.4.8 Cisco Systems Inc.
- 6.4.9 Rittal GmbH and Co. KG
- 6.4.10 Mitsubishi Electric Corp.
- 6.4.11 Cummins Inc.
- 6.4.12 Kohler Power Systems
- 6.4.13 PDU Experts UK Ltd
- 6.4.14 Schleifenbauer Products BV
- 6.4.15 Delta Electronics Inc.
- 6.4.16 Caterpillar Inc.
- 6.4.17 Socomec Group
- 6.4.18 Tripp Lite (by Eaton)
- 6.4.19 Riello UPS S.p.A.
- 6.4.20 KEHUA Tech
7 MARKET OPPORTUNITIES and FUTURE OUTLOOK
- 7.1 White-space and Unmet-need Assessment
 資料中心電源市場:按組件類型、層級、資料中心類型和行業分類 - 全球市場預測(2026-2032 年)
 資料中心電源市場分析及預測(至2035年):類型、產品類型、服務、技術、組件、應用、部署模式、最終用戶、解決方案、交付模式
 2026年全球資料中心電力市場報告2026年全球資料中心電源管理市場報告伺服器電源市場:依產品類型、組件、額定功率、外形規格、應用、最終用戶和通路分類-2026-2030年全球預測資料中心以AC-DC電源市場:按組件、電源類型、冗餘方式和應用分類-2026-2032年全球預測資料中心電源系統氮化鎵市場分析及預測(至2035年):依類型、產品、服務、技術、組件、應用、形式、材料類型、裝置及部署方式分類
 全球資料中心電力市場規模、佔有率、趨勢和成長分析報告(2026-2034)全球資料中心電力市場:市場規模、佔有率、成長率、產業分析、依類型、應用和地區劃分的分析及預測(2026-2034 年)
 資料中心結構化佈線市場 - 全球產業規模、佔有率、趨勢、機會及預測(按組件、線纜類型、最終用戶、地區和競爭格局分類,2021-2031年)